Raman and infrared spectroscopic study of turquoise minerals
Jirˇí Cˇejka
a,b, Jirˇí Sejkora
a, Ivo Macek
a, Radana Malíková
a, Lina Wang
b, Ricardo Scholz
c, Yunfei Xi
b,
Ray L. Frost
b,⇑aDepartment of Mineralogy and Petrology, National Museum, Cirkusová 1740, CZ-193 00 Praha 9, Czech Republic
bSchool of Chemistry, Physics and Mechanical Engineering, Science and Engineering Faculty, Queensland University of Technology, GPO Box 2434, Brisbane, Queensland
4001, Australia
cGeology Department, School of Mines, Federal University of Ouro Preto, Campus Morro do Cruzeiro, Ouro Preto, MG 35,400-00, Brazil
h i g h l i g h t s
We have studied the Raman and infrared spectra of turquoise CuAl6(PO4)4(OH)84H2O.
Observed Raman and infrared bands were assigned.
Approximate O–H O hydrogen bond lengths were calculated from the Raman and infrared spectra. No Raman and infrared bands
attributable to (PO3OH)2 units were
observed.
g r a p h i c a l
a b s t r a c t
a r t i c l e
i n f o
Article history:
Received 14 September 2014 Received in revised form 8 April 2015 Accepted 16 April 2015
Available online 21 April 2015
Keywords: Turquoise Phosphate Hydroxyl ions Raman spectroscopy Infrared spectroscopy
a b s t r a c t
Raman and infrared spectra of three well-defined turquoise samples, CuAl6(PO4)4(OH)84H2O, from
Lavender Pit, Bisbee, Cochise county, Arizona; Kouroudaiko mine, Faleme river, Senegal and Lynch Station, Virginia were studied, interpreted and compared. Observed Raman and infrared bands were assigned to the stretching and bending vibrations of phosphate tetrahedra, water molecules and hydroxyl ions. Approximate O–H O hydrogen bond lengths were inferred from the Raman and infrared spectra. No Raman and infrared bands attributable to the stretching and bending vibrations of (PO3OH)2 units were
observed.
Ó2015 Elsevier B.V. All rights reserved.
Introduction
The mineral turquoise is one of the oldest gem materials known. Its use in jewellery and for personal decoration can be traced back 70 centuries, to ancient Egypt[1,2]. Today, turquoise is popular in fine jewellery as well as in various cultures, most notably among Native Americans in the south-western United States[1,2]. The first orientation of turquoise studies allows archaeologists to investigate pre-Colombian turquoise trade structures in North America and
identify or authenticate the natural sources of turquoise worldwide
[3–7]. Various physico-chemical characteristics of turquoise were studied together with questions of turquoise provenance especially with regard to its wealth of colors (blue, green in various shades) and further properties important for its use in jewellery[8–15]. The sources of high-quality gem turquoise are limited and because this material (due to porosity characteristic for massive aggregates) easily accepts many treatments, the majority of gem turquoise are adulterated[2,16,17]. Detection of the extent and character of these treatments, inclusive impregnation with polymers, is a very impor-tant job especially for use of non-destructive methods[18–21].
http://dx.doi.org/10.1016/j.saa.2015.04.029 1386-1425/Ó2015 Elsevier B.V. All rights reserved.
⇑ Corresponding author.
E-mail address:r.frost@qut.edu.au(R.L. Frost).
Contents lists available atScienceDirect
Spectrochimica Acta Part A: Molecular and
Biomolecular Spectroscopy
Turquoise was one of the first gem materials to be simulated by synthetics like glass, plastic, pressed turquoise powder bonded by resin, colored gelmagnesite or howlite[22]. At the present time, synthetic turquoise is produced by the method of Gilson[23]. A set of analytical methods, such as PXRD and EDS analysis or ATR-IR, UV–VIS–NIR and Raman spectra are used for distinguishing these artificial replacements from natural turquoise [24]. Last, but not least, turquoise affected by extended exposure to sunlight and water weathered to chalky white minerals; this alteration pro-cesses are as yet, poorly understood[3–4].
Most of as yet published papers on turquoise (as mentioned above) are, however, usually, based only on one or several research methods; especially in the case of papers focused to infrared or Raman spectroscopy the data on chemical composition or values of unit-cell parameters of studied mineral phases are mostly miss-ing. The main aim of this paper is to report the Raman and infrared spectra of three well-defined natural untreated turquoise samples from three different occurrences, and to relate the spectra to its molecular and crystal structure. Further aim of the paper is also to certify the possibility to use Raman data for the provenance of turquoise samples; this is the reason why three samples from var-ious localities differing in morphology, color and details in chemi-cal composition were studied. The paper follows the systematic research of the large group of oxyanions containing minerals
[25–29], and especially their molecular structure using IR and Raman spectroscopy[30–35].
Background information
Triclinic mineral turquoise belongs to a turquoise group; general formula for minerals of this group may be written as A0–1B6(PO4)4(OH)84H2O. Most common substituents at the A
position are Cu2+, Fe2+ Zn2+ or vacancy; at the B position then
Al3+or Fe3+[4,36–38].
Turquoise usually occurs as apple-green, bluish green, sky-blue or greenish gray fine granular, dense massive to cryptocrystalline aggregates, nodules, crusts or veinlets; small short columnar crys-tals are rare[1,39]. It has dozens of occurrences but only few pro-duce commercial gem material or contain well-formed crystals
[1,39]. Turquoise is uncommon supergene mineral formed in the oxidized zone (mainly in arid climates) of phosphorus-rich alumi-nous rocks (volcanic, phosphate-rich sediments, hydrothermal porphyry deposits, etc.) in the presence of Cu minerals[1,39].
The unit-cell parameters of turquoise were determined by Graham [40], the first solution of its crystal structure was pub-lished by Cid-Dresdner[41]. Recently, the crystal structure of tur-quoise refined by Kolitsch and Giester[42]. Turquoise contains in its crystal structure CuU6octahedra, withU= 2 H2O and 4 OH ,
two AlU6octahedra with 3 OH , 1 H2O and 2 O2 and one AlU6
octahedron with 4 O2 and 2 OH , and two symmetrically distinct
(PO4)3 tetrahedra[41,42]. No (PO3OH)2 units were observed in
its crystal structure [4,41,42]. Only in the case of planerite, Al6(PO4)2(PO3OH)24H2O, the charge balance should be maintained
by the protonation, connected with Cu-site occupancy decrease
[36]. However, according to Kolitsch and Giester[42], the charge balance might be also achieved by introducing additional Cu2+or
other cations in the partially occupied site at (1/2, 0, 1/2).
Experimental
Minerals
The studied samples of the mineral turquoise originated from three different occurrences: Lavender Pit, Bisbee, Cochise county, Arizona (labeled as A) – little greenish cryptocrystalline aggregates
up to some cm in size (Fig. 1); Kouroudaiko mine, Faleme river, Senegal (labeled as S) – light greenish blue globular aggregates up to 3 mm in size in association with tiny transparent senegalite crystals (Fig. 2); Lynch Station, Virginia (labeled as V) – rich groups of transparent dark sky-blue well-formed crystals up to 2 mm in size on quartz gangue (Fig. 3).
Fig. 1.Cryptocrystalline aggregates of turquoise, Lavender Pit, Bisbee, Cochise county, Arizona. Photo J. Sejkora, FOV 2 cm.
Fig. 2.Light greenish blue globular aggregates of turquoise in association with tiny transparent senegalite crystals, Kouroudaiko mine, Faleme river, Senegal. Photo J. Sejkora, FOV 3 cm. (For interpretation of the references to color in this figure legend, the reader is referred to the web version of this article.)
Fig. 3.Groups of transparent dark sky-blue well-formed turquoise crystals up to 2 mm in size on quartz gangue, Lynch Station, Virginia. Photo J. Sejkora, FOV 1 cm. (For interpretation of the references to color in this figure legend, the reader is referred to the web version of this article.)
Carefully hand-picked samples were used for X-ray powder diffraction experiments. To minimize the complicated shape of background, the samples studied were placed on a flat low-back-ground silicon wafer. Powder XRD measurements were carried out with CuK
a
radiation at a Bruker D8 Advance diffractometer (40 kV, 40 mA) in the range 4–70° 2h in the step-scan mode0.01°/8 s. The position and intensities of reflections were Table 2
Chemical composition of studied turquoise samples (wt.%).
Virginia Senegal Arizona Ideal
CaO 0.04 0.00 0.00
FeO⁄ 0.92 0.42 0.83
BaO 0.37 0.21 0.00
CuO 9.76 6.17 8.61 9.78
ZnO 0.12 0.24 0.13
Al2O3 35.37 37.92 37.33 37.60
Fe2O3⁄ 1.56 0.12 0.00
SiO2 0.00 0.00 0.09
P2O5 33.75 35.27 34.09 34.90
H2O⁄⁄ 17.52 17.90 17.62 17.72
Total 99.41 98.25 98.69 100.00
Ca2+ 0.006 0.000 0.000
Fe2+ 0.108 0.047 0.095
Ba2+ 0.020 0.011 0.000
Cu2+ 1.032 0.625 0.898
Zn2+ 0.013 0.023 0.013
RMe2+ 1.178 0.706 1.006
h 0.000 0.294 0.000
Al3+ 5.835 5.987 6.078
Fe3+ 0.165 0.013 0.000
RMe3+ 6.000 6.000 6.078
(SiO4) 0.000 0.000 0.012
(PO4) 4.000 3.706 3.988
(PO3OH) 0.000 0.294 0.000
RT 4.000 4.000 4.000
OH 8.356 7.706 8.236
H2O 4.00 4.00 4.00
FeO⁄and Fe
2O3⁄contents were calculated on the basis of Me2+/Me3+cations; H2O⁄⁄
content was calculated on the basis of charge balance and ideal content of 4 H2O
molecules.
Fig. 4a.Raman spectrum of turquoise sample from Arizona over the 100– 4000 cm1spectral range.
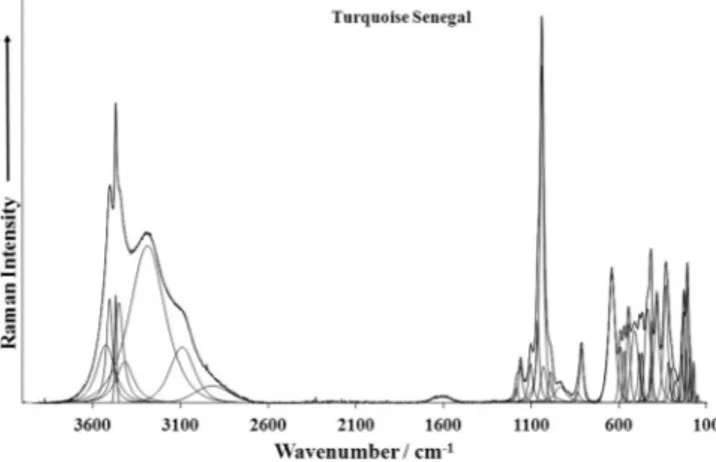
Fig. 4b.Raman spectrum of turquoise sample from Senegal over the 100– 4000 cm 1spectral range.
Table 1
Unit-cell parameters of turquoise samples (for triclinic space groupP-1).
Virginia Senegal Arizona [42] [38]
a[Å] 7.411 (3) 7.411 (5) 7.410 (5) 7.410(1) 7.426(8) b[Å] 7.632 (3) 7.635 (6) 7.635 (6) 7.633(1) 7.634(8) c[Å] 9.905 (4) 9.904 (7) 9.901 (7) 9.904(1) 9.91(1) a[°] 68.43 (3) 68.46 (5) 68.43 (5) 68.42(1) 68.67(8)
b[°] 69.65 (2) 69.64 (5) 69.63 (5) 69.65(1) 69.70(8) c[°] 65.05 (3) 65.03 (5) 65.05 (5) 65.01(1) 65.01(8) V[Å3] 459.9 (3) 460.0 (7) 459.7 (6) 460.3(1) 461.5(9)
Fig. 4c. Raman spectra of turquoise from Virginia over the 100–4000 cm1spectral
range.
Fig. 4d.Infrared spectra of turquoise from Arizona over the 500–4000 cm 1
spectral range.
calculated using the Pearson VII profile shape function in the ZDS program package[43]. The measured patterns were indexed using unit-cell parameters and space group proposed by Kolitsch and Giester[42]. The unit-cell parameters refined from measured pow-der XRD using the program of Burnham[44]are compared with published data in theTable 1.
All turquoise samples were quantitatively analyzed by Cameca SX 100 electron microprobe system in wavelength dispersion mode for chemical composition (Table 2). Studied sample was mounted into the epoxide resin and polished. The polished surface was coated with carbon layer 250 Å. An acceleration voltage of 15 kV, a specimen current of 10 nA, and a beam diameter of 5
l
m were used. Well-defined natural and synthetic compounds were used as standards. The raw intensities were converted to the concentrations using automaticPAPmatrix correction software package. On the basis of P + Si = 4apfu, empirical formula of turquoise from Arizona may be expressed as (Cu0.90Fe0.10Zn0.01)R1.01Al6.08[(PO4)3.99(SiO4)0.01]R4.00(OH)8.244H2O; from Senegal as (Cu0.63 0.29
Fe0.05Zn0.02Ba0.01)R1.00 (Al5.99Fe0.01)R6.00[(PO4)3.71(PO3OH)0.29]R4.00
(OH)7.714H2O and from Virginia as (Cu1.03Fe0.11Ba0.02Zn0.01
Ca0.01)R1.18(Al5.84Fe0.16)R6.00(PO4)4.00(OH)8.364H2O.
Raman and infrared spectroscopy
Fragments of aggregates and crystals of turquoise were placed on a polished metal surface on the stage of an Olympus BHSM microscope, which is equipped with 10, 20, and 50objectives.
The microscope is part of a Renishaw 1000 Raman microscope sys-tem, which also includes a monochromator, a filter system and a CCD detector (1024 pixels). The Raman spectra were excited by a Spectra-Physics model 127 He–Ne laser producing highly polarised light at 633 nm and collected at a nominal resolution of 2 cm 1and
a precision of ±1 cm 1in the range between 200 and 4000 cm 1.
Repeated acquisition on the crystals using the highest magnifica-tion (50) were accumulated to improve the signal to noise ratio
in the spectra. Spectra were calibrated using the 520.5 cm 1line
of a silicon wafer. Previous studies by the authors provide more
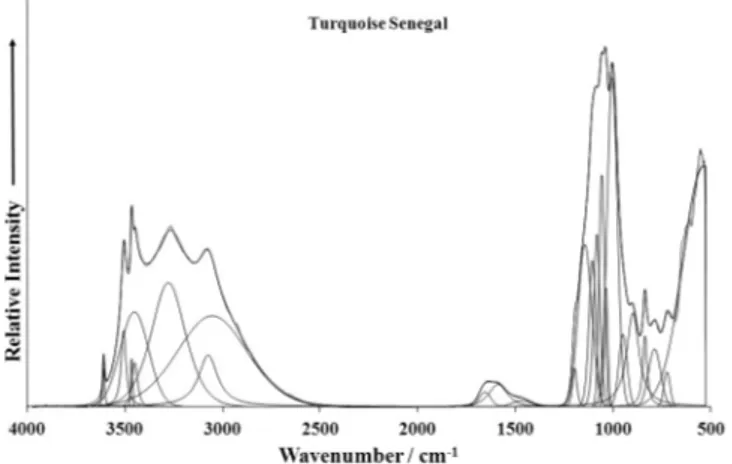
Fig. 4e.Infrared spectra of turquoise from Senegal over the 500–4000 cm1
spectral range.
Fig. 4f.Infrared spectra of turquoise from Virginia over the 500–4000 cm1spectral
range.
Table 3
details of the experimental technique. Alignment of all samples in a similar orientation has been attempted and achieved. However, differences in intensity may be observed due to minor differences in the crystal orientation.
Infrared spectra was recorded by micro diffuse reflectance method (DRIFTS) on a Nicolet Magna 760 FTIR spectrometer (range 4000–600 cm 1, resolution 4 cm 1, 128 scans, 2 level zero-filtering,
Happ-Genzel apodization), equipped with Spectra Tech InspectIR
micro FTIR accessory. Sample of amount less than 0.050 mg was mixed without using pressure with KBr. Samples were immediately recorded together with the same KBr as a reference.
Spectral manipulation such as baseline correction/adjustment and smoothing were performed using the Spectracalc software package GRAMS (Galactic Industries Corporation, NH, USA). Band component analysis was undertaken using the Jandel ‘Peakfit’ soft-ware package that enabled the type of fitting function to be
Fig. 5a.Raman spectrum of turquoise from Arizona over the 2600–3800 cm1
spectral range.
Fig. 5b.Raman spectrum of turquoise from Senegal over the 2600–3800 cm1
spectral range.
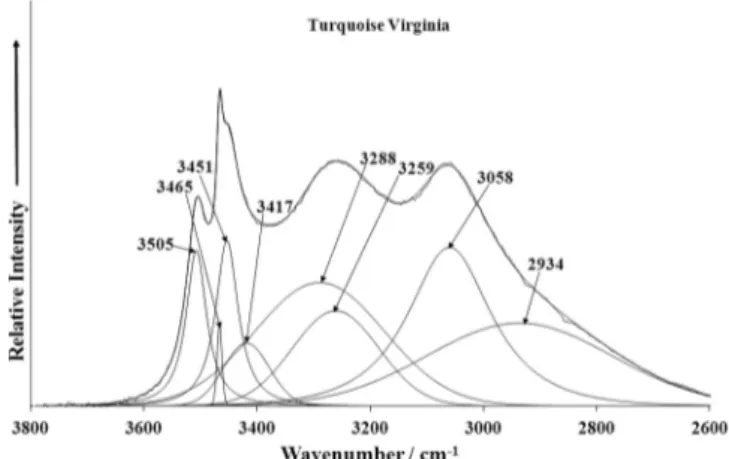
Fig. 5c.Raman spectrum of turquoise from Virginia over the 2600–3800 cm1
spectral range.
Fig. 5d.Infrared spectrum of turquoise from Arizona over the 2600–3800 cm 1
range.
Fig. 5e.Infrared spectrum of turquoise from Senegal over the 2600–3800 cm 1
range.
Fig. 5f.Infrared spectrum of turquoise from Virginia over the 2600–3800 cm 1
range.
selected and allows specific parameters to be fixed or varied accordingly. Band fitting was done using a Lorentzian–Gaussian cross-product function with the minimum number of component bands used for the fitting process. The Lorentzian–Gaussian ratio was maintained at values greater than 0.7 and fitting was under-taken until reproducible results were obtained with squared corre-lations ofr2greater than 0.995.
Results and discussion
Crystal symmetry and vibrational spectra of turquoise
Turquoise, CuAl6(PO4)4(OH)84H2O, is triclinic, space groupP-1
– Ci1, Z= 1. The structure consists of distorted CuO6 polyhedra,
AlO6octahedra and PO4tetrahedra. By edge- and corner-sharing
of these polyhedra a fairly dense three-dimensional framework is formed which is further strengthened by a system of hydrogen bonds[42].
In the crystal structure of turquoise there are one symmetrically distinct CuO6octahedron, three structurally distinct AlO6
octahe-dra, two symmetrically distinct PO4 tetrahedra, two structurally
unequivalent water molecules and four structurally unequivalent OH units[41,42]. Tentative interpretation of infrared and Raman spectra of turquoise studied is based on factor group analysis of phosphates and water in turquoise published by Frost et al.[13]
and publications by Nakamoto[45], Cˇejka et al.[35], Keller[46– 49], Pechkovskii et al.[50], Goldsmith and Ross [51], Devamani and Alagar[52], Aguirre et al.[53], Frost et al.[13,54]and Reddy et al.[14].
According to Nakamoto[45], octahedral units XY6 exhibit six
normal vibrations, from which
m
1(A1g) andm
2(Eg) stretching andm
5(F2g) bending vibrations are Raman active, while onlym
3(F1u)stretching and
m
4 (F1u) bending vibrations are infrared active.Symmetry lowering in the case of XY4Z2may cause Raman and
infrared activation of corresponding vibrations and also splitting of degenerate vibrations. Free (PO4)3 anion exhibits tetrahedral
Td symmetry. In the case of a free ion ofTdsymmetry, there are
9 normal vibrations characterized by four distinguishable modes of vibrations:
m
1(A1) symmetric stretching vibration, Raman active,m
2(d) (E) doubly degenerate bending vibration, Raman active,m
3(F2) triply degenerate antisymmetric stretching vibration, Raman
and infrared active,
m
4(d) (F2) triply degenerate bending vibration,Raman and infrared active.Tdsymmetry lowering may cause
infra-red activation of the
m
1andm
2vibrations and splitting of thedou-bly degenerate
m
2and triply degeneratem
3andm
4vibrations[35].Raman and infrared spectroscopy
Full range Raman and infrared spectra of the studied minerals from Arizona (A), Senegal (S) and Virginia (V) are given in
Figs. 4a–fand their tentative assignments inTable 3. These spectra show the position of the bands and their relative intensities. It is obvious that there are large parts of the spectra where little or no intensity is observed. Therefore, the spectra are subdivided into sections according to the type of vibration is being investigated. In this way the precise position of the bands can be detailed. Observed wavenumbers of the Raman bands of the studied tur-quoise samples are close to the approximate wavenumbers inferred from the Raman spectra of RRUFF’s three turquois samples R50225, R50418 and R50554.
Raman and infrared spectral regions of
m
OH stretching vibra-tions are presented in Figs. 5a–f. Raman bands et 3544, 3502, 3473 and 3450 cm 1 (A), 3527, 3506, 3471 and 3453 cm 1 (S)and 3499, 3473 and 3451 cm 1(V) and infrared bands at 3509,
3465 and 3451 cm 1(A), 3607, 3506, 3464, 3450 and 3447 cm 1
(S) and 3505, 3465 and 3451 cm 1 (V) are assigned to the
m
OHstretching vibrations and assigned to the hydrogen bonded, sym-metrically distinct hydroxyls OH . Raman bands at 3397, 3279 and 3077 cm 1 (A), 3419, 3290 and 3092 cm 1 (S), 3410, 3273
and 3085 cm 1(V), and infrared spectra at 3431, 3269, 3075 and
3067 cm 1 (A), 3276, 3072 and 3051 cm 1 (S) and 3417, 3288
and 3058 cm 1(V) are attributed to the
m
OH stretching vibrationsof symmetrically distinct hydrogen bonded water molecules. Very
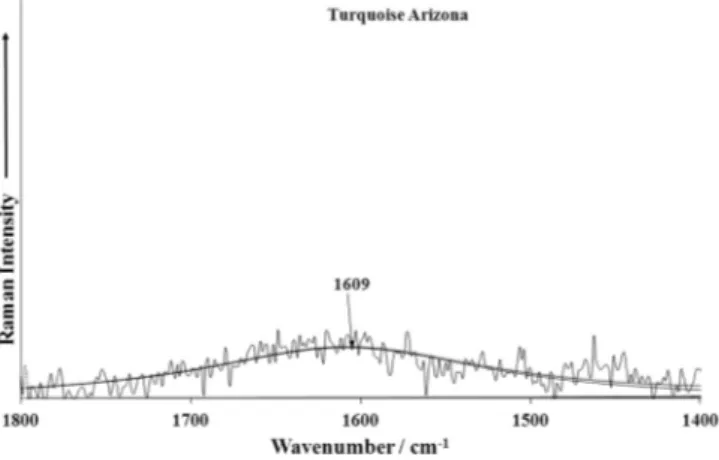
Fig. 6a.Raman spectrum of turquoise from Arizona over the 1400–1800 cm1
spectral range.
Fig. 6b.Raman spectrum of turquoise from Senegal over the 1400–1800 cm 1
spectral range.
Fig. 6c.Raman spectrum of turquoise from Virginia over the 1400–1800 cm 1
range.
weak Raman and infrared bands at 2932, 2920 and 2934 cm 1are
probably connected with organic impurities.
Libowitzky’s empirical relation [55]enables to infer from the wavenumbers of Raman and infrared bands of minerals assigned to the
m
OH stretching vibrations approximate O–H O hydrogenbond lengths. In the case of studied turquoise samples inferred hydrogen bond lengths vary from 2.98 to 2.67 Å. This agrees very
well with X-ray single crystal structure data 2.970–2.670 Å [41]
and 3.020–2.685 Å[42].
Broad Raman bands at 1609 cm 1 (A), 1614 cm 1 (S) and
1632 cm 1 (V) and infrared bands at 1646 and 1595 cm 1 (A),
1654 and 1587 cm 1(S) and 1622 cm 1(V) are attributed to the
m
2(d) H2O bending vibrations of the symmetrically distinctdiffer-ently hydrogen bonded water molecules (Figs. 6a–f). Observed infrared bands at 1474 cm 1 (A), 1467 cm 1 (S) and 1513 cm 1
(V) are assigned to overtones or combination bands.
Fig. 6d.Infrared spectrum of turquoise from Arizona over the 1300–1800 cm 1
range.
Fig. 6e.Infrared spectrum of turquoise from Senegal over the 1300–1800 cm 1
range.
Fig. 6f.Infrared spectrum of turquoise from Virginia over the 1450–1750 cm1
range.
Fig. 7a.Raman spectrum of turquoise from Arizona over the 800–1400 cm1range.
Fig. 7b.Raman spectrum of turquoise from Senegal over the 800–1400 cm 1range.
Fig. 7c.Raman spectrum of turquoise from Virginia over the 800–1400 cm1range.
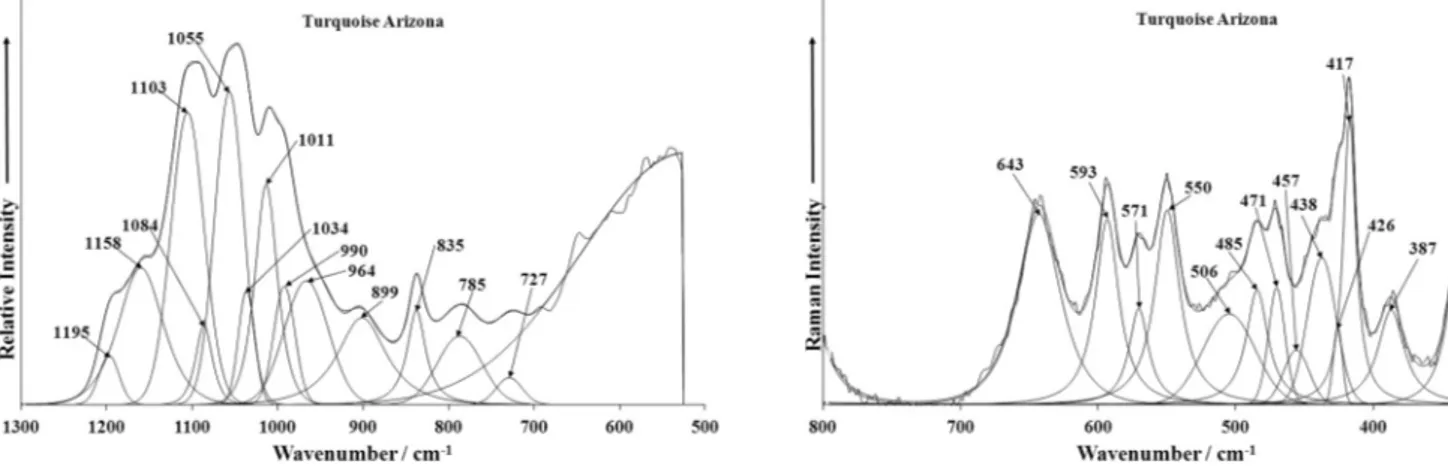
The Raman spectra in the 800–1400 cm 1 spectral range and
infrared spectra in the 500–1300 cm 1spectral range are reported
inFigs. 7a–f. Raman bands at 1173, 1160 and 1105 cm 1(A), 1184,
1161 and 1104 cm 1(S), and 1185, 1162 and 1105 cm 1(V) and
infrared bands and shoulders at 1195, 1158, 1103 and 1084 cm 1
(A), 1194, 1143, 1104 and 1082 cm 1 (S), and 1192, 1142, 1110
and 1092 cm 1(V) are connected with split triply degenerate
m
3(PO4)3 antisymmetric stretching vibrations.
Very intense Raman bands at 1042 cm 1 (A), 1041 cm 1 (S),
1042 cm 1 (V) and infrared bands at 1055 cm 1 (A), 1056 cm 1
(S), 1042 cm 1(V) are assigned to the
m
1(PO4)3 symmetric
stretch-ing vibrations. Raman bands at 1065 cm 1(A), 1064 cm 1(S) and
1065 cm 1(V) are also related to the
m
1(PO4)3 vibrations. Some
of the Raman bands and shoulders at 1004, 985 and 931 cm 1(A),
1031, 991, 935 cm 1(S), 1020, 985, 942, 889 cm 1(V) and infrared
bands and shoulders 1034, 1011, 990, 964, 899 cm 1 (A), 1035,
1002, 948, 897 cm 1(S), 1008, 991, 956, 897 cm 1 (V) may also
be related to these vibrations, however more probably may be
Fig. 7d.Infrared spectrum of turquoise from Arizona over the 500–1300 cm1
range.
Fig. 7e.Infrared spectrum of turquoise from Arizona over the 500–1300 cm1
range.
Fig. 7f.Infrared spectrum of turquoise from Virginia over the 500–1300 cm1
range.
Fig. 8a.Raman spectrum of turquoise from Arizona over the 300–800 cm1range.
Fig. 8b.Raman spectrum of turquoise from Senegal over the 300–800 cm 1range.
Fig. 8c.Raman spectrum of turquoise from Virginia over the 300–800 cm 1range.
attributed to thedAl–OH anddCu–OH bending vibrations together
with the Raman bands at 815 cm 1 (A), 836 and 815 cm 1 (S),
811 cm 1 (V) and infrared bands at 835 cm 1 (A), 835 cm 1 (S),
835 cm 1(V), while the infrared bands at 785 and 727 cm 1(A),
786 and 722 cm 1(S), 784, 723 cm 1(V) are assigned to the
libra-tional modes of water molecules.
Because the character of the Raman spectra of all three studied turquoise samples in the region from 1200 to 900 cm 1is
practi-cally identical, it is very improbable that in the structure of the tur-quoise sample from Senegal could be present the (PO3OH)2 units,
as expected from the mechanism of planerite substitution pro-posed by Foord and Taggart [36]. More distinctive is therefore the explanation of vacancy given by Kolitsch and Giester[42].
The Raman spectra of turquoise in the 300–800 cm 1spectral
range are displayed inFigs. 8a–c. Raman bands and shoulders at 643, 593, 571 and 550 cm 1(A), 642, 592, 571 and 548 cm 1(S),
663, 644, 629, 611, 593, 571 and 551 cm 1(V) are assigned to the
split out-of-plane triply degenerate
m
4(d) (PO4)3 bendingvibra-tions. Some of observed bands, however, may be also connected with the Al(O,OH) bending vibrations and Cu–O stretching vibra-tions. Coincidence (an overlap) of the mentioned vibrations is sup-posed. Raman bands and shoulders at 506, 485, 471, 457, 438, 426, 417 and 387 cm 1 (A), 511, 483, 469, 460, 437, 423, 417 and
385 cm 1 (S), 511, 498, 486, 469, 449, 437, 425, 417, 409 and
385 cm 1 (V) are related to the split doubly degenerate
m
2 (d)(PO4)3 bending vibrations. These bands may partly overlap with
bands of Cu–O stretching vibrations and bending vibrations. Raman bands at 337, 321 and 303 cm 1 (A), 335, 320 and
301 cm 1(S), 367, 339, 319 and 303 cm 1(V). – these bands may
probably be related to the stretching and bending vibrations of Cu–(O,OH,H2O) and Al–(O,OH,H2O). Raman bands observed in the
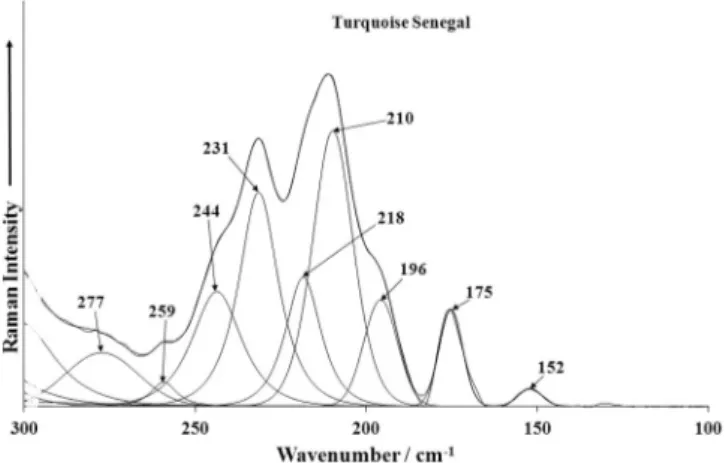
region from 300 to 100 cm 1 (Figs. 9a–c) may be assigned to
OCuO bending vibrations, OAlO bending vibrations and lattice vibrations.
Conclusions
1. Raman and infrared spectra of three well defined turquoise samples were recorded.
2. Observed Raman and infrared bands are tentatively interpreted and assigned to the stretching and bending vibrations of (PO4)3 tetrahedra and of vibrations of hydrogen bonded water
molecules and hydroxyl ions. No Raman and infrared bands which could be unambiguously attributed to the stretching and bending vibrations (PO3OH)2 were observed.
3. Approximate O–H O hydrogen bond lengths are inferred from
observed Raman and infrared bands connected with the
m
OH stretching vibrations of water molecules and hydroxyl ions. 4. Observed Raman and infrared spectra of studied turquoisesam-ples are very similar and comparable. From the results may be inferred that Raman spectroscopy may be very well used to dis-tinguish natural turquoise samples from possible imitations including impregnations of natural material. Vibrational spectra of natural turquoise samples from various localities possessing different morphology, colors etc. are very close. Vibrational spectroscopy cannot be therefore offer reliable data for the provenance determination of natural turquoise.
Acknowledgements
The financial and infra-structure support of the Discipline of Nanotechnology and Molecular Science, Science and Engineering Faculty of the Queensland University of Technology, is gratefully acknowledged. The Australian Research Council (ARC) is thanked for funding the instrumentation. This work was financially sup-ported by the long-term project DKRVO 2014/02–2015/02 of the Ministry of Culture of the Czech Republic (National Museum, 00023272). The downloading of the Raman spectra of turquoise from the RRUFF web site is acknowledged.
References
[1]O.T. Branson, Turquoise, the Gem of the Centuries, Treasure Chest Publication, Tucson, Arizona, 1975. 62 pp.
[2]E. Fritsch, S.F. McClure, M. Ostrooumov, Y. Andres, T. Moses, J.I. Koivula, R.C. Kammerling, Gems Gemol. 35 (1999) 4–16.
Fig. 9a.Raman spectrum of turquoise from Arizona over the 100–300 cm1range.
Fig. 9b.Raman spectrum of turquoise from Senegal over the 100–300 cm1range.
Fig. 9c.Raman spectrum of turquoise from Virginia over the 100–300 cm 1range.
[3]S. Hull, M. Fayek, F.J. Mathien, P. Shelley, K. Roler Durand, J. Archaeological Sci. 35 (2008) 1355–1369.
[4]Y.A. Abdu, S.K. Hull, M. Fayek, F.C. Hawthorne, Am. Miner. 96 (2011) 1433– 1442.
[5]Q. Chen, L. Qi, J. Chen, Spectrosc. Spectral Anal. 29 (2009) 406–409. [6]L. She, Y. Qin, M. Feng, Z. Mao, C. Xu, F. Huang, Guang pu 28 (2008) 2107–2110. [7]Q. Chen, Z. Yin, L. Qi, Y. Xiong, Gems Gemol. 48 (2012) 198–204.
[8]Q. Chen, L. Qi, J. Miner. Petrol. 27 (2007) 30–35.
[9]Z. Jiang, D. Chen, W. Wang, W. Li, X. Cao, Q. Wu, Acta Miner. Sin. (1983) 198– 206.
[10]X.A. Li, Y.F. Wang, H.F. Zhang, Acta Miner. Sin. (1984) 78–83.
[11]L.J. Luan, Z.X. Han, C.Y. Wang, Y.W. Zhang, Northwestern Geol. 37 (2004) 77– 82.
[12]H.F. Zhang, C.Y. Lin, Z.W. Ma, Z.G. Yang, Acta Miner. Sin. (1982) 254–261. [13]R.L. Frost, B.J. Reddy, W.N. Martens, M. Weier, J. Mol. Struct. 788 (2006) 224–
231.
[14]B.J. Reddy, R.L. Frost, M.L. Weier, W.N. Martens, J. Near Infrared Spectrosc. 14 (2006) 241–250.
[15] H. Pristacz, M. Wildner, R. Škoda, F. Koller, E. Libowitzky, EMC2012 –European Mineralogical Conference, 1 (2012) 461.
[16]B. Cervelle, La Rech. 163 (1985) 244–247.
[17]R.T. Liddicoat Jr., Handbook of Gem Identification, 12th ed., Gemological Institute of America, Santa Monica, California, 1989.
[18]Q. Chen, L. Qi, Y. Zhang, J. Gems Gemol. (2006) 9–12.
[19]K.S. Moe, T.M. Moses, P. Johnson, Gems Gemol. 43 (2007) 149–151. [20]A. Pavese, L. Prosperi, M. Dapiaggi, Austr. Gemol. 22 (2005) 366–371. [21]J. Zhou, X. Yuan, J. Gems Gemol. (2008) 31–35.
[22]D. Elwell, Man-made Gemstones, John Wiley Sons, New York, 1979. [23]J.D. Williams, D. Nassau, Gems Gemol. 15 (1976) 226–232.
[24] H. Pristacz, M. Wildner, V.M.F. Hammer, E. Libowitzky, Corals-2013, Conference on Raman and Luminiscence Spectroscopy in the Earth Sciences, 2013, 81–82.
[25]J. Sejkora, T. Rˇídkošil, V. Šrein, N. Jb. Miner. Abh. 175 (1999) 105–124. [26]J. Sejkora, F.C. Hawthorne, M.A. Cooper, J.D. Grice, J. Vajdak, J.L. Jambor, Can.
Miner. 47 (2009) 159–164.
[27]J. Sejkora, J. Plášil, B. Bureš, Bull. Miner. Petrol. Odd. Nár. Muz. (Praha) 21 (2013) 143–156 (in Czech).
[28]J. Sejkora, P. Škácha, V. Venclík, J. Plášil, Bull. Miner. Petrol. Odd. Nár. Muz. (Praha) 21 (2013) 113–130 (in Czech).
[29]L. Vrtiška, J. Sejkora, H. Nováková, M. Vašinová Galiová, Bull. Miner. Petrol. Odd. Nár. Muz. (Praha) 21 (2013) 240–248 (in Czech).
[30]R.L. Frost, J. Cˇejka, J. Sejkora, D. Ozdín, S. Bahfenne, E.C. Keeffe, J. Raman Spectrosc. 40 (2009) 1907–1910.
[31]J. Cˇejka, R.L. Frost, J. Sejkora, E.C. Keefee, J. Raman Spectrosc. 40 (2009) 1464– 1468.
[32]R.L. Frost, J. Sejkora, J. Cˇejka, E.C. Keeffe, J. Raman Spectrosc. 40 (2009) 1546– 1550.
[33]R.L. Frost, S.J. Palmer, Y. Xi, J. Cˇejka, J. Sejkora, J. Plášil, Spectrochim. Acta A Mol. Biomol. Spectrosc. 103 (2013) 431–434.
[34]J. Sejkora, J. Cˇejka, R. Malíková, A. López, Y. Xi, R.L. Frost, Spectrochim. Acta A130 (2014) 83–89.
[35]J. Cˇejka, J. Sejkora, I. Macek, R.L. Frost, A. López, R. Scholz, Y. Xi, Spectrochim. Acta A126 (2014) 157–163.
[36]E.E. Foord, J.E. Taggart Jr., Miner. Mag. 62 (1998) 93–111.
[37]J. Sejkora, R. Škoda, P. Ondruš, J. Czech Geol. Soc. 51 (2006) 159–187. [38]J. Sejkora, J. Cícha, I. Jebavá, Bull. Miner. Petrol. Odd. Nár. Muz. (Praha) 19
(2011) 1–26 (in Czech).
[39]J.W. Anthony, R.A. Bideaux, K.W. Bladh, M.C. Nichols, Handbook of Mineralogy, Vol. 4, Arsenates, phosphates, vanadates, Mineral data publishing, Tucson, Arizona, 2000. 680 pp.
[40]A.R. Graham, Univ. Toronto Stud. Geo. Ser. 52 (1948) 39–53. [41]H. Cid-Dresdner, Zeit. Kristal. 121 (1965) 87–113. [42]U. Kolitsch, G. Giester, Mineral. Mag. 64 (2000) 905–913.
[43] P. Ondruš, ZDS – software for analysis of X-ray powder diffraction patterns. Version 6.01. User’s guide, Prague, 1995.
[44]C.W. Burnham, Carnegie Inst. Wash. Yearb. 61 (1962) 132–135.
[45]K. Nakamoto, Infrared and Raman Spectra of Inorganic Coordination Compounds, J. Wiley and Sons, New York, 1986.
[46]P. Keller, N. Jb. Miner. Mh. (H.11) (1971) 491–510. [47]P. Keller, N. Jb. Miner. Abh. 117 (1972) 217–252. [48]P. Keller, N. Jb. Miner. Abh. 119 (1973) 310–334. [49]P. Keller, N. Jb. Miner. Abh. 120 (1974) 229–269.
[50] V.V. Pechkovskii, R. Ya. Mel’nikova, E.D. Dzyuba, T.I. Baranikova, M.V. Nikanovich, Atlas of Infrared Spectra of Phosphates. Orthophosphates, Nauka Moscow, 1981 (in Russian).
[51]J.A. Goldsmith, S.D. Ross, Spectrochim. Acta A24 (1968) (1968) 2131–2137. [52]R.H.P. Devamani, M. Alagar, Nano Biomed. Eng. 5 (2013) 116–120. [53]J.M. Aguirre, A. Gutiérrez, O. Giraldo, J. Braz. Chem. Soc. 22 (2011) 546–551. [54]R.L. Frost, W.N. Martens, L. Rintoul, E. Mahmutagic, J.T. Kloprogge, J. Raman
Spectrosc. 33 (2002) 252–259.