The molecular structure of the phosphate mineral chalcosiderite –
A vibrational spectroscopic study
Ray L. Frost
a,⇑, Yunfei Xi
a, Ricardo Scholz
b, Carlos Augusto de Brito Ribeiro
baSchool of Chemistry, Physics and Mechanical Engineering, Science and Engineering Faculty, Queensland University of Technology, GPO Box 2434, Brisbane Queensland 4001, Australia bGeology Department, School of Mines, Federal University of Ouro Preto, Campus Morro do Cruzeiro, Ouro Preto, MG 35400-00, Brazil
h i g h l i g h t s
"We have studied chalcosiderite CuFe6(PO4)4(OH)84H2O by Raman spectroscopy and by infrared spectroscopy.
"Two phosphate stretching vibrations at 1042 and 1062 cm1in line with the two independent phosphate units in the structure.
"Them2andm4bending regions are complex.
"Hydrogen bond distances were calculated.
g r a p h i c a l
a b s t r a c t
a r t i c l e
i n f o
Article history:
Received 8 November 2012
Received in revised form 11 February 2013 Accepted 12 February 2013
Available online 14 March 2013
Keywords: Chalcosiderite Turquoise Planerite Faustite Phosphate Raman spectroscopy
a b s t r a c t
The mineral chalcosiderite with formula CuFe6(PO4)4(OH)84H2O has been studied by Raman spectros-copy and by infrared spectrosspectros-copy. A comparison of the chalcosiderite spectra is made with the spectra of turquoise. The spectra of the mineral samples are very similar in the 1200–900 cm1region but strong differences are observed in the 900–100 cm1region. The effect of substitution of Fe for Al in chalcoside-rite shifts the bands to lower wavenumbers. Factor group analysis (FGA) implies four OH stretching vibra-tions for both the water and hydroxyl units. Two bands ascribed to water are observed at 3276 and 3072 cm1. Three hydroxyl stretching vibrations are observed. Calculations using a Libowitzky type for-mula show that the hydrogen bond distances of the water molecules are 2.745and 2.812Å which are con-siderably shorter than the values for the hydroxyl units 2.896, 2.917 and 2.978Å. Two phosphate stretching vibrations at 1042 and 1062 cm1in line with the two independent phosphate units in the structure of chalcosiderite. Three bands are observed at 1102, 1159 and 1194 cm1assigned to the phos-phate antisymmetric stretching vibrations. FGA predicts six bands but only three are observed due to accidental degeneracy. Both them2andm4bending regions are complex. Four Raman bands observed at
536, 580, 598 and 636 cm1are assigned to them
4bending modes. Raman bands at 415, 420, 475 and 484 cm1are assigned to the phosphatem
2bending modes. Vibrational spectroscopy enables aspects of the molecular structure of chalcosiderite to be assessed.
Ó2013 Elsevier B.V. All rights reserved.
Introduction
Chalcosiderite is a member of the turquoise mineral group. These are hydrated basic phosphates based upon the formula
AB6(PO4)xPO3(OH)2x(OH)84H2O where A is Ca, Cu2+, Fe2+, Zn
and B is Al, Fe3+or Cr3+[1]. The minerals have been known for
an extended period of time[2–6]. From an early time, the crystal
structure has been explored[7–10]. The minerals are triclinic as
is shown inFig. 1. Cid-Dresdner showed the crystal structure of
turquoise, CuAl6(PO4)4(OH)84H2O, consists of zig-zag chains of
Al octahedra running in the direction of thebaxis and sharing
corners with each other and with P tetrahedra. The Cu is in
1386-1425/$ - see front matterÓ2013 Elsevier B.V. All rights reserved.
http://dx.doi.org/10.1016/j.saa.2013.02.023
⇑Corresponding author. Tel.: +61 7 3138 2407; fax: +61 7 3138 1804. E-mail address:[email protected](R.L. Frost).
Contents lists available atSciVerse ScienceDirect
Spectrochimica Acta Part A: Molecular and
Biomolecular Spectroscopy
distorted octahedral coordination, sharing four edges with four Al octahedra. Turquoise is the Al end member and Fe the end mem-ber is chalcosiderite.
The amount of published data on the Raman spectra of mineral phosphates is limited. There has been almost no published spectra
on the turquoise mineral group[11–13]. The Raman spectra of the
hydrated hydroxy phosphate minerals have not been reported. In aqueous systems, Raman spectra of phosphate oxyanions show a
symmetric stretching mode (
m
1) at 938 cm1, the antisymmetricstretching mode (
m
3) at 1017 cm1, the symmetric bending mode(
m
2) at 420 cm1and them
4mode at 567 cm1[14–16]. S.D. Ross in
Farmer (1974) (page 404) listed some well-known minerals contain-ing phosphate which were either hydrated or hydroxylated or both
[17]. The value for the
m
1symmetric stretching vibration of PO4unitsas determined by infrared spectroscopy was given as 930 cm1
(aug-elite), 940 cm1 (wavellite), 970 cm1 (rockbridgeite), 995 cm1
(dufrenite) and 965 cm1(beraunite). The position of the symmetric
stretching vibration is mineral dependent and a function of the cat-ion and crystal structure. The fact that the symmetric stretching mode is observed in the infrared spectrum affirms a reduction in
symmetry of the PO4units. Raman spectroscopy has proven most
useful for the study of mineral structure. The objective of this re-search is to report the Raman and infrared spectra of chalcosiderite and to relate the spectra to the mineral structure.
Experimental
Samples description and preparation
The chalcosiderite sample studied in this work was collected from the Siglo XX mine (also named Llallagua), a tin deposit lo-cated in the Andes Mountain, Bustillo Province, northern of Potosi department, Bolivia. In the middle of the 20th century Siglo XX was the most productive tin mine in the world. The mine is also an important source for rare and unusual secondary phosphate min-erals and is the type locality for a number of rare phosphates such as vauxite, paravauxite, metavauxite and jeanbandyite. The host rock is a conical subvolcanic stock of Tertiary age and the ore de-posit is made up of porphyry and porphyry breccias. Hydrothermal alteration was responsible for the replacement of the primary min-eralogy and the development of cericitization and tourmalinization
[18].
In the Siglo XX mine, light blue to greenish blue chalcosiderite spheres and botryodal aggregates of crystals up to 5.0 mm in length mainly occur in association or as pseudomorph of paravaux-ite. Other secondary phosphates such as vivianite, wavellite, metavauxite, sigloite, crandallite and childrenite also can be found in association. The sample was incorporated to the collection of the Geology Department of the Federal University of Ouro Preto, Minas Gerais, Brazil, with sample code SAB-013. An image of the studied
sample is presented asSupplementary information (S1). The
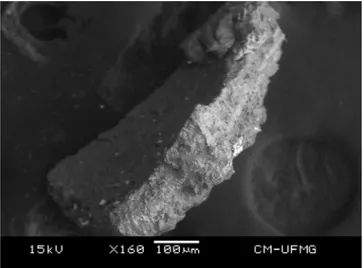
sam-ple was gently crushed and the associated minerals were removed under a stereomicroscope Leica MZ4. A fragment of pure
chalco-siderite was selected and a SEM/EDS image is shown in Fig. 1.
The mineral sample was phase analysed by X-ray diffraction.
Scanning electron microscopy (SEM)
Experiments and analyses involving electron microscopy were performed in the centre of Microscopy of the Universidade Federal Fig. 1.Backscattered electron image (BSI) of a chalcosiderite single crystal up to
0.5 mm in length.
Fig. 2.EDS analysis of chalcosiderite.
de Minas Gerais, Belo Horizonte, Minas Gerais, Brazil (http:// www.microscopia.ufmg.br).
Chalcosiderite crystals were coated with a 5 nm layer of evapo-rated carbon. Secondary Electron and Backscattering Electron images were obtained using a JEOL JSM-6360LV equipment. Qual-itative and semi-quantQual-itative chemical analyses in the EDS mode were performed with a ThermoNORAN spectrometer model Quest and was applied to support the mineral characterization.
Raman microprobe spectroscopy
Crystals of chalcosiderite were placed on a polished metal sur-face on the stage of an Olympus BHSM microscope, which is
equipped with 10, 20, and 50objectives. The microscope is
part of a Renishaw 1000 Raman microscope system, which also in-cludes a monochromator, a filter system and a CCD detector (1024 pixels). The Raman spectra were excited by a Spectra-Physics mod-el 127 He–Ne laser producing highly polarised light at 633 nm and
collected at a nominal resolution of 2 cm1 and a precision of
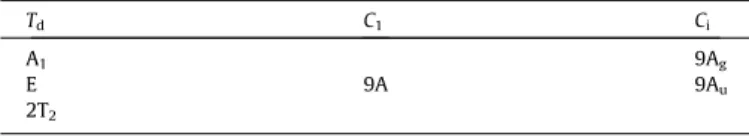
Table 1
Factor group analysis of 2PO3
4 vibrations.
Td C1 Ci
A1 9Ag
E 9A 9Au
2T2
Table 2
Factor group analysis of 2H2O vibrations.
C2v C1 Ci
2A1 3A 3Ag
B2 3Au
Lattice vibrations
C= 57Au+ 57Ag Internal PO3
4 vibrations = 36 Internal H2O vibrations = 12 Lattice vibrations = 114 Total vibrations = 162 N= 55–CuAl6(PO4)4(OH)84H2O 3n3 = 355–3.
±1 cm1in the range between 200 and 4000 cm1. Repeated
acqui-sitions on the crystals using the highest magnification (50) were
accumulated to improve the signal to noise ratio of the spectra.
Ra-man Spectra were calibrated using the 520.5 cm1line of a silicon
wafer. The Raman spectrum of at least 10 crystals was collected to ensure the consistency of the spectra.
An image of the chalcosiderite crystals measured is shown in
Fig. 1. Clearly the crystals of chalcosiderite are readily observed,
making the Raman spectroscopic measurements readily
obtainable.
Infrared spectroscopy
Infrared spectra were obtained using a Nicolet Nexus 870 FTIR spectrometer with a smart endurance single bounce diamond
ATR cell. Spectra over the 4000–525 cm1 range were obtained
by the co-addition of 128 scans with a resolution of 4 cm1and a
mirror velocity of 0.6329 cm/s. Spectra were co-added to improve the signal to noise ratio.
Spectral manipulation such as baseline correction/adjustment and smoothing were performed using the Spectracalc software package GRAMS (Galactic Industries Corporation, NH, USA). Band component analysis was undertaken using the Jandel ‘Peakfit’ soft-ware package that enabled the type of fitting function to be se-lected and allows specific parameters to be fixed or varied accordingly. Band fitting was done using a Lorentzian–Gaussian cross-product function with the minimum number of component bands used for the fitting process. The Gaussian–Lorentzian ratio was maintained at values greater than 0.7 and fitting was under-taken until reproducible results were obtained with squared
corre-lations ofr2greater than 0.995.
Results and discussion
Chemical characterization
The SEM image of chalcosiderite sample studied in this work is
shown in Fig. 1. The image shows a fragment of a spherical
aggregate. Qualitative chemical analysis shows a homogeneous
composition, with predominance of P, Al, Ca, Fe and Cu. Minor
amounts of S were also observed. The spectrum is shown inFig. 2.
Factor group analysis
The factor group analysis for turquoise and related minerals is
given in Tables 1 and 2. In the structure of turquoise there are
two non-equivalent phosphate, two non-equivalent water units and four non-equivalent OH units. Thus there are two distinct sets of water and phosphate vibrations. The lattice vibrations are
repre-sented asC= 57Au+ 57Ag. There are 36 internal phosphate
vibra-tions and 12 internal water vibravibra-tions which make a total of 162
crystal vibrations, i.e. [CuAl6(PO4)4 (OH)84H2O] N= 55 thus
3n3 = 355–3 = 162 vibrations. For each hydroxyl there is one
Raman active and one infrared active vibration. Thus four bands should be observed in both the Raman and infrared spectra in the OH stretching region.
Spectroscopy
The spectra of chalcosiderite [CuFe6(PO4)4(OH)84H2O] depend
on the subunits in the structure, namely the phosphate units, the water units and the hydroxyl units. Each of these units will show
vibrational bands in both the Raman and infrared spectra. Some overlap of bands of the water and OH units may occur. One most beneficial way of studying phosphate minerals is to undertake vibrational spectroscopy. In this way, the symmetry and distortion of the phosphate units in the mineral structure can be ascertained. Further, if there are different sometimes called non-equivalent phosphate units, then vibrational spectroscopy can determine if the phosphate units are identical or different. The Raman spectrum
of chalcosiderite over the 100–4000 cm1spectral region is
dis-played inFig. 3a. This figure shows the position and relative
inten-sity of the Raman bands. It is obvious that the less intense spectral
region is over the 2600–4000 cm1region. This region is where the
water and OH stretching vibrations are likely to be observed. The overall spectrum may be subdivided into sections depending upon the type of vibration being studied. The infrared spectrum over the
500–4000 cm1spectral range is shown inFig. 3b. As for the
Ra-man spectrum there are spectral regions where no intensity is ob-served and therefore the spectrum may be subdivided into sections depending upon the type of vibration.
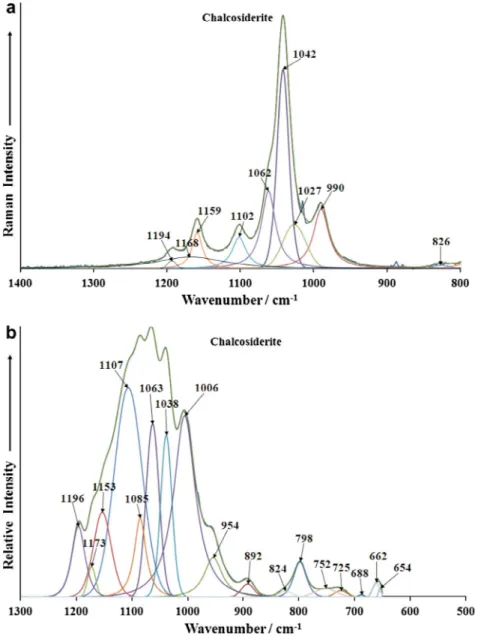
The Raman spectrum in the 800–1400 cm1spectral range is
displayed inFig. 4a. This spectral region is the region of the
phos-phate stretching bands. The infrared spectrum shown inFig. 4b,
shows a complex spectral profile with overlapping bands. In the
structure of chalcosiderite there are two distinct phosphate units. This means that there should be two separate phosphate stretching
vibrations. An intense Raman band is observed at 1042 cm1with a
strong shoulder at 1062 cm1. These bands are assigned to the
PO3
4
m
1symmetric stretching vibrations. Factor group analysispre-dicts there should six Raman and six infrared bands, three from each of the two independent phosphate units. Three Raman bands
are found at 1102, 1159 and 1194 cm1. These bands are assigned
to the PO3
4
m
3antisymmetric stretching vibrations. A comparisonmay be made with the mineral turquoise CuAl6(PO4)4(OH)84H2O
which is isomorphous with chalcosiderite. The Raman spectrum of turquoise typically shows two symmetric stretching modes at
1066 and 1042 cm1. The replacement of Al (turquoise) by Fe
(chalcosiderite) in the structure causes a shift to lower wavenum-bers. A band is observed in the Raman spectrum at around
990 cm1. The assignment of this band is open to question. There
are two possibilities (a) a hydrogen phosphate symmetric stretch-ing mode and (b) a hydroxyl deformation mode. In the light of the previous assignment of the higher wavenumber bands the latter assignment is preferred.
The infrared spectrum (Fig. 4b) shows two bands at 1006 and
1038 cm1 which may be assigned to the PO3
4
m
1 symmetricstretching vibrations. The observation of two symmetric stretching modes offers support to the concept of two independent phosphate units in the chalcosiderite structure. The resolved infrared
compo-nents at 1063, 1107, 1153 and 1196 cm1 are attributed to the
PO3
4
m
3antisymmetric stretching vibration al modes. Acompari-son is made with the infrared spectrum of turquoise where three
bands are observed at 1182, 1161 and 1104 cm1. Factor group
analysis predicts there should be six infrared active modes. Six bands are not observed and this is attributed to accidental degen-eracy. The two sets of Raman and infrared bands from the two independent phosphate units overlap. The infrared band at
954 cm1may be attributed to a hydroxyl deformation mode.
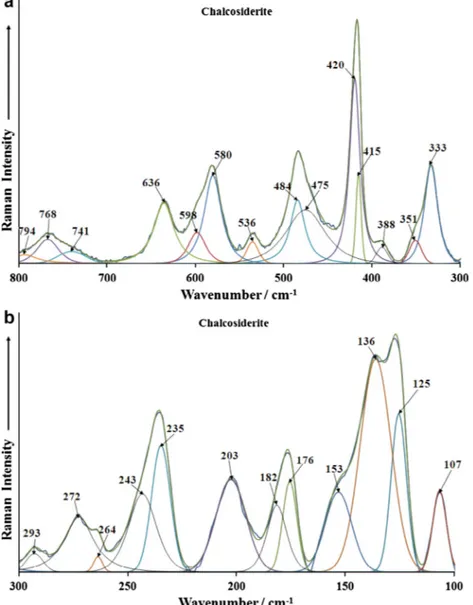
The Raman spectra of chalcosiderite in the 300–800 cm1and
100–300 cm1spectral range are reported inFig. 5a and b. The first
spectral region is the region where the phosphate bending modes are observed. The spectrum may be divided into subsections. The
spectral region between 700 and 800 cm1are assigned to water
librational modes. According to the factor group analysis there
should be two sets of water bands. This is confirmed by the exper-iment in that two water librational modes are observed. In the
spectral range from 500 to 700 cm1region, four Raman bands
are observed at 536, 580, 598 and 636 cm1. These four bands
are assigned to the
m
4bending modes. The results of FGA show thatat least two bending modes would be found and this is confirmed by the observation of four bending modes in the Raman spectrum. Raman bands for turquoise are observed at 550, 570, 593 and
643 cm1. The number of bands in this spectral region confirms
the existence of two non-equivalent phosphate units and the loss of degeneracy of the bending modes.
The next spectral region is from around 500 to 400 cm1where
the phosphate
m
2bending modes are expected. Raman bands forchalcosiderite are found at 415, 420, 475 and 484 cm1. In
compar-ison, the Raman bands for turquoise Raman bands were found at
419, 439, 468 and 484 cm1. The bands for chalcosiderite (the Fe
rich compound) appear at lower wavenumbers than the Aluminium rich mineral turquoise. Raman bands for chalcosiderite are observed
at 333, 351 and 388 cm1. These bands are assigned to CuO
stretch-ing bands. Intense Raman bands are observed in the region centred
upon 330 cm1for turquoise. Multiple bands are also observed for
turquoise. Bands in this spectral region are assigned to CuO and me-tal–oxygen stretching vibrations. Raman bands in the 100–
300 cm1spectral range are simply defined as lattice vibrations.
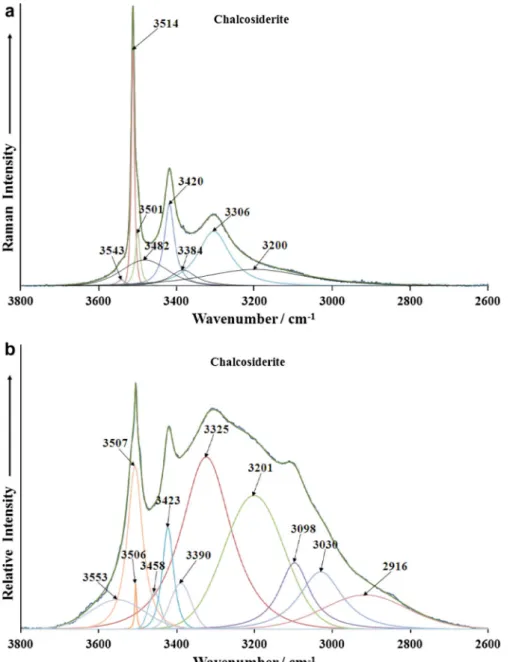
The Raman spectrum of chalcosiderite in the OH stretching
re-gion are reported inFig. 6a. One of the difficulties that may be
pre-dicted is the potential overlap between the OH stretching vibrations of the OH units and the water units. The Raman spectra
between 3800 and 2600 cm1may be subdivided into two spectral
regions (a) 3400–2600 cm1 and (b) 3800–3400 cm1. The first
spectral region is where the water OH stretching bands are ob-served and the second region is where the OH stretching bands of the hydroxyl units. FGA predicts two independent water units and four OH units. The vibrational modes are both Raman and infrared active. Thus it is predicted that there should be a four OH symmetric stretching vibrations from the OH units and two from the water units. A very intense band is observed at
3514 cm1with a shoulder band on the lower wavenumber side
together with a small low intensity band at 3543 cm1. There is
also a broad band at 3482 cm1. These bands are attributed to
the OH stretching vibrations of the OH units. Two strong Raman
bands are found at 3306 and 3420 cm1and are assigned to the
water stretching modes. For turquoise, Raman bands attributed
to water stretching vibrations are found at 3276 and 3072 cm1.
The infrared spectrum of chalcosiderite in the 2600–3800 cm1
spectral range is displayed inFig. 6b. The spectrum displays
com-plexity with significant band overlap. The assignment of the bands is difficult because of this band overlap. Infrared bands are noted at
3458, 3506, 3507 and 3553 cm1. These bands are ascribed to the
OH stretching vibrations. It is likely the OH vibrations in the same band position because of accidental degeneracy. Broad infrared
bands observed at 3030, 3098, 3201, 3325 and 3390 cm1are
as-cribed to water stretching vibrations.
Studies have shown a strong correlation between OH stretching
fre-quencies and both O O bond distances and H O hydrogen bond
dis-tances[19–22]. Libowitzky showed that a regression function can be
employed relating the hydroxyl stretching frequencies with regression
coefficients better than 0.96 using infrared spectroscopy [23]. The
function is described as:
m
1=ð3592304Þ 1090d:ð1321O—OÞcm1. ThusOH–O hydrogen bond distances may be calculated using the
Lib-owitzky empirical function. The values of 3306 and 3420 cm1give
hydrogen bond distances of 2.745and 2.812Å. The estimated hydrogen
bond distances are difficult to obtain from X-ray diffraction. Values can be obtained from neutron diffraction studies but such studies of
minerals are rare. Hydrogen positions may be inferred from difference plots in XRD studies. Calculations using the Raman bands at 3501, 3514
and 3543 cm1 give hydrogen bond distances of 2.89
6, 2.917 and
2.978Å. The hydrogen bond distances involving the OH units are longer
than those involving the water units.
Conclusions
A chalcosiderite mineral from Siglo XX mine, Bolivia were ana-lysed by Raman and infrared spectroscopy. The sample composi-tion was analysed by electron probe and the exact formula determined. The vibrational spectra were related to the structure of the mineral. A comparison between the spectra of chalcosiderite and turquoise was made. The mineral chalocsiderite has two inde-pendent phosphate units in the unit cell. This results in increased complexity in the spectra resulting in doubling of many of the characteristic phosphate bands.
Vibrational spectroscopy enabled an assessment of the molecu-lar structure of the mineral chalcosiderite.
Acknowledgments
The financial and infra-structure support of the Discipline of Nanotechnology and Molecular Science, Science and Engineering Faculty of the Queensland University of Technology, is gratefully acknowledged. The Australian Research Council (ARC) is thanked for funding the instrumentation. The authors would like to acknowledge the Center of Microscopy at the Universidade Federal
de Minas Gerais (http://www.microscopia.ufmg.br) for providing
the equipment and technical support for experiments involving electron microscopy. R. Scholz thanks to FAPEMIG – Fundação de Amparo à Pesquisa do Estado de Minas Gerais, (Grant No. CRA – APQ-03998-10).
Appendix A. Supplementary material
Supplementary data associated with this article can be found, in
the online version, athttp://dx.doi.org/10.1016/j.saa.2013.02.023.
References
[1] A. Mandarino, Fleischer’s glossary of mineral species, mineralogical record, Tuscon, Arizona, USA, 1999.
[2]E.R. Zalinski, Econ. Geol. 2 (1907) 464–492.
[3]W.T. Schaller, J. Washington Acad. Sci. 1 (1911) 58–59.
[4] F.W. Clarke, The data of geochemistry, third ed., vol. 616, US Geological Survey Bulletin, 1916, p. 821.
[5]H. Steinmetz, Zeit. Krist. Min. 55 (1916) 376–377. [6]A.M. Hewitt, Chem. Eng. Min. Rev. 11 (1919) 103–106. [7]F.K. Mayer, Chem. Erde 9 (1935) 311–317.
[8]D. McConnell, Am. J. Sci. 240 (1942) 649–657.
[9]A.R. Graham, University of Toronto Studies, Geological Series 52 (1948) 39–53. [10]H. Cid-Dresdner, Am. Min. 50 (1965) 227–231.
[11]R.S.W. Braithwaite, Min. Rec. 12 (1981) 349–353.
[12]G.R. Hunt, J.W. Salisbury, C.J. Lenhoff, Mod. Geol. 3 (1972) 121–132. [13]X.-Y. Yang, Y.-F. Zheng, X.-M. Yang, X. Liu, K. Wang, Neues Jahr. Min. (2003)
97–112.
[14]R.L. Frost, W. Martens, P.A. Williams, J.T. Kloprogge, Min. Mag. 66 (2002) 1063– 1073.
[15]R.L. Frost, W.N. Martens, T. Kloprogge, P.A. Williams, Neues Jahr. Min. (2002) 481–496.
[16]R.L. Frost, P.A. Williams, W. Martens, J.T. Kloprogge, P. Leverett, J. Raman Spectrosc. 33 (2002) 260–263.
[17]V.C. Farmer, Mineralogical Society Monograph 4: The Infrared Spectra of Minerals, The Mineralogical Society, London, 1974.
[18]J. Hyrsl, A. Petrov, Min. Rec. 37 (2006) 117–120.
[19]J. Emsley, Very strong hydrogen bonding, Chem. Soc. Rev. 9 (1980) 91–124. [20]H. Lutz, Struct. Bonding 82 (1995) 85–103.