Article
J. Braz. Chem. Soc., Vol. 27, No. 1, 15-29, 2016. Printed in Brazil - ©2016 Sociedade Brasileira de Química 0103 - 5053 $6.00+0.00
A
*e-mail: [email protected]
Equilibrium and Out-Of-Equilibrium Investigation of Proton Exchange and Cu
IIand Zn
IIComplexation on Fungal Mycelium (
Trametes hirsuta
)
Vicente R. Almeida,*,a,b Bruno Szpoganicz,a Lei Chou,b Kitty Baert,c Annick Hubinc and
Steeve Bonnevilleb
aDepartamento de Química, Universidade Federal de Santa Catarina,
88040-900 Florianópolis-SC, Brazil
bBiogéochimie et Modélisation du Système Terre, Département des Sciences de la Terre et de
l’Environnement, Université Libre de Bruxelles, Brussels, Belgium
cDepartment of Electrochemical and Surface Engineering,
Vrije Universiteit Brussel, Brussels, Belgium
This work presents potentiometric investigations of [mycelium/metal ion/water] complex systems and the development of anew model investigating the ion-mycelium-fluid interactions. Since pH is a major parameter in soil ecology exhibiting large fluctuations, we proposed an improved equilibrium and also out-of-equilibrium potentiometric titration method in order to characterize the proton exchange behavior of the [mycelium/metal ion/water] system. Our model describes the dynamic relations and interactions within the soil complex subsystems consisting of fungal mycelium of Trametes hirsuta, water with or without metal ions (CuII and ZnII). Equilibrium
modeling based on potentiometric titrations can be well described using four mycelium related components which are active in the pH range studied. In addition, our equilibrium calculations show clear differences with respect to metal-mycelium interactions: CuII interacts with acidic and basic
deprotonable sites, while ZnII binds with neutral and basic deprotonable sites. Potentiometric
out-of-equilibrium (i.e., perturbed pH) characterization suggests that important fungal heterogeneous complexity may act as definite proton pressure entities under continuously perturbed soil conditions. Raman micro-spectroscopy was also used to characterize the [mycelium/metal ion/water] complex systems. Our results demonstrate that potentiometry is a useful tool (intermediate technology) in studying biological complex matrices, facing pH perturbations, as well as their interactions with metal ions.
Keywords: potentiometry, out-of-equilibrium thermodynamics, mycelium/metal ion complexes, intermediate technology
Introduction
The complexity of natural systems, such as the biosphere, calls for the creation of new paths for research
and knowledge development.1,2 In the past century, the
development of systems theory provided a broad basis for
the “ecology of practices” in Earth and human sciences.3-6
Here, we propose specific practice of model development relevant to biogeochemistry but also in a broader sense to transdisciplinary investigations. In order to do it, we will explore a physical-chemical model description of a specific complex soil subsystem -[mycelium/metal ion/water]- and
associated ubiquitous phenomena involving the proton exchange and metal interactions.
A complex system is an ensemble that cannot be reduced to a fundamental description and, due to the large number of components and relations, is impossible
to be exhaustively characterized.3 Being considered as
a complex system composed of rock-forming minerals, interstitial water, gases, micro- and macro-organisms and decaying organic matter etc., soils have been proposed to share characteristics that conceptually overlap with those
of life.7-9 A system can be considered alive when it is able
presence of vast mycelial networks in the system.10-13 The
branch-like mycelium communities crucially contribute to plant water and nutrient uptake, organic matter decay and mineral transformation, all of which participate in the soil formation processes in geological timescales. As such, fungal networks are essential to maintain the terrestrial biosphere in out-of-equilibrium evolving/changing
states.8,10-16
The somatic macro-structure of fungi (i.e., hypha) is composed of tubular cells. The hyphal cell wall is made of structural fibrillar polymers (mainly chitin, chitosan or glucans) that provide rigidity and matrix sub-systems (mannoproteins, glucans and uronic acids) that cross-link the fibrillar components and coat the structural polymers. An important characteristic of fungi is that they also excrete organic acids, protons, oligopeptides, carbohydrates, enzymes, etc., into their near-environment that (i) degrade organic matter, (ii) favour nutrients release from minerals, (iii) interact with soil microbiota and (iv) co-react to
environmental changes.9-11,15,16 Some other chemical
characteristics will be presented below in the discussion section. The first important remark is the extensive heterogeneity in the make-over and organization of fungal mycelium. This heterogeneity becomes striking if we take in account the symbiotic ability with plants, algae or cyanobacteria of hyphal networks in very diverse natural
settings.8,12,13,15-17
One of the remarkable characteristics of fungal activity is its relations with metal ions. Increasing literature describes the capacity of fungi to bind, transport, precipitate and transform metal ions (toxic or bio-essential, depending on the local concentrations and the type of metals) in natural and artificial environments (e.g., chemical reactors and remediation or waste water treatments). The most important proposed interaction pathways between metal ions and fungal systems are based on (i) the active exudation of soluble substances (organic acids, phosphates, siderophores, oligopeptides, etc.) with complexing and/or redox properties and (ii) the passive complexation of metals in the constituents of the most heterogeneous structures of fungal mycelium such as cell membrane and related
structures, mostly chitin and glyco-proteins.10-12,15,18
Several techniques are used to investigate fungi/metal ion interactions which include spectroscopic methods (e.g., synchrotron techniques, such as extended X-ray absorption fine structure) and electrochemical techniques
(potentiometry and voltametry) among others.10,11,14,15,18-21
In a recent review on biosorption and related research,
Michalak et al.22 remarked that “pH is one of the key
factors that influences not only dissociation of sites, solution chemistry of metal ions, hydrolysis, complexation
by organic and/or inorganic ligands, redox reactions, precipitation, but also strongly influences the speciation and the biosorption affinity of metal ions”. Even though potentiometry has been classically used to study physical chemical properties of a wide range of complex living organisms, we propose here to push forward its application by combining systemic conceptions and new data interpretation methods. Indeed, we couple classical potentiometric titration with out-of-equilibrium pH responses to gain insights into the behavior of fungal system as a function of pH and, in the present work, its
interactions with ZnII and CuII.
Experimental
Complex system model
The procedure began with the cultivation of the ubiquitous basidiomycete fungi species Trametes hirsuta, a dead wood degrader (Figure 1). In the laboratory, small pieces of the fungi fruiting body were placed in sterilized Petri-dishes containing agar-gel (3% in fresh water) growth media. After one week of growth, the mycelium was transferred to 250 mL erlenmeyer flasks containing 100 mL of a sterilized liquid cultivation media: potato
extract (filtered solution of cooked potato, 200 g L-1) and
brown sugar (4%, m/v). After two weeks of growth period at room temperature, aliquots of liquid growth medium were examined with a fluorescent and optical microscope to ensure for the purity of our fungal culture. Fungal mycelia were stained using wheat germ agglutinin (WGA, Aldrich)
which has a high specificity for chitin.23 No bacteria were
detected and a strong fluorescent signal was detected on each hypha observed (Figure 1). The mycelium was then collected; the growth media was thoroughly washed with reverse osmosis water and dried at 35 °C for 72 h. The
Figure 1. Confocal fluorescence microscopy of cultivated mycelium (coloration method is described in Bonfante-Fasolo et al.)23 and
dehydrated mycelium was then gently ground in an agate mortar and stored in a sterilized Petri-dish placed in a desiccator (the mycelium biomass was shown to be viable for at least 3 months). The resulting mycelium biomass was then submitted to potentiometric titration perturbation and spectroscopic investigations as described below.
Potentiometric titrations
Before titration, the potentiometric system (using Metrohm combined glass electrode) was calibrated
by titrating 40 mL of a standard 0.01016 mol L-1 HCl
(ionic strength 0.1 mol L-1 KCl) solution with a standard
0.1151 mol L-1 CO
2-free NaOH solution in a 100 mL
potentiometric cell, maintained at 25 °C with a circulating
water bath, flushed with water-saturated N2 gas (N2 was
bubbled twice in a 0.05 mol L-1 NaOH solution) and
stirred vigorously with a magnetic stirring bar. The results from calibration titrations were compared with theoretical
values (calculated for 40 mL of 0.01016 mol L-1 HCl
titrated by 0.1151 mol L-1 NaOH) using Best7 software and
presented a small error (σfit < 0.03) and an accurate slope
(–59.1 mV pH unit-1).24,25
The potentiometric titrations of the mycelium of Trametes hirsuta were performed as follows. A fraction of 108 mg of mycelium was placed in the potentiometric cell with 40.0 mL of degassed ultra-pure water (Milli-Q)
containing 0.1 mol L-1 KCl. The system was left to stabilize
during 1 h under constant N2 flow at 25 °C and continuous
stirring. After stabilization at pH 6.7, the system was
acidified to pH 3 with 0.8 mL of 0.1019 mol L-1 HCl.
The potentiometric titration began from pH 3 to pH 10 by
sequential addition of 0.05 mL aliquot of 0.1151 mol L-1
CO2-free NaOH using a precision (0.01 mL) manual burette
(Gilmont 2 mL). After each base titrant addition, the pH stabilization kinetics was monitored from the aliquot addition initial time to a maximum of 24 min. The pH stabilization kinetic measurements at each point of the titration were used to further characterize the slow-proton exchange processes discussed below.
Similar procedures were repeated in the presence of
dissolved CuII or ZnII as follows. A fraction of 108 mg of
mycelium biomass was left to stabilize during 30 min in 24 mL of water containing 0.298 g of KCl (with a final
concentration of 0.1 mol L-1 in a total initial volume of
40.8 mL). After the initial stabilization period, 4 mL of
1001 mg L-1 standard solution of CuII or ZnII (Merck, in
0.5 mol L-1 HNO
3) was added and immediately followed
by the addition of 12.8 mL of 0.1151 mol L-1 CO
2-free
NaOH (initial metal ion concentration of ca. 1.5 mmol L-1
in 40.8 mL). Then the very same sequential titration and
kinetic out-of-equilibrium monitoring procedure were
performed. Blank titrations with CuII or ZnII were also
conducted under the same conditions and no significant out-of-equilibrium evolution was observed (pH stabilization occurs in less than 1 min for most of the studied pH ranges).
Inductively coupled plasma optical emission spectrometry (ICP-OES) was also performed using a Varian Liberty instrument in order to measure the concentration
of CuII and ZnII in solution/suspension phase. For each pH
unit from 2 to 10, a 1.05 mL suspension aliquot was filtered from [metal ion/water] and [mycelium/metal ion/water] systems through a 0.2 µm cellulose acetate membrane, and
diluted 20 times with 0.5 mol L-1 HNO
3 for further analysis.
Raman scattering
Raman confocal micro-spectroscopy was performed using a LabRAM HR Evolution-Horiba Scientific instrument operating a 532 nm green laser and using a long working distance objective 50X in order to collect Raman spectra of the fungi in suspensions with and without metal ions ([mycelium/metal ion/water]) collected from potentiometric titration experiments at pH 7 and further analyzed in glass slides.
Complex system modeling
Equilibrium modeling
We propose a potentiometric approach to explore the experimental behavior of the complex soil subsystem model, the fungal mycelium biomass, under perturbed conditions (in terms of pH and also in the presence of metal ions). The definition of the studied complex systems was made by simple components and interactions/relations. The fundamental distinction is made between the complex model system and water, such as for example [mycelium/water]. Since the sensing tool is a combined pH glass-electrode, it is established that the present components: mycelium, metal ions and water, are observable in the potential perturbation and measurement. The first distinction to be done is the ionization of water as:
H2O ⇋ H+ + H2O (1)
and the relation:
[OH–] = β
OH–/[H+] with βOH– = 10–13.78 (2)
That made possible the description of the differences
in terms of [H+].24,25 Coupled to it is the second distinction
H+ + S ⇋ H+S (3a)
K = [H+S]/[S][H+] (3b)
where K is the protonation equilibrium constant of S.
Components are expressed using bold letters and their related species, i.e., conjugate bases and conjugate acids are
not bolded. Hence, for the complex system S, the associated
species are noted “S” and “H+S”. Equations 3a and 3b are
at the core of the out-of-equilibrium characterization (see equations 12-15) and are extended by further distinctions. In the case of [mycelium/water] system the conjugate bases
S and conjugate acids H+S can be defined as:
[S] = Σi[Si] (4a)
[H+S] = Σ
i[H+Si] (4b)
i
S
[S ]i
[S]
x = (5a)
i
H
[H S ]+ i
[H S]+
S
x + = (5b)
where Si and H+Si are, respectively, the ith component
conjugate bases and conjugate acids that compose the
complex system S, and xSi and xH+Si are their respective
mole fractions. In the study of [mycelium/water] complex
system, four components i (A, B, C and D) give us the best
fits to the experimental titration curves (see Equilibrium chemical modeling sub-section in Results and Discussion). The four components have the same property structure for
instance, for component A:
H+ + A ⇋ H+A (6a)
with:
H A+
[H A]+
β
[A][H ]+
= (6b)
and similarly for components B, C and D, where
βH+A > βH+B > βH+C > βH+D,meaning strongest acidity for
conjugate acid H+A and weakest for H+D species.
We can then define the characteristics of the complex
model in the presence of metal ions, CuII or ZnII, or simply
metal ions M. As M is an acid, it is expected to consume base titrant as:
M ⇋ M(H+)
–1 + H+ (7a)
M(H+)
–1⇋ M(H+)–2 + H+ (7b)
M(H )+ 1
[H ][M(H ) ]+ +−1
β
[M]
= and M(H )+
2
[H ] [M(H ) ]+2 +−2
β
[M]
= (7c)
where the β values are the conditional overall stability
constants for the proton exchange of M. In the same way, the acid M can also interact with the mycelium components.
If we represent the four conjugate bases A, B, C and D of
the four mycelium components as generic ligands “L”, we can propose the following possible reactions:
M + L ⇋ ML with
ML
[ML]
β
[M][L]
= (8a)
ML + H+⇋ MH+L with
MH L+
[MH L]+
β
[H ][M][L]+
= (8b)
ML ⇋ M(H+)
–1L + H+ with
M(H+) L
1
[H ][M(H ) L]+ +−1
β
[M][L]
= (8c)
M(H+)
–1L ⇋ M(H+)–2L + H+ with
M(H ) L+
2
[H ] [M(H ) L]+2 +−2
β
[M][L]
= (8d)
The set of equations 8a to 8d define that the components of the mycelium are able to form the complex ML,
the protonated complex MH+L and the deprotonated
complexes M(H+)
-1L and M(H+)-2L. In summary, the model
proposition give rise to the following 26 possible species for
[mycelium/CuII/water] or [mycelium/ZnII/water] complex
systems: A, B, C, D, H+A, H+B, H+C, H+D, M(H+)
-1,
M(H+)
-2, MA, MB, MC, MD, MH+A, MH+B, MH+C,
MH+D, M(H+)
-1A, M(H+)-1B, M(H+)-1C, M(H+)-1D,
M(H+)
-2A, M(H+)-2B, M(H+)-2C, M(H+)-2D, beyond H+.
Using Best7 software,25 these 26 species and their
relevant associated reactions (presented by the adequate quotients in Table 2 and equations 1, 2, 6, 7 and 8) were used to fit the experimental titration curves of the simple blank
systems [water], [CuII/water] and [ZnII/water] and those of the
complex systems [mycelium/water], [mycelium/CuII/water],
[mycelium/ZnII/water]. Brackets emphasize the studied
systems as whole complexes and the term “water” may be omitted during the text, when convenient.
The Best7 software sequentially solves the following equation:
ij
e i ij j
j
T e β r
r
(where Ti is the total concentration of the ith component
in mol L-1, [R
r] is the concentration of all reactant r that
compose species j, and eij is the stoichiometric coefficient
of each reactant r in the corresponding equilibrium equation for all components i and their related species j, at each point of the titration) in order to minimize the difference between
measured and calculated pH at each point of the titration.25
In the case of [mycelium/CuII/water] system, for example,
the components present are A, B, C, D, CuII and H+ and
the related equilibrium are described in equations 1, 2, 6,
7, 8and Table 2. In the discussion section, we will explore
the coherence of the equilibrium modeling and show why it can be considered as a powerful investigation tool for the study of complex systems as suggested by Martell and
co-workers24 and as also suggested herein.
Out-of-equilibrium characterization
Besides the equilibrium modeling, we have also explored out-of-equilibrium processes related to pH perturbation caused by the successive titrant additions. In other words, after each base addition, we monitored the perturbed pH response over time. When the titrant is added the majority of exchangeable protons are rapidly consumed (in the present case around 90% of total exchangeable protons are consumed in the first 30 s) but kinetically measurable residual proton exchange still occurs even 1 h
after the titrant addition.14,26 Similar behavior was observed
for humic acids and also for biotite.27,28 For biotite, the
slow proton exchange reactions can reach quantitative proportions of total exchangeable protons; and in the case of humic substances, data are scarce in the literature but indicate that significant slow processes can take place
in proton exchange phenomena.27,28 These slow-proton
exchange processes provide us with special information about the studied system, notably in the present case, the way the biological heterogeneous complex system qualitatively responds to the titration perturbations. In what follows, we present the derivation of out-of-equilibrium physical-chemical model parameters.
Usually, when slow-proton exchange processes are observed in potentiometric titrations, the pH stabilization curves take the shape of an exponential decay approaching a pseudo-equilibrium pH, the final pH of each titration
point.14,29 After the fast proton exchange reactions (that are
faster than the technical possibility of kinetic measurement using traditional potentiometric apparatus), we begin to measure the slow-proton exchange reactions. It should be noted that these slow-proton exchange processes are specific of complex systems, such as biological samples, bio-mimetical complexes, humic substances, minerals,
soil samples, etc.,14,24,26,30-34 while not observable in simple
systems, i.e., highly soluble low molecular weight organic acids (e.g., phthalic acid).
The differences of proton concentration between the
initial kinetic pH and final pH measurement (pHfinal), as
presented in Figure 2a, were used to derive a first order slow-proton exchange as described below. Firstly, we obtained out-of-equilibrium slow-exchangeable proton
amount, [H+
ex](t– final), at each time t of pH response as:
[H+
ex](t – final) = –([H+]t – [H+]final) + ([OH–]t – [OH–]final) (10)
where:
[OH–] = β
OH–[H+]–1
Equation 10 is the calculation step in which we use the kinetic pH measurement (the values of pH at each time t) to
obtain the proton concentration at time t, [H+]
t, and derive
the slow-exchangeable proton concentration [H+
ex](t-final),
which is the difference in proton concentration between
Figure 2. Example of (a) out-of-equilibrium pH stabilization measurement from pHfinal of the previous titration point to pHfinal of actual titration point
(passing through (i) fast and (ii) slow proton exchange) and (b) first order kinetic plot for the [mycelium/CuII/water] system at pH
final 7.27
(plot construction and derivation of [H+
ex]t0 and k are detailed in
time t and the time when the last pH measurement is taken,
or [H+]
final (pHfinal in Figure 2).
Fitting the curve [H+
ex](t– final) versus time with the
following first-order rate law,
[H+
ex](t– final)(t) = [H+ex]t0e–kt (11)
gives the initial slow-proton exchange concentration,
[H+
ex]t0 (which is a calculated concentration of exchangeable
protons at t = 0),and the first-order rate constant, k,
specific of each slow pH response after titrant addition (see Figure 2).
Using [H+
ex]t0, the first order rate constant k and the
parameters of equilibrium calculations (described in the previous section), component concentrations and conditional
overall stability constants β, we can calculate (i) the
equilibrium condition K, (ii) the out-of-equilibrium condition Q (at time t0) and (iii) the entropy production dS/dt related to the irreversible slow-proton exchange that was kinetically observed at each point of the titration. The equilibrium condition (index “eq”) is determined by K (equation 3) using (i) the concentration of all conjugate bases and conjugated acids present in the system (calculated using the program
Aqueous Solutions)35 (ii) their respective molar fractions
(equations 4 and 5) and (iii) the proton concentration,
[H+]
final, at pHfinal. Conversely, the out-of-equilibrium
condition (index “t0”) is described by Q that is defined as:
[H S]+
t0
Q
[H ] [S]+t0 t0
= (12)
where:
[H+S]
t0 = [H+S]eq + [H+ex]t0 (13a)
[S]t0 = [S]eq – [H+ex]t0 (13b)
and:
2 OH
c c 4β
[H ]+
t0 2
−
+ +
= with
βOH c [H ]+ex t0 [H ]+final
[H ]+final −
= − + −
(14)
Equation 14 is the solution of a second order polynomial
equation (i.e., –([H+]
t0)2 + ([H+]t0)c + βOH– = 0) that is
obtained by the substitution of the difference [H+
ex](t – final) by
the difference [H+
ex]t0 in equation 10 at t = t0. Then we can
define [H+]
t0 as the modeled proton concentration (10–pHt0)
of the perturbed state t0.
Then, the last step is the calculation of entropy production dS/dt as:
(
)
(
[
ex]
t0)
K
dS/dt A dξ/ dt /
Q
+
= = −
∑
(15)Equation 15 defines that the slow-proton exchange entropy production is proportional to affinity A, RT ln
(K/Q),times the reaction rate dξ/dt, –k[H+
ex]t0 as described
by Kondepudi and Prigogine,29 where R is the constant of
gases 8.314 J mol-1 K-1. For volume of 1 L, dS/dt is given
in J K-1 s-1. These values were calculated for the kinetic
dataset of all points of the potentiometric titrations and are presented below.
Results and Discussion
Raman microspectroscopy and emission spectrometry
Raman scattering measurements well demonstrate the complexity of the mycelium system. Tentative signal
attributions (according to literature)36-39 are listed in
Table 1. Figure 3a illustrates that fungal biochemical structure is not strongly affected by the presence of
high metal concentrations (c.a. 1.5 mmol L-1) since the
spectral pattern remains, in general, similar to the one observed in the absence of metals. However, a closer inspection of minor signals in Figure 3b indicates subtle shifts/changes in the scattering profile of the mycelium
in the presence of CuII and ZnII which may be related to
specific interactions of metals with carboxylic, amino and phosphate groups at least, as proposed in our potentiometric investigations (see next section). We can speculate over
some specific spectral changes in the presence of CuII
and/or ZnII at: (i) 900-1000 cm-1, where we can observe
a general hypsochromic shift for [mycelium/ZnII] system
in comparison to [mycelium] system, possibly related to metal-phosphate and/or metal-protein interactions;
(ii) 1120 cm-1, where a different spectral shape is observed
for [mycelium/CuII] system, possibly related to
metal-protein interactions; (iii) 1370 cm-1, where a more intense
peak is observed for [mycelium/ZnII], possibly related to
metal-nucleic acid (phosphate backbone) interactions and;
(iv) 1625 cm-1 (left shoulder of major peak at 1654 cm-1),
where significant differences are observed between [mycelium] and [mycelium/metal ion] spectra, mostly for
CuII, probably related to metal interactions with complex
organization of protein-chitin-nucleic structures in the mycelium (see arrows in Figure 3b, see also Table 1). In addition, since the metal ions were obtained from a diluted nitric acid solution, it is possible to observe the presence of
nitrate (N–O stretch) at 1050 cm-1 for the [mycelium/metal
be interpreted with great caution. Even so, Raman micro-spectroscopy can be considered as a powerful spectroscopic method for biogeochemical complex investigations, as observed in Figure 3.
Inductively coupled plasma optical emission spectrometry was also used as a complement to the main fungal/metal ion interactions potentiometric study. In Figure 4, it is observed that fungal complexing agents (proteins, oligopeptides, organic acids, phosphates, etc.) are probably, to a significant extent, free in solution. In the
case of [mycelium/CuII/water] system, we can observe that
more than 50% of total CuII is in suspension (as aqueous
complexes with dissolved biomolecules or bound to < 0.2 µm fungal particles) even above pH 6 where without
the presence of mycelium CuII precipitates quantitatively.
A similar effect is observed for [mycelium/ZnII/water].
However, to a lesser extent and with some differences: at neutral pH, a lower concentration of soluble or suspended
particle bound ZnII is observed in comparison with
[ZnII/water] blank experiment. This behavior suggests
that, at neutral pH, ZnII is complexed by fungal structures
> 0.2 mm (ca. 10 to 20% of total ZnII at pH 7.7, Figure 4).
In the following section, we propose that the quantitative
formation of M(H+)
-2 insoluble precipitated systems
(observed without the presence of mycelium) are replaced
or substituted by M(H+)
-1L (where L are mycelium-related
ligands) complex systems, mostly at neutral pH.
Equilibrium chemical modeling
The use of the above presented theoretical system (modeling section) enables the investigation of the pH buffering capacity as an ecological relevant property. The perturbation patterns may have partial, but direct, relation with the behavior of this type of system, mycelium complex systems, in nature. From the curve of the [mycelium/water] system shown in Figure 5, we can observe that the major
part of the buffering capacity (total of 1.34 mmol g-1 of
mycelium, in accordance with literature for fungi)14,19,20
is related to components D (39%, pKa 9.34) and A (28%,
pKa 3.24). Components B (17%, pKa 4.61) and C (16%,
pKa 7.02) represent the smaller part of the buffering
capacity of the [mycelium/water] system. In recent work on
dead fungi biomass of Trametes villosa the same pKa values
(A, B, C and D) presented above were reported but with a
smaller total buffering capacity of 0.75 mmol g-1.14 Other
Figure 3. In (a) [mycelium] and [mycelium/metal ion] Raman spectra. In (b) composite figure of [mycelium] and [mycelium/metal ion] enlarged spectra. [mycelium], [mycelium/CuII] and [mycelium/ZnII] are represented in black, gray and light gray lines, respectively.
Table 1. Tentative attribution of major and minor Raman scattering peaks (see Figure 3) for [mycelium] and [mycelium/metal ion] complex systems, based on the relevant literature36-39
Major peaks Wavenumber / cm-1
Nucleic acids and carbohydrates (C–O–C skeletal modes) 916
Proteins (C–N stretch) 1083
Guanine/cytosine, chitin and proteins (N–H bending) 1259
Chitin and proteins (N–H bending) 1265
Lipids (C–H wagging/twisting) 1300
Lipids, proteins and carbohydrates (CH2 and CH3 asymmetric deformation) 1440
Proteins (amide, C=O stretch) 1654
Lipids (ester, C=O stretch) 1740
Minor peaks Wavenumber / cm-1
Glycerol (C–O–C bending) 607
Proteins (C–C twisting) 621
Tyrosine (C–C twisting) 643
Nucleic acids (C–C ring breathing modes and C−S stretch) 666-680
Amino acid methionine (C–S stretch) 700
Nucleic acids 720
Protein (C–S stretch, CH2 rocking) and adenine (CH2 rocking) 726
Phosphatidylserine and thiocyanate (C–S stretch) 733 and 737
Nucleic acids (thymin ring breathing mode) 747
Proteins (tryptophane ring breathing and bending modes) 756-760
Nucleic acids (phosphodiester O−P−O stretch and ring breathing modes in DNA) 777-789
Phosphate groups (O–P–O stretch and phosphate ion interations) 798
Nucleic phosphodiesters and proline, hydroxyproline, tyrosine and phosphate in nucleic acids (O−P−O stretch and C−C stretch) 808 and 815
DNA, tyrosine (C–C out-of-plane ring breathing, phosphate stretch in DNA) 815-828
Amine deformation 837
Saccharides (C–O–C skeletal modes) 845
Proline and tyrosine (C–C ring breathing modes) 853
Protein and polisaccharides (C–C stretch in amino acid side chain of proline, hydroxyproline and collagen backbone) 857
RNA (C–C stretch, skeletal and ring breathing modes) 867
Saccharides and proteins (C−O−C tryptophane and carbohydrate ring modes and CH2 bending modes in proteins) 877-884 Protein (C–C stretch), saccharides (C−O−C skeletal modes) and nucleic acids (C−O−C ribose vibration and P−O stretch) 884-897
RNA (C–O–C skeletal modes of ribose) 916
Carbohydrates (C−C skeletal modes) 931
Polysaccharides (C−C skeletal modes) 941
α-Helix protein (CH3 symmetrical stretch) 951
Phosphate (P–O stretch) and proteins modes (unassigned) 960-965
C–C wagging 971
Protein β-sheet (C–C stretch) and lipids (=C–H bending) 980
Ribose (C–O stretch) and carbohydrates (C–C stretch) 994
Chitin (C–C ring breathing) and phenylalanine (aromatic C–C stretch) 1003
Solid carbohydrate (C–O stretch) 1015
Protein, phenylalanine and carbohydrates (C–C stretch, C–H bending and C–N stretch) 1030
Phosphate symmetrical stretch 1044
Glycogen (C–C stretch) 1049
Chitin and proteins (C–C and C–N stretches) 1052
Proline, collagen (skeletal C–C stretch) 1066
Phospholipids, nucleic phosphodiester, carbohydrates and proteins (C–C and C–O stretches and O–P–O symmetric stretch) 1074-1115
Carbohydrates and proteins (C–C, C–N and C–O stretches) 1123-1140
Proteins (C–C and C–N stretches) 1158
Protein/amino acids (C–H bending) 1174
DNA nitrogenous bases (C–N stretch) and phosphates (anti-symmetric modes) 1184-1197
works on different fungal species present total buffering
capacity values that vary from 0.81 to 3.87 mmol g-1.19,20
For different bacteria species, Claessens et al.40 presented
total buffering capacity values varying from 0.14 to
1.77 mmol g-1. The higher total buffering capacity
values are found for humic acids which vary from 4.0 to
13.0 mmol g-1.28,41 For the biotite mineral we found a value
of 0.94 mmol g-1.27 For soils the values vary from 0.1 to
0.5 mmol g-1 depending on the type of soil and horizon.31-33
This quantitative information may represent, in general terms, the contribution of soil subsystems to soils buffering capacity and note the importance of fungi and humic substances to soil stability.
In our present model, the components (A, B, C and
D) and their respective deprotonation constants suggest
the presence of a complex biological matrix composed by the usual fungal biopolymers and biomolecules such as carbohydrates, proteins, nucleic acids and (in)organic salts as observed in the Raman scattering measurements (Figure 3 and Table 1). All conditional stability constant values are listed in Table 2 and represented in Figure 6.
From the curve of [CuII/water] and [ZnII/water] we found
that the major proton exchange contribution is due to the formation of the bis-deprotonated metal ion species,
M(H+)
-2 presumably related to precipitates in accordance
to ICP-OES measurements (Figure 4). From the titration
curves of [mycelium/CuII/water] and [mycelium/ZnII/water]
(Figure 5), we observed new patterns that does not resembles the summation of separated (mycelium and metal ions alone) systems. This indicates substantial interactions between the metal ions and mycelium system. In Table 2
are listed the βML constants of associated mycelium-metal
interactions calculated using Best7 software.
Indeed, we have found that, in the case of the mycelium system in the presence of metal ions, fit is not obtained with metal complex formation constants (ML formation,
equation 8a for βML and Table 2) smaller than 104 which
can be considered as relatively strong binding constants.20,24
In the case of [mycelium/CuII/water] interactions, we
observe an intense complexation distributed between
components A, B and D with βML formation constants
around 106 (Table 2). For the [mycelium/ZnII/water] system,
the formation constants are smaller, around 105, but an
important contribution is attributed to metal complexation
Minor peaks Wavenumber / cm-1
Phosphate, lipid, amide, amino acids, nucleic, amine, carbohydrate and chitin complex (C–C and C–N stretches, CH2 rocking and wagging, =C–H bending, O–P–O anti-symmetric modes, N–H bending and amide III in α-helix and β-sheet protein structures)
1207-1280
Ergosterol (CH2 twisting) 1286
Lipids, nitrogenous bases and carbohydrates (C–H bending, CH2 twisting and wagging, CH3 twisting) 1290-1306
Lipids (CH3CH2 twisting) 1313
Proteins (C–H deformation, amide III of α-helix) 1321
Phospholipids (C−H deformation) 1328
Protein, DNA, lipids, ergosterol and carbohydrates (C−H deformations, wagging and twisting) 1333-1354
Tryptophane (C−H deformations) 1357 and 1365
Saccharides, DNA and lipids (C–H deformation and ring breathing modes) 1370-1385
Lipids, amino acid chains and DNA/RNA (CH2 rocking, C−N stretch, C=O symmetric stretch, N–H in plane deformation) 1387-1400
COO- symmetric stretch and C=C stretch 1411 and 1417
Proteins, lipids, DNA/RNA and carbohydrates (C−H, CH2 and CH3 deformation, scissoring, bending and stretching and N–H in plane deformation)
1420-1463
Nitrogenous bases ring breathing and -NH3+ modes 1485
Nucleic acid, amino acids and carotenoids (C=C stretching, N–H bending) 1499-1516
Carotenoid (in plane vibrations of C=C and –C=C– conjugates) 1524-1528
Amide, amino acids, tryptophane and tyrosine (C=C stretch, amide III, N–H deformation and amide II) 1540-1563
Nucleic acids modes (ring breathing C–C stretch) 1570-1580
Phenylalanine and olefin (C=C stretching and bending) 1584
Hydroxyproline and phenylalanine (N–H bending and C=C stretch) 1589
C=N and C=C stretches 1593
Complex organization of protein, α-helix, β-sheets, DNA, lipids, chitin and carbohydrates (C=O stretch, C=C deformation and stretching, N–H bending, ring breathing modes, stacking interactions and hydrogen bond-sensitive organization in peptides)
1600-1800
Glutamic and aspartic acids, amino acids, ester groups in lipids (COO- stretch) 1700-1740
Phospholipids, polysaccharides and pectin (C=O stretch) 1745
with component C. Based on our results (calculated
concentration and pKa values for species of A, B, C, D
and related complex stability constants with CuII and ZnII
presented in Table 2), it is difficult to precisely identify the groups involved in the metal complexation, either at the cell wall or in the liquid phase. But one point should be remarked: the presence of carboxylic acids, phosphates and amino groups are considered important in the complexing reactions of the [mycelium/metal ion/water] systems.
Combinations between carboxylic acids (and activated organic acids) that present strong acidity are possible
candidates for the general component A.24 Ionic molecules,
oligopeptides and proton releasing systems (e.g., proton
ATPase) can also participate as component A and contribute
to the acidic buffering capacity of fungi.10,15 Component
B is consistent with reported values of carboxylic acids.
Component D can represent amine groups in the mycelium
complex systems. Component C can be an average
representation of more complex subsystems such as enzyme sites, mixed-chemical-group binding sites and also phosphate
neutral deprotonation related processes.24,42 As already stated,
the four proposed components are in good accordance with the possible chemical components tentatively assigned in the Raman scattering investigation (Figure 3 and Table 1). Although there is relatively good correspondence between our stability constant values for protonation reactions and
the ones for known functional groups (i.e., COOH, −NH2
or HPO42-, etc.), the representation of the [mycelium/water]
system, by four components A, B, C and D, should be
interpreted as heterogeneous complex distribution, most
probably between soluble organic compounds excreted actively or not by the fungi and the heterogeneous cell wall surface binding sites.
Despite the presence of a large diversity of possible metals-mycelium interactions, we found a clear difference
between the behavior of [mycelium/CuII/water] and
Figure 5. Potentiometric titration curves for [mycelium/metal ion/water] combination systems. Experimental data are presented in light grey lines (CuII, ZnII, water, [mycelium/CuII] and [mycelium/ZnII]) while calculated values are presented in gray (CuII, ZnII and water) and black ([mycelium/ CuII] and [mycelium/ZnII]) lines (calculated average error function σfit < 0.04).25 Water (standard 0.01016 mol L-1 HCl titration) curve was presented in order to provide qualitative comparison with the studied complex systems.
[mycelium/ZnII/water] systems. In the presence of metal
ions, the fungi components may occupy at least one metal
coordination position (species ML, MH+L and M(H+)
-1L)
while the formation of bis-deprotonated complex species
(M(H+)
-2L) is not significant. In contrast, in single metal,
[metal ion/water] system, titrations, bis-deprotonated
species (M(H+)
-2) are formed quantitatively, as observed
in Figure 4. Figure 6 shows the species diagram of the calculated models for the [mycelium/water] and [mycelium/
metal ion/water] studied systems. CuII tends to interact
predominantly with carboxylic acids (A, B) and amine
groups (D) while ZnII interacts mostly with amine groups
(D) and with other combination of deprotonable groups,
mixed sites and/or phosphate groups, represented in our
model by the component C (see Figure 6).
The stability constants in Table 2 indicate stronger
binding of CuII to the mycelium of Trametes hirsuta
compared to ZnII as previously observed for other fungi,
and bacteria.18,20,21,39 Using potentiometric titration methods,
Sanna et al.20 presented metal ion-binding constants (CuII
and ZnII) in the range of 105 for living Trichoderma viride
fungal biomass, and values around 107 for CuII-chitin
system.20 In studies of metal biosorption on Penicillium
chrysogenun fungal biomass, Niu et al.18 found bigger
binding affinity for CuII than for ZnII. In the case of the
bacteria Shewanella putrefaciens, Claessens et al.39
found CuII and ZnII binding constants of 107.3 and 105.4,
respectively, as also observed herein (Table 2). Using
several different Petri-dish microcosm experiments
regarding CuII and ZnII interactions with fungi (qualitatively
investigated through syncrotron techniques), Fomina et al.21
emphasize that fungal-metal complexation processes, of
both CuII and ZnII, are dominated by the action of carboxylic
and phosphate (organic and inorganic) chemical groups related to fungal structure/organization. These authors also suggest that metal complexation by amine groups in fungal systems may be important in the metal biotransformation which may be followed by other phenomena such as metal ion immobilization in cell wall or precipitation as metal
phosphates, oxalates, carbonates or oxides.21 In a recent
study on mosses, González and Pokrovsky43 showed that
the biosorption of CuII (ca. 90%) is more effective than
the biosorption of ZnII (ca. 75%) and that for both metal
ions the adsorption is completed in less than 10 min, but more complex absorption processes may occur after this initial period. Hence, it is coherent to expect that all these processes may take longer time periods, as discussed in the following out-of-equilibrium section.
The results of our equilibrium investigations are also
coherent with the low toxicity of ZnII towards fungi,
suggesting that neutral pH deprotonable groups, related
to component C, may play a significant role in key
pH-dependent biological processes (such as the absorption
of the bio-essential ZnII) in the studied fungi.11,24,42
It is interesting to remark that four weeks after our potentiometric experiments, fungal growth was observed
Table 2. Conditional stability constants (equations 6, 7 and 8) calculated using Best7 software.25 Species diagrams are presented in Figure 6
Quotient log Quotient Quotient log Quotient
[H+A]/[H+][A] 3.24 [Cu(H+)–1][H+]/[Cu] –6.54
[H+B]/[H+][B] 4.61 [Cu(H+)–2][H+]/[Cu(H+)–1] –4.51
[H+C]/[H+][C] 7.02 [Zn(H+)–1][H+]/[Zn] –7.39
[H+D]/[H+][D] 9.34 [Zn(H+)–2][H+]/[Zn(H+)–1] –7.13
[CuA]/[Cu][A] 7.40 [ZnA]/[Zn][A] 3.39
[CuH+A]/[CuA][H+] 3.11 [ZnH+A]/[ZnA][H+] 0.95
[Cu(H+)–1A][H+]/[CuA] –4.60 – –
[Cu(H+)–2A][H+]/[Cu(H+)–1A] –10.82 – –
[CuB]/[Cu][B] 6.19 [ZnB]/[Zn][B] 4.53
[CuH+B]/[CuB][H+] 3.76 [ZnH+B]/[ZnB][H+] 2.49
[Cu(H+)–1B][H+]/[CuB] –5.75 – –
[CuC]/[Cu][C] 5.13 [ZnC]/[Zn][C] 6.59
[CuH+C]/[CuC][H+] 6.51 [ZnH+C]/[ZnC][H+] 5.44
[Cu(H+)–1C][H+]/[CuC] –7.22 [Zn(OH)C][H+]/[ZnC] –7.19
[CuD]/[Cu][D] 7.67 [ZnD]/[Zn][D] 5.63
[CuH+D]/[CuD][H+] 5.58 [ZnH+D]/[ZnD][H+] 8.06
in the stored [mycelium/ZnII] basic pH suspensions,
which was not the case for the relatively more toxic CuII
in [mycelium/CuII] stored suspension. Lastly, we reinforce
that CuII seems to be controlled by large amounts of acid
complexing agents (average components A and B) and
basic groups (component D) such as amines, while neutral
pH deprotonable groups (component C) remain almost
unaffected (see Figure 6). The present results are unique and the details suggest that modeling can be used, at least, as qualitative reference in the literature for describing living fungi macroscopic physical-chemical properties.
Out-of-equilibrium investigation
In the modeling section, we demonstrated how to derive the slow-proton exchange entropy production of the [mycelium/water] and [mycelium/metal ion/water] systems in relation to titrant perturbation during potentiometric titrations. Out-of-equilibrium states can be defined by their stability as a function of time. While (in linear out-of-equilibrium thermodynamics) stable systems maintain slow out-of-equilibrium processes, unstable systems, upon perturbations, evolve quickly to a new pseudo-equilibrium state. Since change is driven by difference (negentropy or energy input), we use entropy production as a fundamental parameter to investigate the stability of the complex [biological/metal ion] studied
systems. As pointed by Prigogine and co-workers,2,29
out-of-equilibrium properties, such as entropy production of complex systems (relevant, in a transdisciplinary point
of view, for agroecology)1,7,8 are special characteristics
related to evolution and stability of the same complex systems under perturbed conditions. It is important to note that here we are dealing with linear out-of-equilibrium thermodynamics and that several complex conditions in
nature are often observed as non-linear phenomena.1,2,11,16,29
Even though, we can expect that linear out-of-equilibrium thermodynamic information (which are also important in ecological/nature processes and homeostasis) may be useful in order to obtain some abstract representation of the evolution properties of the fungal/metal ion systems.
During the out-of-equilibrium measurements, from acidic to basic pH the slow rate constants k decreases while
the slow-proton exchange concentration [H+
ex]t0 increases
(Figures 7 and 8). This observed patterns in the perturbed states of the [mycelium/water] and [mycelium/metal ion/ water] complex systems (Figures 7 and 8) suggest that subsystems of higher heterogeneity (e.g. mostly proteins and chitin complexes) exerts an increasing slow proton pressure/buffering capacity as pH becomes more basic. Under acidic pH conditions, slow-proton exchange
reactions are faster than at basic pH (Figures 7a). With the presence of metal ions, the slow-proton exchange becomes measurable at lower pH (i.e., starting at pH 4) while, in the absence of metal ions, it is only measurable above pH 4.6 (see inset Figure 7b), as a result of general Lewis acid properties of metal ions. Figure 8 suggests that
amine groups (i.e., component D), or basic pH deprotonable
groups, in different organized structures (mainly protein and chitin complexes) are important slow-proton exchangers at basic pH. Under acidic pH conditions, there is also some significant slow proton exchange, however to a much lesser extent. At neutral pH, the slow proton exchange is not as high (in moles) as in the basic pH region but we remark that, since pH is a logarithmic value, the observed slow processes in the neutral pH region (which are not negligible, see Figure 2) may indicate important complex interactions that regulate biological processes (it is to say that slow stabilization curves are also significant at neutral pH as observed in Figure 2).
Figure 7. (a) Slow-proton exchange first order rate constant k and (b) slow-proton exchange concentration [H+ex]
t0 for the studied [mycelium/
metal ion/water] complex systems. The [mycelium], [mycelium/ZnII] and [mycelium/CuII] complex systems are represented by black, gray and light gray lines. Positive [H+ex]
t0 values indicate irreversible proton flux
from the [mycelium/meta ion] subsystem to the aqueous phase. Negative [H+
ex]t0 values indicate the opposite, water-to-[mycelium/meta ion], proton
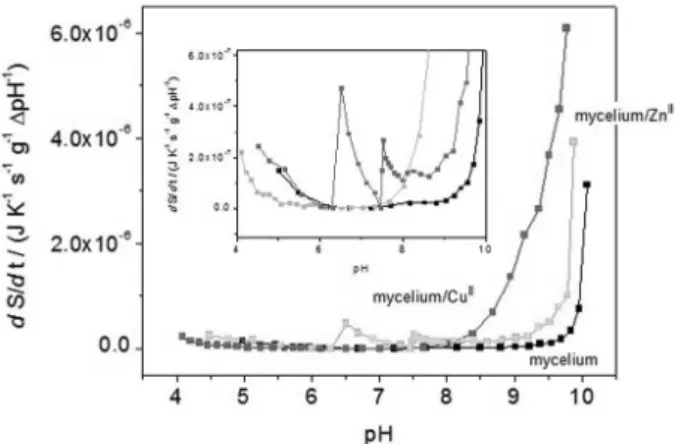
In the presence of metal ions, the shape of the slow-proton entropy production curve (Figure 8) is generally the same (i.e., increasing entropy production as pH
becomes basic). However, we can observe that CuII, in
the [mycelium/CuII/water] system, promotes an intense
enhancement of slow-proton exchange processes at a lower pH (above pH 7, Figure 8), which is much more significant
in comparison to the [mycelium/ZnII/water] system and
even further in comparison to [mycelium/water] system. We
believe that this pattern reflect the stronger affinity of CuII
(compared to ZnII) for important complex heterogeneous
basic pH deprotonable sites (dominated by amine groups in proteins and also chitin, Figures 7b and 8), at least in the time scale studied here.
It is interesting to note that in the case of the [mycelium/
ZnII/water] system at neutral pH, the measurable slow pH
stabilization curves evolve in the acidic-to-basic sense (see
small-magnitude negative values of [H+
ex]t0 in the inset of
Figure 7b between pH 6 and 8 for the [mycelium/ZnII/
water] system), which is in opposition to basic-to-acid out-of-equilibrium slow evolution of the majority of the pH considered here (as shown in Figure 2). This
acidic-to-basic evolution of the [mycelium/ZnII/water] system at
neutral pH is also accompanied by much larger k values (Figure 7a). This suggests that a larger contribution of fast (usually non-monitorable) proton exchange may become observable as slow-proton exchange processes. This unusual inversion pattern was also observed for out-of-equilibrium response at discrete basic pH conditions for
humic acids and biotite.27,28
With the present study we can state that when mycelium is perturbed with base, it counter-reacts through active and/ or passive proton releasing reactions (acids of different
strength and structure at different levels of organization, in membrane proteins, oligopeptides, etc.). The hyphal cell-wall and associated biomolecules (plus the released dissolved organic acids) form a complex three dimensional structure/organization that can present different level of accessibility to the perturbed water environment. Due to possible difference in diffusion coefficient, as shown by
Kazakov et al.,26 the protons bound to dissolved organic
acids, phosphates, oligopeptides, siderophores, etc. may be consumed first whereas the protons bound to protein cavities or inner cell organelles are expected to be consumed last, if
consumed. We remark, as also pointed by Fomina et al.21,
that experimental studies (even being extremely informative) of all complex systems should be interpreted as partial models which may present differences both between the model experiments in parallel and in relation to natural conditions, i.e., in terms of metal ion sources (minerals or soluble, concentration etc.), fungal species, experimental/investigation time periods and temperature conditions, etc.
In terms of natural implication, we can hypothesize that the slow proton exchanges from mycelium may be dominant over fast proton exchange in natural soils due to a much more limited amount of free water compared to our potentiometric water-suspension experiments. These slow processes may also be more significant under colder conditions. Hence, we suggest that some similarity to the interaction patterns presented in Figures 6, 7 and 8 can be partially expected to occur in natural soils, provided significant fungal biomasses are present.
Finally, our results indicate that fungal systems can counter-balance (to a certain extent) soil basification. In contrast, other studies demonstrate that biotite, a phyllosilicate mineral, tends to prevent acidification while humic substances favor neutral pH stable
conditions.14,27,28,30,34 In this regard, further investigations
will provide the different characteristics (in relation to proton exchange and other important parameters such as redox properties) of the miscellaneous components and sub-components of complex ecological and soil systems under out-of-equilibrium conditions. We propose that the method presented herein can be considered as an interesting tool for the characterization of soils and their stability upon physical-chemical perturbations.
Conclusions
The potentiometric method presented in this study can serve as a useful tool for the investigation of different samples from natural complex systems, such as soils and soil subsystems. Using [mycelium/metal ion/water]
Figure 8. Slow-proton exchange entropy production (dS/dt) for out-of-equilibrium processes during titration for the [mycelium/metal ion/ water] complex systems. [mycelium], [mycelium/ZnII] and [mycelium/
CuII] complex systems are represented by black, gray and light gray lines
respectively. Entropy production values are normalized with respect to pH variation between sequential titration points (∆pH-1) and mycelium
complex model systems, selective interactions between fungi and metal ions are found to be coherent with the general [biological/inorganic ions] interaction properties. In summary the mycelium of Trametes hirsuta may interact
with CuII mainly through acids, weak-acids and weak
bases while neutral pH deprotonable species remain rather
unaffected. In the case of ZnII, mycelium neutral pH and
weak-basic deprotonable species appear to be important metal complexing agents.
Furthermore, out-of-equilibrium slow-proton exchange investigation is proposed to reveal interaction patterns that may be related to the heterogeneous protein and chitin complexes characteristic of fungal mycelium. Complementary Raman spectroscopy and inductively coupled plasma optical emission spectrometry data presented good agreements with modeling and interpretation of potentiometric studies. Lastly, we emphasize the relevance of the present work for agroecology in an
ecological/transdisciplinary perspective.1,5-7,9
Acknowledgments
We thank the Brazilian National Council of Technological and Scientific Development (CNPq), the Federal University of Santa Catarina (UFSC), the Université Libre de Bruxelles (ULB), and the Vrije Universiteit Brussel (VUB) for financial support and infrastructure. Steeve Bonneville benefits from the support of the fund “Victor Brien” and from the fund “Van Buuren”. Nathalie Roevros (ULB) is thanked for the help in the laboratory and for ICP-OES measurements.
References
1. Naveh, Z.; Landscape Urban Plan. 2001, 57, 269.
2. Prigogine, I.; Stengers, I.; Order Out of Chaos, 1st ed.; Bantam Books: London, 1984.
3. von Bertalanffy, L.; Teoria Geral dos Sistemas, 2a ed.; Vozes: Brasília, 1975.
4. Stengers, I.; Penser avec Whitehead, 1st ed.; Seuil: Paris, 2002. 5. Morin, E.; Ciência com Consciencia, 8a ed.; Bertrand Brasil:
Rio de Janeiro, 2005.
6. Bateson, G.; Steps to an Ecology of Mind, 1st ed.; Jason Aranson: London, 1987.
7. Altieri, M.; Agroecologia, 2a ed.; FASE: Rio de Janeiro, 1989. 8. Whitfield, J.; Nature2007, 449, 136.
9. Primavesi, A.; Manejo Ecológico do Solo, 11a ed.; Nobel: São Paulo, 2002.
10. Gadd, G. M.; Mycologist2004, 18, 60.
11. Gow, N. A. R.; Robson G. D.; Gadd, G. M.; The Fungal Colony, 1st ed.; C.U. Press: New York, 1999.
12. Bonneville, S.; Morgan, D. J.; Schmalenberger, A.; Bray, A.; Brown, A.; Banwart, S. A.; Benning, L. G.; Geochim. Cosmochim. Acta2011, 75, 6988.
13. Simard, S. W.; Beiler, K. J.; Bingham, M. A.; Deslippe, J. R.; Philip, L. J.; Teste, F. P.; Fungal Biol. Rev.2012, 26, 39. 14. de Almeida, V. R.; Szpoganicz, B.; Open J. Phys. Chem.2013,
3, 189.
15. Carlile, M. J.; Watkinson, S. C.; The Fungi, Academic Press: London, 1994.
16. Harris, J.; Science2009, 325, 573.
17. Ferrera-Cerato, R.; Pérez-Moreno, J. In Soil Ecology in Sustainable Agricultural Systems; Brussaard, L.;
Ferrera-Cerato, R., eds.; CRC/Lewis Publishers: Mexico, 1997, ch. 5. 18. Niu, H.; Xu, X. S.; Wang, J. H.; Volesky, B.; Biotech. Bioeng.
1993, 42, 785.
19. Naja, G.; Mustin, C.; Volesky, B.; Berthelin, J.; Water Research
2005, 39, 579.
20. Sanna, G.; Alberti, G.; Castaldi, P.; Melis, P.; Fresenius Environ. Bull.2002, 11, 636.
21. Fomina, M.; Charnock, J.; Bowen, A. D.; Gadd, G. M.; Environ. Microbiol.2007, 9, 308.
22. Michalak, I.; Katarzyna, C.; Witek-Krowiak, A.; Appl. Biochem. Biotechnol.2013, 170, 1389.
23. Bonfante-Fasolo, P.; Faccio, A.; Perotto, S.; Schubert, A.; Mycol. Res.1990, 94, 157.
24. Martell, A. E.; Motekaitis, R. J.; Determination and Use of Stability Constants, VHC Publishers: Dallas, 1992.
25. Motekaitis, R. J.; Martell, A. E.; Can. J. Chem.1982, 60, 2403. 26. Kazakov, S.; Bonvouloir, E.; Gazaryan, I.; J. Phys. Chem. B
2008, 112, 2233.
27. de Almeida, V. R.; Szpoganicz, B.; Bonneville, S.; J. Braz. Chem. Soc. 2015, 26, 1848.
28. de Almeida, V. R.; Szpoganicz, B.; Chem. Biol. Tech. Agric.
2015, 2, 17.
29. Kondepudi, D.; Prigogine, I.; Modern Thermodynamics; J. Wiley: Chichester, 1998.
30. Stumm, W.; Chemistry of the Solid-Water Interface; J. Wiley: New York, 1992.
31. Ivanova, S. E.; Solokova, T. A.; Moscow Univ. Soil Sci. Bull.
1998, 53, 12.
32. Süsser, P.; Schwertmann, U.; Geoderma1991, 49, 63. 33. Nätscher, L.; Schwertmann, U.; Geoderma1991, 48, 93. 34. Pertusatti, J.; Prado, A. G. S.; J. Colloid Interf. Sci. 2007, 314,
484.
35. Pettit, L. D.; Aqueous Solutions; Academic Software, York, UK, 1993.
36. Ghosal, S.; Macher, J. M.; Ahmed, K.; Environ. Sci. Technol.
2012, 46, 6088.
37. Wagner, C. C.; Baran, E. J.; Spectrochim. Acta A2009, 72, 936. 38. Suffren, Y.; Rollet, F. G.; Reber, C.; Comments Inorg. Chem.
39. Movasaghi, Z.; Rehman, S.; Rehman, I. U.; Appl. Spectroscopy Rev.2007, 42, 493.
40. Claessens, J.; van Cappellen, P.; Environ. Sci. Technol.2007,
41, 909.
41. Baidoo, E.; Ephraim, J. H.; Darko, G.; Geoderma2014, 217-218, 18.
42. Kaim, W.; Schwederski, B.; Bioinorganic Chemistry; J. Wiley: Chichester, 1994.
43. González, A. G.; Pokrovsky, O. S.; J. Colloid Interf. Sci. 2013,
415, 169.
Submitted: June 16, 2015
Published online: September 15, 2015
Vol. 27, No. 1, 15-29, 2016
http://dx.doi.org/10.5935/0103-5053.20150236
Pages 18 and 20, the equations 9 and 15
ij
e i ij j
j
T e β r
r
=
∑
∏
(9)(
)
(
[
ex]
t0)
K
dS/dt A dξ/ dt /
Q
+
= = −
∑
(15)will be respectively corrected by
(9)
(15)


![Figure 3. In (a) [mycelium] and [mycelium/metal ion] Raman spectra. In (b) composite figure of [mycelium] and [mycelium/metal ion] enlarged spectra](https://thumb-eu.123doks.com/thumbv2/123dok_br/19000358.463545/7.892.99.435.351.1042/figure-mycelium-mycelium-spectra-composite-mycelium-mycelium-enlarged.webp)
![Table 1. Tentative attribution of major and minor Raman scattering peaks (see Figure 3) for [mycelium] and [mycelium/metal ion] complex systems, based on the relevant literature 36-39](https://thumb-eu.123doks.com/thumbv2/123dok_br/19000358.463545/8.892.73.801.177.1107/tentative-attribution-scattering-figure-mycelium-mycelium-relevant-literature.webp)
![Table 1. Tentative attribution of major and minor Raman scattering peaks (see Figure 3) for [mycelium] and [mycelium/metal ion] complex systems, based on the relevant literature 36-39 (cont.)](https://thumb-eu.123doks.com/thumbv2/123dok_br/19000358.463545/9.892.102.822.155.656/tentative-attribution-scattering-figure-mycelium-mycelium-relevant-literature.webp)
![Figure 5. Potentiometric titration curves for [mycelium/metal ion/water]](https://thumb-eu.123doks.com/thumbv2/123dok_br/19000358.463545/10.892.462.790.117.862/figure-potentiometric-titration-curves-for-mycelium-metal-water.webp)

![Figure 7. (a) Slow-proton exchange first order rate constant k and (b) slow-proton exchange concentration [H + ex ] t0 for the studied [mycelium/](https://thumb-eu.123doks.com/thumbv2/123dok_br/19000358.463545/12.892.458.788.497.975/figure-proton-exchange-constant-exchange-concentration-studied-mycelium.webp)