Article
J. Braz. Chem. Soc., Vol. 27, No. 1, 136-143, 2016. Printed in Brazil - ©2016 Sociedade Brasileira de Química 0103 - 5053 $6.00+0.00
A
*e-mail: [email protected]
#These authors contributed equally to this work.
Detailed
1H and
13C NMR Spectral Data Assignment for Two
Dihydrobenzofuran Neolignans
Talita C. T. Medeiros,a,# Herbert J. Dias,a,# Eliane O. Silva,a Murilo J. Fukui,b
Ana Carolina F. Soares,b Tapas Kar,c Vladimir C. G. Heleno,b Paulo M. Donate,a
Renato L. T. Parreirab and Antônio E. M. Crotti*,a
aDepartamento de Química, Faculdade de Filosofia, Ciências e Letras de Ribeirão Preto, Universidade de São Paulo, 14040-901 Ribeirão Preto-SP, Brazil
bNúcleo de Pesquisas em Ciências Exatas e Tecnológicas, Universidade de Franca, 14404-600 Franca-SP, Brazil
cDepartment of Chemistry and Biochemistry, Utah State University, 84322-0300 Logan-UT, United States
In this work we present a complete proton (1H) and carbon 13 (13C) nuclear magnetic resonance
(NMR) spectral analysis of two synthetic dihydrofuran neolignans (±)-trans-dehydrodicoumarate dimethyl ester and (±)-trans-dehydrodiferulate dimethyl ester. Unequivocal assignments were achieved by 1H NMR, proton decoupled 13C (13C{1H}) NMR spectra, gradient-selected correlation
spectroscopy (gCOSY), J-resolved, gradient-selected heteronuclear multiple quantum coherence (gHMQC), gradient-selected heteronuclear multiple bond coherence (gHMBC) and nuclear Overhauser effect spectroscopy (NOESY) experiments. All hydrogen coupling constants were measured, clarifying all the hydrogen signals multiplicities. Computational methods were also used to simulate the 1H and 13C chemical shifts and showed good agreement with the trans configuration
of the substituents at C7 and C8.
Keywords: neolignans, oxidative coupling, J-resolved, benzofurans
Introduction
Neolignans (NL) are a class of plant-derived natural products which are produced from shikimic acid pathway.1 They differ from related lignans by the way the two C6C3 units are joined by other bonds. According to the International Union of Pure and Applied Chemistry (IUPAC) recommendations, the term lignan refers to structures where the two C6C3 units are β,β’ (8-8’) linked, whereas the term neolignan must be used for compounds that originate from coupling other than 8-8’ coupling.2
Among NL, compounds exhibiting a dihydrobenzofuran moiety as structure feature have attracted special attention because their wide range of biological activities, such as antioxidant,3 antitumor,4 anti-inflammatory,5 antileishmanial,6 trypanocidal,7,8 insecticidal9 and cytotoxic.3
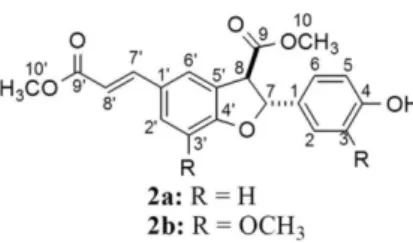
Because of these biological activities, several synthetic methodologies have been proposed to build the basic skeleton of dihydrobenzofuran neolignans (DBNL).10-12 However, the oxidative coupling of phenylpropanoids is so far the most commonly reported synthetic route to obtain DBNL, such as compounds (±)-trans-dehydrodicoumarate dimethyl ester (2a) and (±)-trans-dehydrodiferulate dimethyl ester (2b; Figure 1). Compound 2b is reported to have antileishmanial,13 antiplasmodial,13 cytotoxic,13 antiangiogenic,14 antitumor,15 and antioxidant16 activities. Despite of these biological activities, nuclear magnetic resonance (NMR) data found in literature for both
compounds are generally incomplete and, in some cases, inaccurate.14,15,17,18
Owing to our interest in the detailed NMR study of natural19-21 and synthetic22-25 compounds, in this study we have performed a thorough assignment of all proton (1H) and carbon 13 (13C) NMR data for the synthetic dihydrobenzofuran neolignans 2a and 2b using one- (1D) and two-dimensional (2D) NMR techniques.
Results and Discussion
The (±)-trans-dehydrodicoumaroate dimethyl ester (2a) and (±)-trans-dehydrodiferulate dimethyl ester (2b) were synthesized according to previous reported procedure,15,17,26 which was outlined in Scheme 1. The 1H and 13C NMR data for these compounds were previously published14,15,17,18 but presented some imprecisions that should be corrected.
The main 1H and 13C NMR data for (±)-trans -dehydrodicoumaroate dimethyl ester (2a) and (±)-trans -dehydrodiferulate dimethyl ester (2b) are presented in Tables 1 and 3. Two-dimensional NMR data (selected correlation spectroscopy, gCOSY; gradient-selected heteronuclear multiple quantum coherence,
gHMQC; gradient-selected heteronuclear multiple bond coherence, gHMBC; and nuclear Overhauser effect spectroscopy, NOESY) for the same compounds are given in Tables 2 and 4, respectively. Firstly, the 1H NMR spectra were analyzed in detail, which made it possible to verify all chemical shifts. Further analysis of 1H NMR spectra led to the measurement of most homonuclear hydrogen coupling constants. Some J values were measured only in J-resolved spectrum and all couplings were confirmed by gCOSY experiments. Then, most signals of the proton decoupled 13C (13C{1H}) NMR spectra were assigned through
gHMQC and distortionless enhancement by polarization transfer (DEPT) 135 experiments. The assignment of non-hydrogenated carbons was carried out by the use of gHMBC information and by comparison with calculated spectra.
1H and 13C NMR data previously reported for
compound 2a and 2b were obtained in CDCl3 or acetone-d6. Most of the signals in the 1H NMR spectrum were between
dH 6.0 and dH 8.0, but the hydrogen signal multiplicities are ambiguous. In this work, we found that for compound 2a in acetone-d6, the signals at dH 7.6-7.7 are referred to four hydrogen atoms and their overlapping precluded their correct assignment (Figure 2). Therefore, CDCl3 provided much clearer spectra for 2a, but not for 2b, due to the solvent influence on chemical shifts. For compound 2b, three hydrogen atoms resonate at dH 6.91 in the 1H HMR spectrum in CDCl3. On the other hand, the 1H NMR signals of 2b were resolved by using acetone-d6 as solvent, which allowed verification of the multiplicities, observation of the chemical shifts and measurement of the coupling constants.
The 1H NMR (400 MHz, CDCl
3) of compound 2a (Table 1) showed resonances for one trans disubstituted OCH3
O
R
HO
( )i
O O
OCH3
OH
R R
H3CO
O
2a: R = H
2b: R = OCH3
1a:R = H
1b:R = OCH3
Scheme 1. (i) Ag2O, (CH3)2CO:C6H6 3:5, r.t., 20 h (2a: 36% yield; 2b:
43% yield).
Figure 2. Expansions of the 1H NMR spectrum of compounds 2a and 2b obtained in CDCl
double bond at dH 6.32 (d, 1H, J 15.9 Hz) and dH 7.66 (ddd, 1H, J 0.6, 1.1, 15.9 Hz). The smaller coupling constant values of the signal at dH 7.66 could be measured only in the J-resolved spectrum. Analysis of the 1H-1H COSY spectrum data (Table 2) revealed some long-range couplings (4J): H
7/H2, H7/H6, H7’/H2’, H7’/H6’. From 1H NMR and 1H-1H COSY spectra it was possible to establish the spin systems corresponding to the C3’/C2’/C6’/C8 and C2/C3/C5/C6/C7 portions of 2a.
Assignments of the carbonyl C9 and C9’ and methoxy groups C10 and C10’ are directly performed and those groups can clearly be differentiated on the basis of the gHMBC spectrum (Table 2). The gHMBC correlations are observed between dC at 170.9 and the signals at dH 4.27 (H8), 6.09 (H7), and 3.83 (s, 3H); therefore, the dC at 170.9 is attributed to C9, and dH at 3.83 is assigned to H10. On the other hand, gHMBC correlations between dC at 167.9 and the signals at
dH 7.66 (H7’), 7.55 (H7’) and 3.81 (s, 3H) allowed to assign the
dC 167.9 to C9’, and the dH 3.81 to H10’. In addition, the dc 51.7 and dc 52.9 were assigned to C10’ and C10, respectively, on the basis of the correlations observed in the gHMQC spectrum with dH 3.81 (H10’) and dH 3.83 (H10). Finally, the
non-hydrogenated sp2-hybridized carbons C
1’ (127.8), C4’ (161.2) and C5’ (125.1) were unambiguously assigned to C1’, C4’ and C5’ on the basis of their long-range C−H correlations in the gHMBC spectrum with dH 6.32 (H8’), 7.43 (H2’) and 6.09 (H7), respectively. Similarly, the assignment of C1 and C4 to dC 132.0 and 156.1 was established on the basis of the correlations with dH 7.27 (H2=H6) and 6.84 (H3=H5), respectively. Considering that C4 is expected to be unshielded when compared to C1 due to the inductive effect of the oxygen hydroxyl, this corroborates the assignment.
The 1H NMR (400 MHz, acetone-d
6) data of
compound 2b are shown in Table 3 and their 2D NMR
data are compilated in Table 4.
The structure of compound 2b is related to the natural dimer 3’,4-di-O-methylcedrusin, which is one of the active compounds in dragon’s blood. This blood-red latex, produced by some Croton species growing in the South America, is employed in traditional medicine for wound-healing and anticancer properties.27 Lemière et al.17 have previously reported the synthesis of 3’,4-di-O-methylcedrusin and other related neolignans, including compound 2b, and
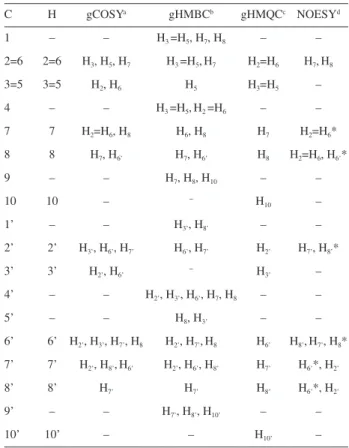
Table 1.1H and 13C NMR data assignments for compound 2a (400 MHz,
CDCl3)
dCa dH (integral, multiplicityb), J / Hz
1 132.0 (C) −
2=6 127.5 (CH) 7.27 (2H, ddd, J2,5 = J6,3 0.3, J2,7 = J6,7 0.6, J2,3 = J6,5 8.3)
3=5 115.7 (CH) 6.84 (2H, dd, J3,6 = J5,2 0.3, J3,2 = J5,6 8.3)
4 156.1 (C) −
7 87.7 (CH) 6.09 (1H, dt, J7,2 = J7,6 0.6, J7,8 7.2)
8 55.1 (CH) 4.27 (1H, dd, J8,6’ 1.4, J8,7 7.2)
9 170.9 (C) −
10 52.9 (CH3) 3.83 (3H, s)
1’ 127.8 (C) −
2’ 130.8 (CH) 7.43 (1H, ddd, J2’,7’ 1.1, J2’,6’ 2.0, J2’,3’ 8.3)
3’ 110.3 (CH) 6.89 (1H, dd, J3’,6’ 0.4, J3’,2’8.3)
4’ 161.2 (C) −
5’ 125.1 (C) −
6’ 124.9 (CH) 7.55 (1H, dddd, J6’,3’ 0.4, J6’,7’ 0.7, J6’,8 1.4, J6’,2’2.0)
7’ 144.7 (CH) 7.66 (1H, ddd, J7’,6’ 0.7, J7’,2’ 1.1, J7’,8’ 15.9)
8’ 115.2 (CH) 6.32 (1H, d, J8’,7’ 15.9)
9’ 167.9 (C) −
10’ 51.7 (CH3) 3.81 (3H, s)
aMultiplicities assigned on the basis of distortionless enhancement
by polarization transfer (DEPT) 135 experiments; bmultiplicities and
coupling constant values measured within 1H NMR and J-resolved spectra
with the help from 1H-1H correlation spectroscopy (COSY) results.
Table 2. 2D NMR data for compound 2a (400 MHz, CDCl3)
C H gCOSYa gHMBCb gHMQCc NOESYd
1 – – H3 =H5, H7, H8 – –
2=6 2=6 H3, H5, H7 H3 =H5,H7 H2=H6 H7,H8
3=5 3=5 H2, H6 H5 H3=H5 –
4 – – H3 =H5,H2 =H6 – –
7 7 H2=H6, H8 H6, H8 H7 H2=H6*
8 8 H7, H6’ H7, H6’ H8 H2=H6, H6’*
9 – – H7, H8, H10 – –
10 10 – − H
10 –
1’ – – H3’, H8’ – –
2’ 2’ H3’, H6’, H7’ H6’, H7’ H2’ H7’, H8’*
3’ 3’ H2’, H6’ − H3’ –
4’ – – H2’, H3’, H6’, H7, H8 – –
5’ – – H8, H3’ – –
6’ 6’ H2’, H3’, H7’, H8 H2’, H7’,H8 H6’ H8’,H7’, H8*
7’ 7’ H2’, H8’,H6’ H2’, H6’, H8’ H7’ H6’*, H2’
8’ 8’ H7’ H7’ H8’ H6’*, H2’
9’ – – H7’, H8’, H10’ – –
10’ 10’ – – H10’ –
aGradient-selected correlation spectroscopy; bgradient-selected
heteronuclear multiple bond coherence; cgradient-selected heteronuclear
multiple quantum coherence; dnuclear Overhauser effect spectroscopy.
assigned the 13C NMR data of these compounds on the basis of DEPT experiments and long-range of heteronuclear correlation (HETCOR) correlations. In this work, we found that the 13C NMR data assignment based on DEPT, gHMQC and gHMBC were similar to that reported by Lemière et al.17 and therefore, will not be discussed in details here. On the other hand, the 1H NMR data of compound 2b available in the literature seems inaccurate. Multiplicities of the signals of the 1H NMR spectrum of 2b are often reported as singlet (H10, H10’, H11 and H11’), doublet (H2, H5, H7, H8, H7’ and H8’), doublet of doublets (H6) or broad singlet (H2’ and H6’) and have not been previously explored. In this work, 1H-1H COSY and 2D J-resolved spectra were used to understand the multiplicity and to measure the coupling constants.
As reported for compound 2a, analysis of the 1H-1H COSY spectrum of 2b (Table 4) revealed a long-range coupling (4J) of H7’ (ddd, 1H, dH 7.63) with H2’ (dH 7.33) and H6’ (dH 7.29). The coupling constant values J7’,6’ and J7’,2’ were measured in the J-resolved spectrum to be 0.8 Hz and 0.4 Hz, respectively.
Similarly, the signal at H2’ (dd, dH 7.33) correlates with
dH 7.29 (H6’, J2’,6’ 2.6 Hz) and dH 7.63 (H7’). A long-range coupling (4J) between H
6’ and H8 was also deduced from the correlations between dH 7.29 (ddd, H6’) and 4.47 (dd, H8’,
J7’,8 1.4 Hz) in the 1H-1H COSY spectrum. It was possible to establish the spin systems corresponding to the C2’/C6’/C7’/C8 and C2/C3/C5/C6/C7 portions of 2b. The long-range coupling (4J) of both H
2 and H6 with H7 has not been previously reported in the literature. In this work, we could measure the scalar coupling constants J2,7 and J6,7 in the J-resolved spectrum as being 0.8 and 0.6 Hz, respectively.
The relative stereochemistry of the substituents at C7 and C8 in (±)-2a and (±)-2b, only the trans-(7R,8R) stereoisomers, are reported in Figure 1 and Scheme 1 was determined on the basis of the J7,8 value and some theoretical calculations, all corroborated by nuclear Overhauser effect (NOE) data (Figure 3).
Firstly, a comparison of J7,8 values for 2a and 2b with J values reported for other dihydrobenzofuran neolignans,28 showed a clear agreement with the trans configuration. It is
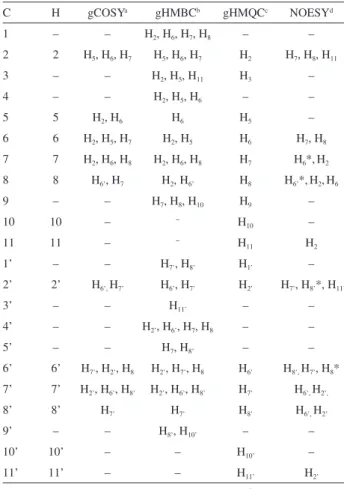
Table 3.1H and 13C NMR data assignments for compound 2b (400 MHz,
acetone-d6)
dCa dH (integral, multiplicityb); J / Hz
1 132.5 (C) –
2 111.2 (CH) 7.10 (1H, ddd, J2,5 0.3, J2,7 0.8, J2,6 2.1)
3 149.1 (C) –
4 148.5 (C) –
5 116.3 (CH) 6.84 (1H, dd, J5,2 0.3, J5,6 8.3)
6 120.7 (CH) 6.92 (1H, ddd, J6,7 0.6, J6,2 2.1, J6,5 8.3)
7 88.8 (CH) 6.04 (1H, ddd, J7,6 0.6, J7,2 0.8, J7,8 7.3)
8 57.0 (CH) 4.47 (1H, dd, J8,6’ 1.4, J8,7 7.3)
9 172.1 (C=O) –
10 53.5 (CH3) 3.81 (3H, s)
11 56.4 (CH3) 3.84 (3H, s)
1’ 129.9 (C) –
2’ 113.9 (CH) 7.33 (1H, dd, J2’,7’ 0.4, J2’6’ 2.6)
3’ 146.3 (C) –
4’ 151.5 (C) –
5’ 127.8 (C) –
6’ 119.5 (CH) 7.29 (1H, ddd, J6’,7’ 0.8, J6’,8 1.4, J6’,2’ 2.6)
7’ 145.9 (CH) 7.63 (1H, ddd, J7’,2’ 0.4, J7’,6’ 0.8, J7’,8’ 15.8)
8’ 116.8 (CH) 6.44 (1H, d, J8’,7’ 15.8)
9’ 168.2 (C) –
10’ 52.1 (CH3) 3.73 (3H, s)
11’ 56.8 (CH3) 3.92 (3H, s)
aMultiplicities assigned on the basis of distortionless enhancement by
polarization transfer (DEPT) 135 experiments; bmultiplicities and coupling
constant values measured within 1H-NMR and J-resolved spectra with the
help from 1H-1H correlation spectroscopy (COSY) results.
Table 4. 2D NMR data for compound 2b (400 MHz, acetone-d6)
C H gCOSYa gHMBCb gHMQCc NOESYd
1 – – H2, H6, H7, H8 – –
2 2 H5, H6, H7 H5, H6, H7 H2 H7, H8, H11
3 – – H2, H5, H11 H3 –
4 – – H2, H5, H6 – –
5 5 H2, H6 H6 H5 –
6 6 H2, H5, H7 H2, H5 H6 H7, H8
7 7 H2, H6, H8 H2, H6, H8 H7 H6*,H2
8 8 H6’, H7 H2, H6’ H8 H6’*,H2,H6
9 – – H7, H8, H10 H9 –
10 10 – − H
10 –
11 11 – − H
11 H2
1’ – – H7’, H8’ H1’ –
2’ 2’ H6’, H7’ H6’, H7’ H2’ H7’, H8’*, H11’
3’ – – H11’ – –
4’ – – H2’, H6’, H7, H8 – –
5’ – – H7, H8’ – –
6’ 6’ H7’, H2’, H8 H2’, H7’, H8 H6’ H8’, H7’, H8*
7’ 7’ H2’, H6’, H8’ H2’, H6’, H8’ H7’ H6’, H2’,
8’ 8’ H7’ H7’ H8’ H6’, H2’
9’ – – H8’, H10’ – –
10’ 10’ – – H10’ –
11’ 11’ – – H11’ H2’
aGradient-selected correlation spectroscopy; bgradient-selected
heteronuclear multiple bond coherence; cgradient-selected heteronuclear
multiple quantum coherence; dnuclear Overhauser effect spectroscopy.
well-established in the literature that the coupling constant
J7,8 in the skeleton of neolignans is higher for cis isomers (8.2-8.4 Hz) than for the trans isomer (6.5-7.3 Hz).28 Nevertheless, it has also been reported that conclusions on the relative stereochemistry in five membered rings based on J values for vicinal hydrogens cannot be so reliable for some compounds, as these hydrogens are susceptible to a great variety of dihedral angles and that cis or trans
H−H coupling constants can be exactly the same.29 On the other hand, Muñoz and Joseph-Nathan30 suggested that different stereoisomers might show rather large differences in their 13C chemical shifts, and that these differences can be used for the structural identification, reassignment and confirmation. Thus, we decided to use theoretical calculations of 1H and 13C chemical shifts as an extra effort to elucidate the relative stereochemistry of 2a and 2b. We hence calculated the 1H and 13C chemical shifts for
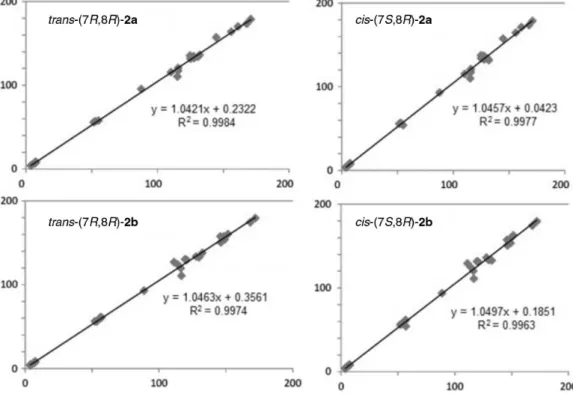
trans-(7R,8R and 7S,8S) and cis-(7S,8R and 7R,8S) stereoisomers of compounds 2a and 2b and plotted these results in a cross-comparison to experimental values obtained for these compounds. In our case, each group of experimental data was compared to the group of
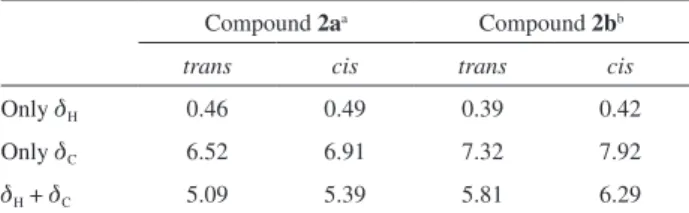
cis and trans calculated data. The database that shows better agreement with experimental data should indicate which isomer we are dealing with. As an evaluation of this comparison, two main values were considered: the root mean square (rms) error and the coefficient of determination (R2), as recently used to clarify conformation and configuration of several structures.31 This first one, the rms error, was obtained by the comparison of chemical shift values atom by atom, both hydrogen and carbon. In this case, rms value was always lower for trans compounds, regardless the comparison made: only 1H chemical shifts (dH), only 13C chemical shifts (dC) or dH plus dC. Table 5 shows the rms values obtained, which clearly indicates
trans configuration for both compounds 2a and 2b. The coefficients of determination were obtained from graphics where 1H and 13C experimental chemical shift values were plotted in one axis and the corresponding calculated values in the other one. Three different graphics were drawn for each structure: one with dH, one with dC and one with both dH and dC. Invariably, the values obtained for
trans structures were closer to the experimental rather than the cis values. Figure 4 shows the example of R2 obtained for compounds 2a and 2b versus1H and 13C chemical shifts
Figure 3. Main nuclear Overhauser effect (NOE) correlations observed in the nuclear Overhauser effect spectroscopy (NOESY) spectra of
compounds 2a and 2b.
Figure 4. Graphics with 1H plus 13C chemical shift (d
H + dC, ppm) experimental values vs. calculated values for trans-(7R,8R) and cis-(7S,8R) diasteroisomers
for the trans-(7R,8R) structure. The R2 values for 2a and 2b trans-(7R,8R) were 0.9984 and 0.9974, respectively; while the R2 value for the diasteroisomers cis-(7S,8R) were 0.9977 and 0.9963, respectively. These data also indicate that the obtained compounds have a trans configuration.
Moreover, H7 exhibited significant NOE correlation with H2 and H6, in the NOESY spectrum (Table 4). However, NOE correlation of H7 with H8 is weak, indicating the relative trans configuration for compounds 2a and 2b. In addition, the trans stereochemistry is also consistent with the diastereoselectivity observed in previously reported syntheses of dihydrobenzofuran neolignans by oxidative coupling, in which the main product is normally a trans
racemic mixture.32 In this work, the formation of a trans racemic mixture for both 2a and 2b was confirmed on the basis of their specific optical rotation values ([α]D25 = 0°).
Conclusions
The complete and unequivocal assignments of 1H and 13C NMR data for two dihydrobenzofuran neolignans are
achieved, leaving no ambiguities. This work included the measurement of all hydrogen homonuclear coupling constants values and all hydrogen signal multiplicities were clarified. Confirmation of the relative stereochemistry was also achieved by density functional theory (DFT) calculations and NOE experiments. This study provides an important 1H and 13C NMR database for these two substances and eliminates all previous ambiguities. The stereochemistry was also confirmed by means of J values comparison. This is the first complete assignment reported for each one of these two compounds.
Experimental
Synthesis of compounds 2a and 2b
Dihydrobenzofuran neolignans 2a and 2b were synthesized as previously reported.15,17,26 Briefly, compounds 2a and 2b were obtained by oxidative coupling of methyl
coumarate (1a) and methyl ferulate (1b) using Ag2O as oxidant. The reactions were carried out employing a mixture of acetone and benzene (5:8, v/v) in a two-necked flask with aluminum foil, equipped with a magnetic stirrer and a gas tube of N2 for 20 h at room temperature. The product was purified by column chromatography (2.2 × 100 cm, silica gel 60, 0.040-0.063 mm) with hexane and ethyl acetate (2:1, v/v) as eluent affording compounds 1 (36% yield) and 2 (43% yield) as mixture of trans-enantiomers. All structures were confirmed by NMR analysis.
NMR analyses
All 1H and 13C NMR experiments were performed on a Bruker Avance DRX400 spectrometer (Karlsruhe, Germany, 400.13 MHz for 1H and 100.61 MHz for 13C). A direct 5-mm probe head (BBO) was used for 13C{1H} NMR experiments and an inverse 5-mm probe head (BBI) was used for other experiments. The 1H NMR spectra were acquired with a solar water heating (SWH) of 8.28 kHz, a time domain (TD) of 64 K, and a number of scans (NS) of 16, which provided a digital resolution of ca. 0.126 Hz (1H 30° pulse width = 8.5 µs). As for the 13C NMR spectra, an SWH of 23.98 kHz was employed, with TD of 32K and NS of 1024, giving a digital resolution of ca. 0.732 Hz (13C 30° pulse width = 14.25 µs). DEPT (512 scans), 1H/1H and 13C/1H 2D chemical shift correlation experiments were carried out using standard pulse sequences supplied by the spectrometer manufacturer. Long-range 13C/1H chemical shift correlations were obtained in experiments with delay values optimized for 2J(C,H) = 8 Hz. Experiments were performed at 300 K and the concentrations for all samples were in the range 10-15 mg mL−1, in CDCl
3 or acetone-d6, using tetramethylsilane (TMS) as internal reference.
Computational methods
Full geometry optimization and vibrational frequency calculations were carried out using the Gaussian09
program package,33 employing the B3LYP hybrid
functional34 and 6-311+G(2d,p) basis set.35 The nature of the stationary point was determined by performing Hessian matrix analysis. 1H and 13C NMR chemical shifts values are calculated within Gauge-Independent Atomic Orbital (GIAO) method,36-38 using the TMS as the reference molecule. The mixed option was included to consider the Fermi contact contribution and improve the accuracy of spin-spin coupling constants.39 All NMR calculations were performed at the mPW1PW91/6-311+G(2d,p) level of theory, following the recommendations from Tantillo and co-workers40-42 for 1H and 13C computed chemical shifts.
Table 5. Root mean square (rms) values from the comparison of
experimental 1H and 13C chemical shifts of compounds 2a and 2b with
those calculated for their cis-(7S,8R) and trans-(7R,8R) diastereoisomers
Compound 2aa Compound 2bb
trans cis trans cis
Only dH 0.46 0.49 0.39 0.42
Only dC 6.52 6.91 7.32 7.92
dH + dC 5.09 5.39 5.81 6.29
aCalculated in CDCl
In addition, the solvent effect in the NMR calculations was taken into account via the self-consistent reaction field (SCRF) approach.43
Supplementary Information
1H NMR, 13C NMR and 2D NMR, IR and mass
spectra of compounds are available free of charge at http://jbcs.sbq.org.br as a PDF file.
Acknowledgements
The authors thank the Fundação de Amparo à Pesquisa do Estado de São Paulo (FAPESP; processes 2013/20094-0, 2009/12202-1 and 2011/07623-8), Conselho Nacional de Desenvolvimento Científico e Tecnológico (CNPq) and Coordenação de Aperfeiçoamento de Pessoal de Nível Superior (CAPES; Science Without Borders Program, process 88881.068346/2014-01) for research fellowship and grants. We are very grateful to Vinicius Palaretti (FFCLRP-USP) for acquisition of the NMR spectra.
References
1. Gottlieb, O. R.; Mem. Inst. Oswaldo Cruz 1991, 86, 25.
2. Moss, G. P.; Pure Appl. Chem. 2000, 72, 1493.
3. Huang, X. X.; Zhou, C. C.; Li, L. Z.; Peng, Y.; Lou, L. L.; Liu, S.; Li, D. M.; Ikejima, T.; Song, S. J.; Fitoterapia 2013, 91, 217.
4. Pieters, L.; Van Dyck, S.; Gao, M.; Bai, R.; Hamel, E.;
Vlietinck, A.; Lemiere, G.; J. Med. Chem. 1999, 42, 5475.
5. Cho, J. Y.; Baik, K. U.; Yoo, E. S.; Yoshikawa, K.; Park, M. H.;
J. Nat. Prod. 2000, 63, 1205
6. Cabral, M. M. O.; Barbosa-Filho, J. M.; Maia, G. L. A.; Chaves, M. C. O.; Braga, M. V.; de Souza, W.; Soares, R. O. A.;
Exp. Parasitol. 2010, 124, 319.
7. Cabral, M. M. O.; Azambuja, P.; Gottlieb, O. R.; Garcia, E. S.;
Parasitol. Res. 1999, 85, 184.
8. Cabral, M. M. O.; Azambuja, P.; Gottlieb, O. R.; Kleffmann, T.;
Garcia, E. S.; Schaub, G. A.; Parasitol. Res. 2001, 87, 730.
9. Chauret, D. C.; Bernard, C. B.; Arnason, J. T.; Durst, T.; Krishnamurty, H. G.; Sanchez-Vindas, P.; Moreno, N.; San
Roman, L.; Poveda, L.; J. Agr. Food Chem. 1996, 59, 152.
10. Quideuau, S.; Ralph, J.; Holzforschung 1994, 48, 12.
11. Li, Q.-B.; Hu, X.-C.; Chem. Lett. 2012, 41, 1633.
12. Kao, C.-L.; Chern, J.-W.; J. Org. Chem. 2002, 67, 6772.
13. Van Miert, S.; Dyck, S. V.; Schmidt, T. J.; Brun, R.; Vlietinck, A.;
Lemière, G.; Pieters, L.; Bioorgan. Med. Chem. 2005, 13, 661.
14. Apers, S.; Paper, D.; Bürgermeister, J.; Barnikova, S.; Van Dyck,
S.; Lemière, G.; Vlietinck, A.; Pieters, L.; J. Nat. Prod. 2002,
65, 718.
15. Pieters, L.; Van Dyck, S.; Gao, M.; Bai, R.; Hamel, E.;
Vlietinck, A.; Lemiere, G.; J. Med. Chem. 1999, 42, 5475.
16. Rakotondramanana, D. L. A.; Delomenède, M.; Baltas, M.; Duran, H.; Bedos-Belval, F.; Rasoanaivo, P.; Negre-Salvayre, A.;
Gornitzka, H.; Bioorg. Med. Chem. 2007, 15, 6018.
17. Lemière, G.; Gao, M.; De Groot, A.; Dommisse, R.; Lepoivre, J.;
Pieters, L.; Buss, V.; J. Chem. Soc. Perk. T. 1 1995, 13, 1775.
18. Kuo, Y. H.; Wu, C.-H.; J. Nat. Prod. 1996, 59, 625;
Snider, S. A.; Kontes, F.; J. Am. Chem. Soc. 2009, 131, 1745.
19. Heleno, V. C. G.; Crotti, A. E. M.; Constantino, M. G.; Lopes,
N. P.; Lopes, J. L. C.; Magn. Reson. Chem. 2004, 42, 364.
20. Heleno, V. C. G.; Oliveira, K. T.; Lopes, J. L. C.; Lopes, N. P.;
Ferreira, A. G.; Magn. Reson. Chem. 2008, 46, 576.
21. Soares, A. C. F.; Silva, A. N.; Matos, P. N.; Silva, E. H.; Lopes,
N. P.; Lopes, J. L. C.; Sass, D. C.; Heleno, V. C. G.; Quim. Nova
2012, 35, 2205.
22. Silva, R.; Heleno, V. C. G.; Albuquerque, S.; Bastos, J. K.; Silva,
M. L. A.; Donate, P. M.; Silva, G. V. J.; Magn. Reson. Chem.
2004, 42, 985.
23. Constantino, M. G.; Silva-Filho, L. C.; Cunha Neto, A.; Heleno,
V. C. G.; Silva, G. V. J.; Lopes, J. L. C.; Spectrochim. Acta A
2005, 61, 171.
24. Heleno, V. C. G.; Silva, R.; Pedersoli, S.; Albuquerque, S.; Bastos, J. K.; Silva, M. L. A.; Donate, P. M.; Silva, G. V. J.;
Lopes, J. L. C.; Spectrochim. Acta A 2006, 63, 234.
25. Blau, L.; Menegon, R. F.; Ferreira, E. I.; Ferreira, A. G.; Boffo,
E. F.; Tavares, L. A.; Heleno, V. C. G.; Chung, M. C.; Molecules
2008, 13, 841.
26. Maeda, S.; Masuda, H.; Tokoroyama, T.; Chem. Pharm. Bull.
1995, 43, 935.
27. Daquino, C.; Rescifina, A.; Spatafora, C.; Tringali, C.; Eur. J.
Org. Chem 2009, 36, 6289.
28. Li, S. L.; Iliefski, T.; Lundquist, K.; Wallis, A. F. A.;
Phytochemistry 1997, 46, 929.
29. Constantino, M. G.; Lacerda-Júnior, V.; Silva, G. V. J.; Magn.
Reson. Chem. 2003, 41, 641.
30. Muñoz, M. A.; Joseph-Nathan, P.; Magn. Reson. Chem. 2009,
47, 578.
31. Lomas, J. S.; Magn. Reson. Chem. 2014, 52, 745.
32. Orlandi, M.; Rindone, B.; Molteni, G.; Rummakko, P.;
Brunow, G.; Tetrahedron 2001, 57, 371.
Tomasi, J.; Cossi, M.; Rega, N.; Millam, J. M.; Klene, M.; Knox, J. E.; Cross, J. B.; Bakken, V.; Adamo, C.; Jaramillo, J.; Gomperts, R.; Stratmann, R. E.; Yazyev, O.; Austin, A. J.; Cammi, R.; Pomelli, C.; Ochterski, J. W.; Martin, R. L.; Morokuma, K.; Zakrzewski, V. G.; Voth, G. A.; Salvador, P.; Dannenberg, J. J.; Dapprich, S.; Daniels, A. D.; Farkas, Ö.; Foresman, J. B.; Ortiz, J. V.; Cioslowski, J.; Fox, D. J.;
Gaussian 09 Inc., USA, 2009.
34. Becke, A. D.; J. Chem. Phys. 1993, 98, 5648; Lee, C.; Yang,
W.; Parr, R. G.; Phys. Rev. B 1988, 37, 785.
35. Krishnan, R.; Binkley, J. S.; Seeger, R.; Pople, J. A.; J. Chem.
Phys. 1980, 72, 650; Blaudeau, J.-P.; McGrath, M. P.; Curtiss, L.
A.; Radom, L.; J. Chem. Phys. 1997, 107, 5016; Clark, T.;
Chandrasekhar, J.; Spitznagel, G. W.; Schleyer, P. V. R.;
J. Comput. Chem. 1983, 4, 294.
36. London, F.; J. Phys. Radium 1937, 8, 397.
37. McWeeny, R.; Phys. Rev. 1962, 126, 1028; Ditchfield, R.; Mol.
Phys. 1974, 27, 789.
38. Wolinski, K.; Hinton, J. F.; Pulay, P.; J. Am. Chem. Soc. 1990,
112, 8251.
39. Deng, W.; Cheeseman, J. R.; Frisch, M. J.; J. Chem. Theory
Comput. 2006, 2, 1028.
40. Lodewyk, M. W.; Siebert, M. R.; Tantillo, D. J.; Chem. Rev.
2012, 112, 1839.
41. Lodewyk, M. W.; Soldi, C.; Jones, P. B.; Olmstead, M. M.;
Rita, J.; Shaw, J. T.; Tantillo, D. J.; J. Am. Chem. Soc. 2012,
134, 18550.
42. Lodewyk, M. W.; Tantillo, D. J.; J. Nat. Prod. 2011, 74, 1339.
43. Tomasi, J.; Mennucci, B.; Cammi, R.; Chem. Rev. 2005, 105,
2999.
Submitted: July 8, 2015
Published online: October 9, 2015