Article
J. Braz. Chem. Soc., Vol. 27, No. 1, 77-83, 2016. Printed in Brazil - ©2016 Sociedade Brasileira de Química 0103 - 5053 $6.00+0.00
A
*e-mail: csrandrade@gmail.com
Dielectric Behavior of Alginate-Based Hydrogel Containing Neomycin-Loaded Lipid
Nanovesicles under Influence of Electrical Potentials
Rafael R. Silva,a Sandro V. de Lima,b Gustavo H. R. C. Silva,c Helinando P. de Oliveira,d
Maria D. L. Oliveirac and Cesar A. S. Andrade*,a,c
aPrograma de Pós-Graduação em Inovação Terapêutica, bDepartamento de Física and cDepartamento de Bioquímica, Universidade Federal de Pernambuco, 50670-901 Recife-PE, Brazil
dColegiado de Pós-Graduação em Ciência dos Materiais, Universidade Federal do Vale do São
Francisco, 48902-300 Juazeiro-BA, Brazil
Dielectric characterization has been applied as a convenient tool for evaluation of transport and polarization mechanisms in soft materials. In this work, we have explored the study of charge transport mechanisms in alginate hydrogel containing neomycin-loaded liposomes. For comparison, drug release kinetic was evaluated by using UV-Vis spectrophotometry and electrical impedance spectroscopy (EIS) at different external direct current (DC) polarization (100 mV and 1 V). The charge transfer resistance (Rct) was proportional to DC electrical stimulation and inversely to the amount of released neomycin. Optical and electrical measurements confirmed the dependence of neomycin release under influence of electrical potentials. The kinetic profile of these systems was described by zero-order model. In addition, the Korsmeyer-Peppas model also suggested a diffusion mechanism based on super case II transport (non-Fickian). These results encouraged the use of EIS as a “dark” spectroscopy technique, since EIS is effective for studies of release kinetics controlled by DC external electrical excitation.
Keywords: controlled release, hydrogel, alginate, liposomes, impedance spectroscopy
Introduction
Hydrogels are semi-solid materials soluble in polar solvent with potential application in the development of new controlled release systems.1 Therapeutic use of hydrogels is associated with diverse applications such as ophthalmic ointments,2 wound healing for venous ulcers3 and treatment for skin infections.4 A variety of synthetic and natural molecules, extracted from animals, plants or algae serves as a basis for gel preparation.5
Alginate (Alg), an anionic polysaccharide isolated from brown seaweed with linear structure containing homopolymeric blocks of guluronate and mannuronate residues, has been extensively used in the pharmaceutical industry for production of natural ointments. Alg is an electro-responsive polymer due to the presence of ionizable groups (–COOH) and counterions (Na+ and Ca+), with an important role during ion exchange process.6-8
The advantages of Alg, viz., high solubility in polar solvents, biodegradability and non-toxicity9 contribute
to development of new promising controlled release systems for antibacterial applications.10 In addition, the association between liposomes (Lipo) and Alg hydrogel improves the controlled release of resulting systems.11 Lipo are nanometric spherical lipid vesicles with different properties, viz., varying size, number of lipid layers, lipid constitution, biocompatibility and different routes of administration.12
Neomycin (Neo) is a well-known antibiotic with effective action against Gram-negative bacteria, such as
Klebsiella pneumoniae, Escherichia coli and Pseudomonas aeruginosa.13,14 The system composed by Neo-loaded Lipo could be considered as an ideal model for development of topical formulations.
In general, drug release kinetic profile is evaluated by
different methods such as UV-Vis spectrophotometry,15
fluorescence spectrometry16 and high performance liquid
chromatography.17 On the other hand, electrochemical
soft materials, such as polymers.18,19 Furthermore, the analysis of the alternating current (AC) response of the materials using equivalent electric circuit models allows the evaluation of diverse parameters such as charge transfer resistance (Rct), double electric layer, bulk resistance and others.20
In this study, we analyzed NeoLipoAlg systems at zero direct current (DC) external excitation and under influence of two external applied potentials (100 mV and 1 V). Neo release kinetic profiles from LipoAlg system under influence of electrical potentials were monitored using the alternative viewpoint of the EIS. For comparison, the amount of the drug released was also evaluated using an optical conventional technique.
Experimental
Materials
Neomycin trisulfate salt hydrate, L-α -phosphatidyl-choline (PC), cholesterol (CHOL), sodium alginate, chloroform and methanol were purchased from Sigma Aldrich. Deionized (DI) water was obtained from a Sinergy Millipore System.
Preparation of NeoLipoAlg system
Liposomal colloidal solution was synthesized using a mixture of PC:CHOL (7:1 m/m) dissolved in chloroform:methanol (9:1 v/v) solution. Subsequently, the solvent mixture was removed under reduced pressure during 5 min at 37 ± 1 °C at 80 rpm. After that, the resulting dried thin lipid film was hydrated with 5 mL of 10 mmol L-1 Neo aqueous solution. Resulting sample was sonicated for 5 min at 15 kHz (UNIQUE DES500) in order to obtain large unilamellar vesicles (LUV). Finally, 1 mL NeoLipo solution was added to 300 mg of Alg to obtain a homogeneous mixture of hydrogel (NeoLipoAlg system).
Particle size and zeta potential measurements
Size distribution and zeta potential of NeoLipo samples were determined by photon correlation spectroscopy (Zetasizer Nano ZS90, Malvern Instruments) with a laser wavelength of 633 nm at a fixed angle of 90° at 25 °C. All measurements were performed in triplicate.
Calculation of drug entrapment efficiency
Drug entrapment efficiency (%EE) of the liposomes was evaluated after ultracentrifugation at 8,792 g for 1 h.
Subsequently, the supernatant was diluted with DI water (1:10 v/v). The drug content was evaluated by UV-Vis spectroscopy at λ = 282 nm and calculated as follows:
(
) (
)
(
)
NeoLipo Neounl %EE
NeoLipo
−
= ×100 (1)
NeoLipo and Neounl represent the amount of the drug encapsulated and non-encapsulated in the liposomes, respectively.
UV-Vis measurements
Neo calibration curve was performed using eight different concentrations (1.0 to 10 mmol L-1) dissolved in DI water. Subsequently, the samples were analyzed by UV-Vis spectrophotometer (FEMTO 800) at fixed wavelength (λ = 282 nm).
The experiments were performed using two parallel stainless steel electrodes (area of 59 mm × 19 mm) connected to an external high-voltage source measurement unit (Model 237, Keithley). Experiments were performed at zero DC excitation and under influence of two external DC voltage (100 mV and 1 V). Aliquots of 2 mL were collected during 1 h with intervals of 5 min and, after each removal, 2 mL of fresh DI water were replenished carefully to keep the total volume. The amount of drug released was calculated according to the following equation:
NeoAbs = NeoLipoAlgAbs – LipoAlgAbs (2)
Neo absorbance (NeoAbs) corresponds to the difference between optical absorption of NeoLipoAlg and LipoAlg. The calculation of difference excludes the interference of hydrogel absorption on measurement of UV-Vis absorption.
Drug release kinetic models
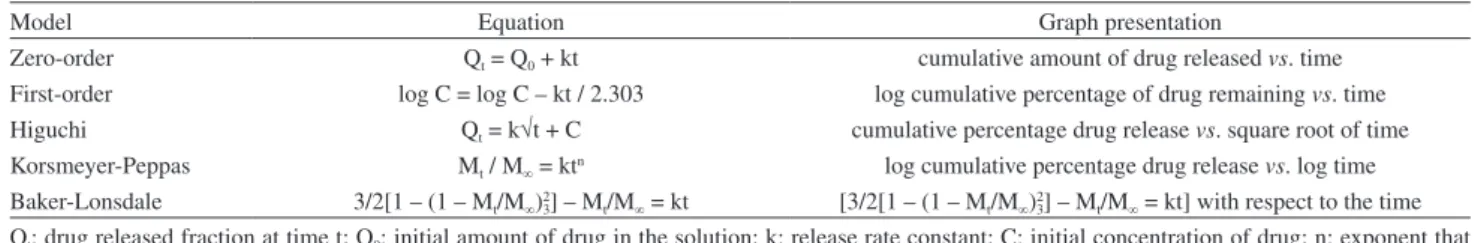
Five mathematical models (Table 1) were applied to analyze drug release mechanism, as follows: zero-order, first-order, Higuchi, Korsmeyer-Peppas and Baker-Lonsdale. These models are applied to systems which present a porous polymers composition, loaded hydrophilic drugs and pharmaceutical forms in general including spherical geometry.21
Morphological analysis under influence of electrical potentials
A homemade apparatus composed of a Petri plate, two parallel stainless steel electrodes (area of 59 mm × 19 mm) and a power supply for electro-stimulation was used to stimulate the drug release. The morphology and behavior of gel at unstimulated condition and under influence of external electric potentials (100 mV and 1 V) were evaluated using an optical microscope (CKX31, Olympus). The images were captured using a high-resolution digital camera (CCD) and analyzed by ImageJ software (NIH Image).
Dielectric impedance measurements
Dielectric measurements were performed using two parallel stainless steel electrodes (area of 59 × 19 mm) into a beaker containing 50 mL DI water placed inside a Faraday cage. Analyses were carried out at neutral and stimulated (100 mV and 1 V) conditions using an external high-voltage source measurement unit (Model 237, Keithley).
The experiments were carried out using a PGSTAT 128N Autolab potentiostat/galvanostat (Metrohm). The impedance spectra were recorded in a frequency range from 0.1 to 105 Hz with AC voltage of 10 mV. In addition, the standard deviation is approximately 5% for all measurements. The collected data were recorded during 1 h with interval of 10 min. Results are shown in terms of cumulative percentage release as a function of time, as follows:
= i ×100% d
N Cumulative percentage release
N (3)
where Ni is the cumulative amount of Neo released from LipoAlg and Nd is the total amount of Neo loaded into LipoAlg.
Statistical and data analysis
Statistical and data analysis were carried out using Prism software (version 5, GraphPad). The paired t-test
(one-tailed) was used considering p values less than 0.05 as statistically significant. The graphical representation was obtained using OriginPro software (version 8, OriginLab).
Results and Discussion
Particle size and zeta potential analysis
Three independent samples of Lipo and NeoLipo systems were analysed. Dynamic light scattering measurements indicated significant differences in the diameters of Lipo (125.80 ± 4.32 nm) and NeoLipo (132.10 ± 5.25 nm) samples. Zeta potential values also showed differences (p = 0.012) in the electrical double layer of Lipo (–1.59 ± 0.12 mV) compared to NeoLipo system (–1.06 ± 0.02 mV). The differences observed for zeta values could be attributed to the presence of non-encapsulated drug22 or electrostatic interactions with liposomes,23 since Neo has a positive charge.
Drug entrapment efficiency and kinetics profile determination
The maximum absorbance (λmax = 282 nm) was used
to evaluate %EE. The value of r² in the calibration curve is nearly 1 (r² = 0.999). Results demonstrated a drug entrapment efficiency of 92.5%. The polymer dissolution is involved with two transport processes as solvent
diffusion and chain disentanglement.24 The excess of
solvent results in increase of dissolution degree associated with subsequent swelling of hydrogel. Moreover, drug release can be improved during electrical stimulation of the hydrogel.7,25,26
In the order to elucidate the release mechanism, the data were fitted considering the correlation coefficient (r2) and the release rate constant (k) for unstimulated and estimulated conditions (Table 2).
As observed in Table 2, r2 for zero-order for all three conditions (unstimulated, 100 mV and 1 V) ranged from 0.9957, 0.9928 and 0.9937, respectively, demonstrating that drug release followed zero-order kinetics. It is noteworthy to mention that this model is applied to several
Table 1. Mathematical models used to analyze drug release mechanisms
Model Equation Graph presentation
Zero-order Qt = Q0 + kt cumulative amount of drug released vs. time
First-order log C = log C – kt / 2.303 log cumulative percentage of drug remaining vs. time Higuchi Qt = k√t + C cumulative percentage drug release vs. square root of time
Korsmeyer-Peppas Mt / M∞ = ktn log cumulative percentage drug release vs. log time
Baker-Lonsdale 3/2[1 – (1 – Mt/M∞)32] – Mt/M∞ = kt [3/2[1 – (1 – Mt/M∞)32] – Mt/M∞ = kt] with respect to the time
Qt: drug released fraction at time t; Q0: initial amount of drug in the solution; k: release rate constant; C: initial concentration of drug; n: exponent that
pharmaceutical forms involving hydrophilic drugs and a constant release from polymer matrices independent of time.27,28 However, the electrical stimulation suggested an influence in the polymer, demonstrating a higher amount of drug release in 100 mV and 1 V compared to unstimulated condition.
The correlation coefficient (r2) for Korsmeyer-Peppas equation also presented good correlation for all three conditions (0.9728, 0.9890, and 0.9967, respectively). Considering our drug delivery system, which has spherical geometry, a limiting n value of 0.45 corresponds to a Fickian diffusion of the drug. The n values from 0.45 to 0.85 indicate a diffusion-dependent drug mechanism and considering the erosion of the polymer matrix. The n values > 0.85 are associated with previous description and may indicate that the drug-release is controlled by multiple process. The n value higher than 1, which may be regarded as super case II transport (non-Fickian model)29 was observed for all NeoLipoAlg conditions (n = 1.07). This mechanism involves the superposition of swelling, relaxation and dissolution of the polymer. The log% cumulative release under electrical potentials was higher than unstimulated condition (Supplementary Information Figure S1d). The statistical differences were observed for
electrically stimulated systems compared to unstimulated condition (p < 0.0001).
A recent report demonstrated the relationship between drug release and external applied potentials.7 On the other hand, no significant differences were observed between the responses of the NeoLipoAlg under electrical potentials (p = 0.4991). The similarity in release profiles between stimulated conditions suggests that 100 mV is sufficient to increase the amount of drug released at NeoLipoAlg system. Other models have no better correlation coefficients than the models discussed above.
Morphological analysis under influence of electrical potentials
Optical and electrical experiments were performed to evaluate gel morphology and behavior at unstimulated and under electrical stimulated conditions. The gel motion was proportional to the applied potential (Figures 1 and 2). NeoLipoAlg system (Figure 1) revealed strong motion in comparison with neat Alg (Figure 2). The presence of amine groups in the Neo molecule promote a better ion exchange contributing to the increase of electrical conductivity.30
Table 2. Simulated results for the release profile according to mathematical models
Model
Potential / V
0 0.1 1
k r2 k r2 k r2
Zero-order 1.07 0.9957 1.45 0.9928 1.55 0.9937
First-order 3.13 × 10⁻³ 0.9728 5.87 × 10⁻³ 0.9196 6.51 × 10⁻³ 0.9174
Higuchi 8.72 0.8802 11.82 0.8695 12.73 0.8783
Korsmeyer-Peppas 1.06 0.9966 1.00 0.9890 1.16 0.9967
Baker-Lonsdale 1.6 × 10⁻³ 0.8805 3.8 × 10⁻³ 0.8449 4.2 × 10⁻³ 0.8437
k: release rate constant; r2: correlation coefficient.
Electrochemical impedance spectroscopy analysis
The Nyquist plot (–Z” vs. Z’) of the three NeoLipoAlg conditions are shown in Figure 3. In general, the plots present two well-defined regions: a semicircle at high frequencies and non-vertical spike at lower frequencies. The semicircle formation is associated with the bulk effect of electrolytes whereas a non-vertical spike can be attributed to the polarization of the electrode-electrolyte interface. Since Alg and Neo are highly conductive, the semicircle formation was not fully formed. The bulk resistance was obtained from the intersection of the high frequency impedance semicircle with the real axis (Z’).29,30
We observed that a reduction in the real part of the impedance varies inversely with values of external DC polarization. Real values of impedance (Z’) are lower due to the higher rate of Neo release (Z’ 1 V < Z’ 100 mV < Z’ unstimulated condition). It was observed that gradual decrease in the magnitude of impedance with increasing time resulted in a reduction of characteristic semicircle in the Nyquist diagram. The bulk electrical response was dependent on the amount of dispersed analytes.31
Equivalent circuit
Detailed information about impedimetric spectra can be obtained using equivalent circuit. Impedimetric results were fitted using a modified Randles circuit (Figure 4), which consists of ohmic resistance of the solution (Rs) assigned to the ion migration in the solution (bulk resistance). Rct is associated with resistance for electric current transportation in the electrode/solution interface. The capacitance of the double layer (Cdl) represents the ability to store charge in the electrode and constant phase element (Cpe) introducing additional mechanisms that
Figure 2. Digital images of pure alginate before (a-c) and after editing (d-f) with ImageJ software. The edited images represent the gel at three different conditions, as follows: unstimulated condition (a and d) and under influence of electric potential at 100 mV (b and e) and 1 V (c and f). The lighter areas (yellow) represent surface regions while the darker areas (purple) represent the deepest regions of the gel. The electrical stimulation induced a discrete motion in the gel mesh. It is possible to observe this phenomenon in highlighted areas (blue cyan rectangles).
0 5 10 15 20 25 30 35
0 5 10 15 20 25 30 35 0 min 10 min 20 min 30 min 40 min 50 min 60 min -Z '' / k Ω
Z' / kΩ
(a) NeoLipoAlg steady state
0 5 10 15 20 25 30 35
0 5 10 15 20 25 30 0 min 10 min 20 min 30 min 40 min 50 min 60 min -Z " / k Ω
Z' / kΩ
(b) NeoLipoAlg 100 mV
0 5 10 15 20 25 30 35
0 5 10 15 20 25 30 0 min 10 min 20 min 30 min 40 min 50 min 60 min -Z '' / k Ω
Z' / kΩ
(c) NeoLipoAlg 1 V
Figure 3. Nyquist diagrams of NeoLipoAlg at different conditions: (a) unstimulated, (b) 100 mV and (c) 1 V. The results were recorded every 10 min during a maximum period of 1h.
0 5 10 15 20 25 30 35 0 5 10 15 20 25 30 35 0 min 10 min 20 min 30 min 40 min 50 min 60 min -Z '' / k Ω
Z' / kΩ (a) NeoLipoAlg steady state
0 5 10 15 20 25 30 35 0 5 10 15 20 25 30 0 min 10 min 20 min 30 min 40 min 50 min 60 min -Z " / k Ω
Z' / kΩ (b) NeoLipoAlg 100 mV
0 5 10 15 20 25 30 35 0 5 10 15 20 25 30 0 min 10 min 20 min 30 min 40 min 50 min 60 min -Z '' / k Ω
contributes with a depressed semicircle response such as diffusion.32,33
Fitted curves exhibited an excellent agreement with experimental impedance plots. Parameters calculated from the fitting are shown in Table S1. As explained before, a notable Rct decrease was observed for all experiments and the impedimetric response of NeoLipoAlg at 100 mV and 1 V was more pronounced than at unstimulated condition. In addition, the obtained response can be explained by different conditions of the interaction between the polymer and water resulting in degradation, passive diffusion and electric induction of the drug.8,34
The impedimetric response of NeoLipoAlg at unstimulated condition in a period of 1 h has no statistical significance if compared to an external excitation of 100 mV (p = 0.0966). Significant Rct values (p = 0.01401) are observed at high potential values (1 V). The Rct curve showed a similar behavior during the first 20 min for all analyzed systems (Figure 5).
NeoLipoAlg resistances at 100 mV and 1 V were significantly reduced (p = 0.0032 for both conditions) compared to the unstimulated condition, which means that the resistivity decreases while the capacitance increases.
Conclusions
The electro-responsive property of the gel contributed to its induced movement and drug controlled release.
-5 0 5 10 15 20 25 30 35 40 45 50 55 60 65 4
6 8 10 12 14 16 18 20 22 24 26 28 30
R
e
s
is
ta
n
c
e
/
k
Ω
time / min NeoLipoAlg 1 V NeoLipoAlg 100 mV NeoLipoAlg unstimulated
Figure 5. Representation of the resistance values vs. time for NeoLipoAlg systems at unstimulated condition, 100 mV and 1 V conditions.
The drug release kinetic profile was characterized as a superposition of both Fickian diffusion and case-II transport. The degree of drug release was directly dependent on the electro-stimulation. Our results suggest that EIS can be an additional tool to monitor the drug release from polymers in aqueous solution. The solubility, swelling, electro-responsiveness and diffusion of the drug through the hydrogel matrix contributed to a gradual drug release with potential use for in vivo applications.
Supplementary Information
Supplementary data are available free of charge at http://jbcs.sbq.org.br as PDF file.
Acknowledgements
The authors are grateful for the support provided by FACEPE, CNPq and Rede de Nanobiotecnologia/CAPES. C. A. S. Andrade and M. D. L. Oliveira are also gratefully for CNPq financial support (grants 310305/2012-8 and 310361/2012-5, respectively). R. R. Silva would like to thank FACEPE for PhD scholarship.
References
1. Jones, D. S.; Lorimer, C. P.; McCoy, C. P.; Gorman, S. P.;
J. Biomed. Mater. Res., Part B2008, 85, 417.
2. Kushwaha, S. K.; Saxena, P.; Rai, A.; Int. J. Pharm. Invest.
2012, 2, 54.
3. Dumville, J. C.; O’Meara, S.; Deshpande, S.; Speak, K.;
Cochrane Database Syst. Rev. 2003, CD009110.
4. Miguel, S. P.; Ribeiro, M. P.; Brancal, H.; Coutinho, P.; Correia, I. J.; Carbohydr. Polym. 2014, 111, 366.
5. Kataoka, K.; Suzuki, Y.; Kitada, M.; Ohnishi, K.; Suzuki, K.; Tanihara, M.; J. Biomed. Mater. Res. 2001, 54, 373.
6. Zvitov, R.; Nussinovitch, A.; Food Hydrocolloids2003, 17, 255. 7. Kulkarni, R. V.; Setty, C. M.; Sa, B.; J. Appl. Polym. Sci. 2010,
115, 1180.
8. Ko, Y. G.; Lee, H. J.; Chun, Y. J.; Choi, U. S.; Yoo, K. P.; ACS Appl. Mater. Interfaces2013, 5, 1122.
9. Lee, W. R.; Park, J. H.; Kim, K. H.; Kim, S. J.; Park, D. H.; Chae, M. H.; Wound Repair Regen. 2009, 17, 505.
10. Rao, K. M.; Rao, K. S. V. K.; Ramanjaneyulu, G.; Rao, K. C.; Subha, M. C. S.; Ha, C.-S.; J. Biomed. Mater. Res., Part A,
in press, DOI: 10.1002/jbma.34991.
11. Gao, W.; Vecchio, D.; Li, J.; Zhu, J.; Zhang, Q.; Fu, V.; ACS Nano2014, 8, 2900.
12. Akbarzadeh, A.; Rezaei-Sadabady, R.; Davaran, S.; Joo, S. W.; Zarghami, N.; Hanifehpour, Y.; Nanoscale Res. Lett.2013, 8, 102.
Figure 4. Equivalent circuit adopted to fit the impedance data.
-5 0 5 10 15 20 25 30 35 40 45 50 55 60 65
4 6 8 10 12 14 16 18 20 22 24 26 28 30
R
e
s
is
ta
n
c
e
/
k
Ω
13. Brewer, N. S.; Mayo Clin. Proc. 1977, 52, 675. 14. Saidkarimov, S.; Antibiotiki1962, 7, 339.
15. Rathore, N.; Qi, W.; Ji, W.; Biotechnol. Prog. 2008, 24, 684. 16. Delie, F.; Gurny, R.; Zimmer, A.; Biol. Chem.2001, 382,487. 17. Mondal, N.; Pal, T. K.; Ghosal, S. K.; Acta Pol. Pharm. 2009,
66, 11.
18. Lasia, A.; Electrochemical Impedance Spectroscopy and Its Applications, vol. 32, 1st ed.; Springer: New York, 2002. 19. Bard, A. J.; Faulkner, L. R.; Electrochemical Methods:
Fundamentals and Applications, vol. 2, 2nd ed.; Wiley: New York, 1980.
20. Oliveira, M. D.; Franco, O. L.; Nascimento, J. M.; de Melo, C. P.; Andrade, C. A.; Curr. Protein Pept. Sci. 2013, 14, 543. 21. Dash, S.; Murthy, P. N.; Nath, L.; Chowdhury, P.; Acta Pol.
Pharm.2010, 67, 217.
22. Hernández-Caselles, T.; Villalaín, J.; Gómez-Fernández, J. C.;
Mol. Cell. Biochem. 1993, 120, 119.
23. Ogiso, T.; Yamaguchi, T.; Iwaki, M.; Tanino, T.; Miyake, Y.;
J. Drug Targeting2001, 9, 49.
24. Dash, S.; Murthy, P. N.; Nath, L.; Chowdhury, P.; Acta Pol. Pharm. 2010, 67, 217.
25. Fu, Y.; Kao, W. J.; Expert Opin. Drug Delivery2010, 7, 429. 26. Murdan, S.; J. Controlled Release2003, 92, 1.
27. Narashimhan, B.; Mallapragada, S. K.; Peppas, N. A.;
Encyclopedia of Controlled Drug Delivery,vol. 2; Wiley: New York, 1999.
28. Hadjiioannou, T. P.; Christian, G. D.; Koupparis, M. A.; Macheras, P. E.; Quantitative Calculations in Pharmaceutical Practice and Research; VCH Publishers: New York, 1993. 29. Kurzawa, M.; Jastrzębska, A.; Szłyk, E.; Chem. Pap. 2009, 63,
255.
30. Sheybani, R.; Cabrera-Munoz, N. E.; Sanchez, T.; Meng, E.;
Conf. Proc. IEEE Eng. Med. Biol. Soc.2012, 519.
31. Shi, X.; Zheng, Y.; Wang, G.; Lin, Q.; Fan, J.; RSC Adv. 2014, 1.
32. Katz, E.; Willner, I.; Electroanalysis2003, 15, 913. 33. Lima, S. V.; Oliveira, H. P.; Quim. Nova2010, 33, 1928. 34. Jarek, S.; Thonstad, J.; J. Appl. Electrochem. 1987, 17, 1203.
Submitted: August 10, 2015