Engineering
www.abeq.org.br/bjchePrinted in BrazilVol. 34, No. 02, pp. 385 - 394, April - June, 2017 dx.doi.org/10.1590/0104-6632.20170342s20150549
DETERMINATION OF ACOUSTIC FIELDS IN
ACIDIC SUSPENSIONS OF PEANUT SHELL
DURING PRETREATMENT WITH HIGH-INTENSITY
ULTRASOUND
T. C. Polachini
*, G. R. de Carvalho and J. Telis-Romero
Food Engineering and Technology Department, State University of São Paulo (UNESP), Institute of Biosciences, Humanities and Exact Sciences (IBILCE),
Campus São José do Rio Preto, São Paulo, 15054-000, Brazil. Tel.: +55 17 3221 2251; Fax: +55 17 3221 2250
E-mail: [email protected]
(Submitted: August 28, 2015; Revised: December 2, 2015; Accepted: January 25, 2016)
Abstract – The beneits of high-intensity ultrasound in diverse processes have stimulated many studies based on biomass pretreatment. In order to improve processes involving ultrasound, a calorimetric method has
been widely used to measure the real power absorbed by the material as well as the cavitation efects. Peanut shells, a byproduct of peanut processing, were immersed in acidiied aqueous solutions and submitted to an ultrasonic ield. Acoustic power absorbed, acoustic intensity and power yield were obtained through speciic heat determination and experimental data were modeled in diferent conditions. Speciic heat values ranged
from 3537.0 to 4190.6 J·kg-1·K-1, with lower values encountered for more concentrated biomass suspensions.
The acoustic power transmitted and acoustic intensity varied linearly with the applied power and quadratically with solids concentration, reaching maximum values at higher applied nominal power and for less concentrated
suspensions. A power yield of 82.7% was reached for dilute suspensions at 320 W, while 6.4% eiciency was
observed for a concentrated suspension at low input energy (80 W).
Keywords: acoustic intensity, biomass pretreatment, ultrasonic hydrolysis, speciic heat, power yield.
INTRODUCTION
The increase of CO2 emissions combined with the search for nonpetroleum-based sources of energy has strengthened many studies involving lignocellulosic wastes conversion into biofuel (Alvira et al., 2010). Lignocellulosic biomass is a less expensive product and its availability in larger quantities as compared to sucrose, for example, represents a great source for the bioethanol industry (Zheng et al., 2009).
Peanut shell is a byproduct obtained from peanut processing and has a great potential to be used as lignocellulosic raw material for the second-generation ethanol industry. It has been widely used as a rotary culture
for sugarcane, representing about 90 thousand tons of biomass per year, considering the grain/shell ratio (Godoy et al., 1982; IBGE, 2014).The average of 38% cellulose shows its capability of releasing sugars for posterior fermentation and distillation (Castro and Pereira-Jr, 2010).
and high-intensity ultrasound (Villa-Vélez et al., 2015b). High-intensity ultrasound, or power ultrasound, is a technology able to reduce cellulose crystallinity and release polymers and monomers of carbohydrates from lignocellulosic material. Its success is directly related to the applied power, as well as the degree of cavitation (Kanthale et al., 2003). Determination of the real power applied by ultrasound is an important step to quantify the cavitation efects occasioned by the collapse of microbubbles (Kuijpers et al., 2002). This cavitation phenomenon can be inluenced by many factors such as local high temperatures, electric ields and mechanical action on interfaces (Contamine et al., 1995).
The active energy is the main parameter responsible for the sonochemical reactions in sonication processes, and can be measured by absorbed acoustical energy. On the other hand, unabsorbed energy is the energy lost during the process and should not be taken into account during cavitation measurement. Studies of the eiciency of input energy conversion into absorbed power in the liquid volume have been developed to evaluate the energy output in diferent food processes, e. g., bioactive compounds extraction and meat brining (Cárcel et al., 2007a; McDonnell et al., 2014; Pingret et al., 2012). However, studies involving biomass treatment with ultrasound are still missing in the literature.
Diferent methods have been considered to determine the real power absorbed by the material of interest. Some of them intended to correlate physical efects by the dosage of radicals during sonication (Iida et al., 2005; Trabelsi et al., 1996), by calorimetry of thermal response (Margulis and Margulis, 2003) and by acoustic pressure using a hydrophone probe (Jenderka and Koch, 2006; Lewin, 1981; Zeqiri et al., 2006).
The calorimetric method is a highlighted practice due to its reproducibility and accuracy (Berlan and Mason, 1996; Raso et al., 1999). It assumes that all absorbed acoustical energy is transformed into heat, although acoustic streaming may happen as a dissipation form at high power levels (Margulis and Margulis, 2003). This method is based on continuous recording of the temperature change according to the sonication time (Raso et al., 1999).
Many independent variables inluence the energy absorption during ultrasonic application, making it unique for each process. Among these variables, there are physical properties (speciic heat, viscosity, surface pressure and vapor pressure), liquid volume and/or height, input power, sonotrode type and position, etc. (Toma et al., 2011).
These facts reinforce the need for evaluating the real power absorbed by diferent acidic suspensions of biomass used during ultrasonic pretreatment. Thus, this work aimed to determine the acoustic ields (acoustic power, acoustic intensity and power yield) in acidiied suspensions of peanut shells. Determination and modeling of speciic
heat were necessary to apply the calorimetric method. Speciic heat and acoustical properties could be written and evaluated as functions of the nominal input power, biomass concentration and pH.
MATERIALS AND METHODS
Raw material and sample preparation
Cleaned and dried peanut (Arachishypogaea L.) shells were acquired from the Agro-industrial Cooperative – COPLANA (Jaboticabal, São Paulo, Brazil). Using a knife mill MA380 (Marconi, Piracicaba, Brazil), the shells were milled and separated by Tyler sieves of 12 and 150 mesh to obtain powdered peanut shells with particle size between 104–1397 μm.This wide range of particle size was used to simulate a real situation that might be used in the second-generation ethanol industry.
For experimental measurements, acidic suspensions of powdered peanut shells (ASPPS) were prepared in weight/weight units using an analytical balance with an accuracy of 1×10⁻⁵ g (model AUX220, Shimadzu, Japan),
obtaining biomass concentrations of 4, 6, 8, 10 and 12%. The acidiication of the solutions was previously realized using 500 mL of distilled water, adding 0.05% H2SO4 and stabilizing for 3 days to obtain pH values of 3, 4, 5, 6 and 7. Only for the speciic heat measurements, the suspensions were prepared with particle size of 104 μm to avoid particle sedimentation and microsyringe obstruction. This step ensured particle scattering and sample homogeneity to carry out the thermal analysis in the diferential scanning calorimeter.
Speciic heat measurements
Through a diferential scanning calorimeter DSC 8000 (Perkin Elmer, Shelton, USA), speciic heat (c
p) were
determined by the standard ASTM method for thermally stable liquids and solids (ASTM-E1269, 2005). The analysis consists of applying a heat low under a controlled atmosphere (nitrogen 99.5% of purity) to evaluate the heat low and energy alterations in the material. Equipment was calibrated with indium (melting point 429.75 K, ∆hf = 28.45 J/g) under a heat low of 10 K∙min
-1. The same
thermal program was used for the baseline, reference material of a sapphire disk of 3 mm (Archer, 1993), and ASPPS samples of approximately 5 μL. They were maintained isothermal at 273.13 K for 4 min, heat low of 10 K∙min-1 until reaching 333.13 K and isothermal for 4
θ
SS P
W
D
c
=
where D
S is the vertical displacement between the sample
and reference material curves at a given temperature (mW),
W
S is the sample weight (mg), and θ the heat low (K∙s -1).
Determination of the acoustic ields
Experimental procedures were realized in the ASPPS at biomass concentrations from 4 to12% using an ultrasound UP400S (Hielscher Ultrasonics GmbH, Germany). This equipment has a titanium sonotrode with diameter of 22 mm (model H40, Hielscher Ultrasonics GmbH, Germany), and operates at 24 kHz of frequency and maximum
nominal input power of 400 W. The applied input power by the transducer could be modiied from 0 to 100%.
Acoustic ield determinations were carried out in a stainless steel chamber (with approximately 2.5 kg of liquid), starting at a temperature of 26 ± 0.1 °C. The calorimetric method was used in this research due to the sensitivity of the thermocouple to record the temperature in biomass solutions with minimal interference in the measurements (Moholkar et al., 2000; Raso et al., 1999). A type J thermocouple was connected to a data acquisition system (LabView 2010, National Instruments, USA) and placed at 2 cm from the sonotrode, where the maximum intensity was veriied by a model TC4014 hydrophone (Teledyne Reson A/S, Slangerup, Denmark). The system, exempliied in Figure 1, recorded the temperature changes over the 225 s of ultrasound application.
Once the temperature gradient data were obtained, the real power absorbed by ASPPS and the acoustic intensity transferred by the sonotrode were calculated using Equations (2) and (3), respectively.
p
dT
P
mc
dt
=
(2)P I
A
= (3)
In Equations (2) and (3), P is the real power absorbed at a determined position of the sonotrode (W), cp is the speciic heat of ASPPS (J·kg-1·K-1), m is the mass of liquid
measured for each experiment (kg), dT/dt is the temperature gradient along time registered by the data acquisition
system (K·s-1), I is the acoustic intensity (W·cm-2) and A is
the sonotrode tip area (cm2) (Raso et al., 1999).
Statistical analysis
Mathematical modeling was carried out using linear and non-linear models as a function of the signiicant variables through the software OriginPro 8.0 (OriginLab Corporation, Northampton, USA). Statistical analyses involving analysis of variance were done using the software STATISTICA 10.0 (StatSoft Enterprise, Tulsa, USA). The inluence of each variable on the response, as well as the interactions between them, was evaluated with a 95% conidence interval. Estimated efects were useful to predict an equation involving the signiicant terms that (1)
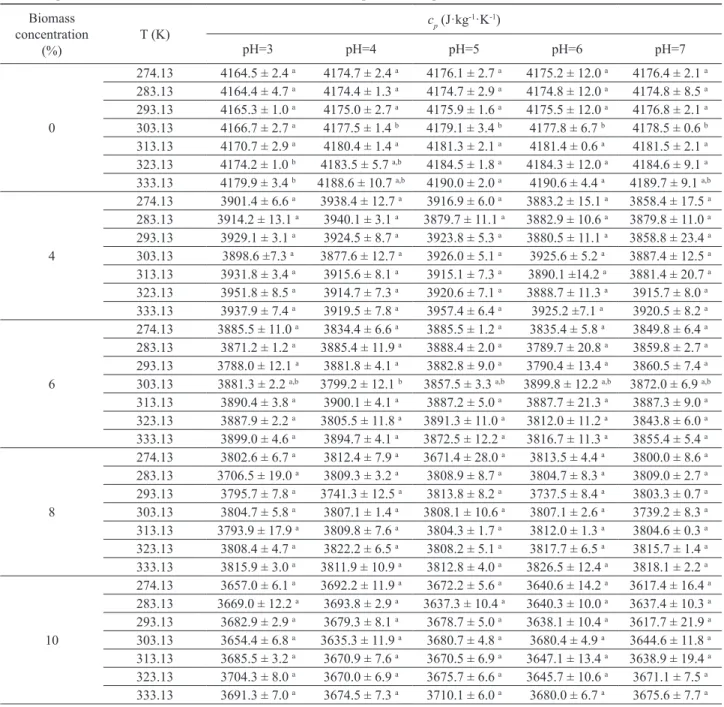
Table 1. Speciic heat values at diferent solids concentrations, temperature and pH. Biomass
concentration (%)
T (K)
cp (J·kg-1·K-1)
pH=3 pH=4 pH=5 pH=6 pH=7
0
274.13 4164.5 ± 2.4 a 4174.7 ± 2.4 a 4176.1 ± 2.7 a 4175.2 ± 12.0 a 4176.4 ± 2.1 a 283.13 4164.4 ± 4.7 a 4174.4 ± 1.3 a 4174.7 ± 2.9 a 4174.8 ± 12.0 a 4174.8 ± 8.5 a 293.13 4165.3 ± 1.0 a 4175.0 ± 2.7 a 4175.9 ± 1.6 a 4175.5 ± 12.0 a 4176.8 ± 2.1 a 303.13 4166.7 ± 2.7 a 4177.5 ± 1.4 b 4179.1 ± 3.4 b 4177.8 ± 6.7 b 4178.5 ± 0.6 b 313.13 4170.7 ± 2.9 a 4180.4 ± 1.4 a 4181.3 ± 2.1 a 4181.4 ± 0.6 a 4181.5 ± 2.1 a 323.13 4174.2 ± 1.0 b 4183.5 ± 5.7 a,b 4184.5 ± 1.8 a 4184.3 ± 12.0 a 4184.6 ± 9.1 a 333.13 4179.9 ± 3.4 b 4188.6 ± 10.7 a,b 4190.0 ± 2.0 a 4190.6 ± 4.4 a 4189.7 ± 9.1 a,b
4
274.13 3901.4 ± 6.6 a 3938.4 ± 12.7 a 3916.9 ± 6.0 a 3883.2 ± 15.1 a 3858.4 ± 17.5 a 283.13 3914.2 ± 13.1 a 3940.1 ± 3.1 a 3879.7 ± 11.1 a 3882.9 ± 10.6 a 3879.8 ± 11.0 a 293.13 3929.1 ± 3.1 a 3924.5 ± 8.7 a 3923.8 ± 5.3 a 3880.5 ± 11.1 a 3858.8 ± 23.4 a 303.13 3898.6 ±7.3 a 3877.6 ± 12.7 a 3926.0 ± 5.1 a 3925.6 ± 5.2 a 3887.4 ± 12.5 a 313.13 3931.8 ± 3.4 a 3915.6 ± 8.1 a 3915.1 ± 7.3 a 3890.1 ±14.2 a 3881.4 ± 20.7 a 323.13 3951.8 ± 8.5 a 3914.7 ± 7.3 a 3920.6 ± 7.1 a 3888.7 ± 11.3 a 3915.7 ± 8.0 a 333.13 3937.9 ± 7.4 a 3919.5 ± 7.8 a 3957.4 ± 6.4 a 3925.2 ±7.1 a 3920.5 ± 8.2 a
6
274.13 3885.5 ± 11.0 a 3834.4 ± 6.6 a 3885.5 ± 1.2 a 3835.4 ± 5.8 a 3849.8 ± 6.4 a 283.13 3871.2 ± 1.2 a 3885.4 ± 11.9 a 3888.4 ± 2.0 a 3789.7 ± 20.8 a 3859.8 ± 2.7 a 293.13 3788.0 ± 12.1 a 3881.8 ± 4.1 a 3882.8 ± 9.0 a 3790.4 ± 13.4 a 3860.5 ± 7.4 a 303.13 3881.3 ± 2.2 a,b 3799.2 ± 12.1 b 3857.5 ± 3.3 a,b 3899.8 ± 12.2 a,b 3872.0 ± 6.9 a,b 313.13 3890.4 ± 3.8 a 3900.1 ± 4.1 a 3887.2 ± 5.0 a 3887.7 ± 21.3 a 3887.3 ± 9.0 a 323.13 3887.9 ± 2.2 a 3805.5 ± 11.8 a 3891.3 ± 11.0 a 3812.0 ± 11.2 a 3843.8 ± 6.0 a 333.13 3899.0 ± 4.6 a 3894.7 ± 4.1 a 3872.5 ± 12.2 a 3816.7 ± 11.3 a 3855.4 ± 5.4 a
8
274.13 3802.6 ± 6.7 a 3812.4 ± 7.9 a 3671.4 ± 28.0 a 3813.5 ± 4.4 a 3800.0 ± 8.6 a 283.13 3706.5 ± 19.0 a 3809.3 ± 3.2 a 3808.9 ± 8.7 a 3804.7 ± 8.3 a 3809.0 ± 2.7 a 293.13 3795.7 ± 7.8 a 3741.3 ± 12.5 a 3813.8 ± 8.2 a 3737.5 ± 8.4 a 3803.3 ± 0.7 a 303.13 3804.7 ± 5.8 a 3807.1 ± 1.4 a 3808.1 ± 10.6 a 3807.1 ± 2.6 a 3739.2 ± 8.3 a 313.13 3793.9 ± 17.9 a 3809.8 ± 7.6 a 3804.3 ± 1.7 a 3812.0 ± 1.3 a 3804.6 ± 0.3 a 323.13 3808.4 ± 4.7 a 3822.2 ± 6.5 a 3808.2 ± 5.1 a 3817.7 ± 6.5 a 3815.7 ± 1.4 a 333.13 3815.9 ± 3.0 a 3811.9 ± 10.9 a 3812.8 ± 4.0 a 3826.5 ± 12.4 a 3818.1 ± 2.2 a
10
274.13 3657.0 ± 6.1 a 3692.2 ± 11.9 a 3672.2 ± 5.6 a 3640.6 ± 14.2 a 3617.4 ± 16.4 a 283.13 3669.0 ± 12.2 a 3693.8 ± 2.9 a 3637.3 ± 10.4 a 3640.3 ± 10.0 a 3637.4 ± 10.3 a 293.13 3682.9 ± 2.9 a 3679.3 ± 8.1 a 3678.7 ± 5.0 a 3638.1 ± 10.4 a 3617.7 ± 21.9 a 303.13 3654.4 ± 6.8 a 3635.3 ± 11.9 a 3680.7 ± 4.8 a 3680.4 ± 4.9 a 3644.6 ± 11.8 a 313.13 3685.5 ± 3.2 a 3670.9 ± 7.6 a 3670.5 ± 6.9 a 3647.1 ± 13.4 a 3638.9 ± 19.4 a 323.13 3704.3 ± 8.0 a 3670.0 ± 6.9 a 3675.7 ± 6.6 a 3645.7 ± 10.6 a 3671.1 ± 7.5 a 333.13 3691.3 ± 7.0 a 3674.5 ± 7.3 a 3710.1 ± 6.0 a 3680.0 ± 6.7 a 3675.6 ± 7.7 a inluenced the acoustical properties. Also, the adjusted
determination coeicient (R2
adj) and the mean relative
error (MRE) were used to evaluate the goodness of it and
accuracy of the estimation, respectively.
RESULTS AND DISCUSSION
Speciic heat and mathematical modeling
The speciic heat of the suspensions was determined as a function of solids concentration (0 – 12%), temperature (274.13 – 333.13 K) and pH (3 – 7), showing values in the range of 3537.0 to 4190.6 J·kg-1·K-1.These results
were similar to those reported for acidiied aqueous solutions with added lower stalk biomass (Villa-Vélez et al., 2015a), where a direct relationship of cp with biomass concentration and temperature was observed.
The cp of ASPPS showed a linear dependence on pH and temperature, while a quadratic dependence on solids concentration (pvalue< 0.05) was observed. A linear efect of
Table 1. Cont. Biomass concentration
(%)
T (K)
cp (J·kg-1·K-1)
pH=3 pH=4 pH=5 pH=6 pH=7
12
274.13 3642.9 ± 5.3 a 3610.2 ± 11.6 a 3590.6 ± 11.6 a 3559.7 ± 9.8 a 3537.0 ± 16.0 a 283.13 3593.2 ± 12.1 a 3611.8 ± 2.9 a 3556.5 ± 13.7 a 3559.4 ± 10.3 a 3556.6 ± 10.1 a 293.13 3625.3 ± 1.8 a 3597.5 ± 8.0 a 3597.0 ± 6.2 a 3557.3 ± 10.0 a 3537.3 ± 20.8 a 303.13 3619.3 ± 2.5 a 3554.5 ± 11.6 a 3599.0 ± 10.8 a 3598.6 ± 12.0 a 3563.6 ± 9.5 a 313.13 3647.5 ± 3.6 a 3589.3 ± 7.4 a 3589.0 ± 12.3 a 3566.1 ± 9.9 a 3558.1 ± 14.2 a 323.13 3639.1 ± 6.5 a 3588.5 ± 6.7 a 3594.0 ± 6.5 a 3564.7 ± 10.2 a 3589.5 ± 7.5 a 333.13 3659.7 ± 3.8 a 3573.9 ± 9.9 b 3627.7 ± 5.9 a,b 3598.2 ± 6.5 a,b 3593.9 ± 8.0 a,b
a,b Same letters in the same line represent no signiicant diference at the 95% level of conidence by a Tukey test.
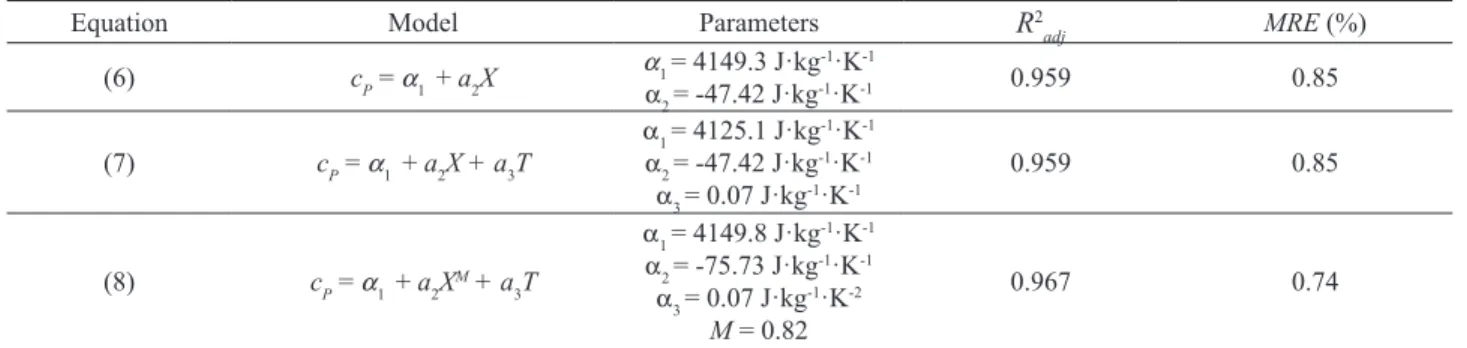
Table 2 presented the itting values of three selected models and their statistical parameters. In this modeling,
cp was correlated with temperature and biomass concentration and the pH term was excluded due to the absence of statistical signiicance. Higher values of cp were encountered for less concentrated suspensions since dry biomass has a lower speciic heat than water (Collazo et
al., 2012). Speciic heat as a function of multiple variables may be incorporated into the energy balance equation in order to predict the temperature proiles with great accuracy (Koufopanos et al., 1991). Similar equations were obtained for lignocellulosic waste materials, such as banana lower-stalk (Villa-Vélez et al., 2015a) and woods (Koufopanos et al., 1991).
Table 2. Fitting parameters of diferent models for the speciic heat (J·kg·K-1).
Equation Model Parameters R2
adj MRE (%)
(6) cP = a
1 + a2X
a
1= 4149.3 J·kg -1·K-1
a
2= -47.42 J·kg
-1·K-1 0.959 0.85
(7) cP = a
1 + a2X + a3T
a
1= 4125.1 J·kg -1·K-1
a
2= -47.42 J·kg -1·K-1
a
3= 0.07 J·kg -1·K-1
0.959 0.85
(8) cP = a
1 + a2X
M + a
3T
a
1= 4149.8 J·kg -1·K-1
a
2= -75.73 J·kg -1·K-1
a
3= 0.07 J·kg -1·K-2
M = 0.82
0.967 0.74
α1,α2,α3 and M are parameters of the models, T is the absolute temperature (K), X is the biomass concentration (%) and cp is the speciic heat (J·kg-1·K-1).
In general terms, the three models showed good and simple descriptions of the experimental data as functions of all parameters studied (R2
adj > 0.967). Although all
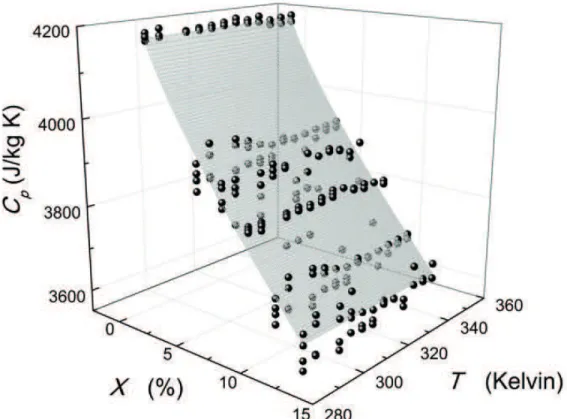
the parameters of the tested models were statistically signiicant, it is recommended the simplest equation that is in accordance with the analysis of variance. In this way, Equation 8 was selected among the three models to proceed with the acoustic ield calculation. The agreement between the experimental and calculated values for the cp can be seen in Figure 2.
Acoustic ields
Figure 2 - Representation of the speciic heat values itted to Equation (8).
Using dT/dt values calculated by linear regressions, the real power transmitted (P) and the acoustic intensity (I) as a function of the nominal power applied (U) from 80 to
320 W, biomass concentration (X) from 4 to 12% and pH from 3 to 7 were determined by Equations (2) and (3). The results are shown in Figure 4.
In Figure 4 (left), the measured power transmitted increased when an increase in nominal power was applied. The increases of biomass concentration showed a decrease in the power absorbed, similar to the speciic heat behavior. The values of acoustic power ranged from 5.12 to 260.2 W,
while acoustic intensity followed the same tendency, with values in the interval of 1.35 and 68.45 W·cm-², presented
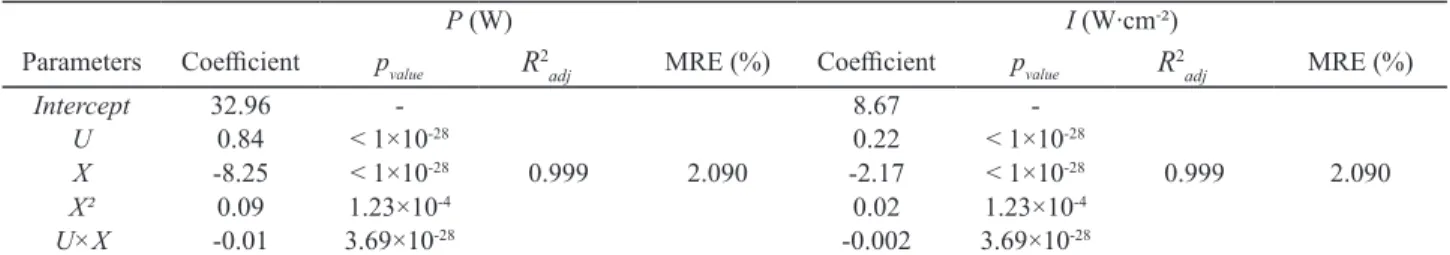
in Figure 4 (right). A non-linear equation was itted based on the signiicant parameters, and acoustic power (P) and acoustic intensity (I) could be expressed using the coeicients contained in Table 3.
Figure 4 - Power transmitted (P) and acoustic intensity (I) as a function of nominal power applied (U) and biomass concentration (X). Properties were determined at a distance of 2 cm from the sonotrode.
Table 3. Fitting results and statistical validation of acoustic power (P) and acoustic intensity (I) by ASPPS.
P (W) I (W∙cm-²)
Parameters Coeicient pvalue R2
adj MRE (%) Coeicient pvalue R
2
adj MRE (%)
Intercept 32.96
-0.999 2.090
8.67
-0.999 2.090
U 0.84 < 1×10-28 0.22 < 1×10-28
X -8.25 < 1×10-28 -2.17 < 1×10-28
X² 0.09 1.23×10⁻⁴ 0.02 1.23×10⁻⁴
U×X -0.01 3.69×10⁻²⁸ -0.002 3.69×10⁻²⁸
U is the nominal power applied (W), X is the biomass concentration (%) and pvalue is the probability of the factor F (IC = 95%).
Results from the analysis of variance showed that the acoustic power transmitted has a quadratic dependence on solids concentration (pvalue< 1×10-28) and linear dependence
on nominal power applied (pvalue< 1×10-28), with a linear
interaction between them. In a previous study, the acoustic powers were linearly correlated with input power. Such correlations are speciic for frequencies at 24 kHz and they can be useful to make sure that all ultrasonic devices are working well (Contamine et al., 1995). The efect of pH showed a linear dependence (pvalue = 0.05), indicating a weak efect when compared to the other variables. Acoustic power at diferent pHs had a mean deviation of 4% between values, demonstrating that the linear efect was almost a constant line. This fact allowed us to exclude the pH efect and consider only biomass concentration and
input power in the modeling.
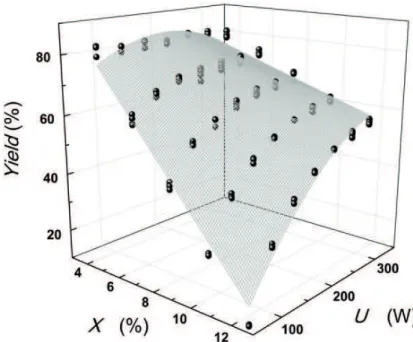
Eiciency of the ultrasound power transmitted
As known, not all nominal power applied is transferred to the system. Determination of the power yield (100* P/U) makes it necessary to evaluate how much energy is missing along each kind of process. These losses generally occur during electrical conversion into mechanical energy, where noise and thermal energy could be dissipated to the environment.
high yield could be justiied by the high yields obtained for ultrasound application using an apparatus with the sonotrode immersed instead of an ultrasonic bath (Kimura et al., 1996; Wu et al., 2001). In addition, the thermocouple was positioned where the maximum cavitation occurs (2 cm from the sonotrode).
On the other hand, a higher percentage of energy (93.6%) is lost for suspensions with higher content of biomass under low nominal applied power (80 W). The low yield could be attributed to the paste characteristics of biomass that ofer a mechanical resistance to the sonotrode in transforming small amounts of electrical energy into acoustic power.
Power yield data were plotted as a function of nominal applied power and solids concentration, as shown in Figure 5, and itted to a non-linear equation. The coeicients and statistical values of each signiicant variable are presented in Table 4. Similarly, a non-linear relationship was found by Cárcel et al. (2007b) when comparing the electrical energy supplied with the ultrasonic intensity. The necessity of correlating these variables is emphasized by Sivakumar and Pandit (2001), which conirms that the electrical input of an ultrasonic generator does not supply enough information about the ultrasonic power that promotes chemical transformations.
Table 4. Statistical and itting parameters to represent the power yield (%).
Power yield (%)
Parameters Coeicient pvalue R2
adj MRE (%)
Intercept 102.15
-0.977 6.410
U 0.12 < 1×10-28
U² -5.40×10⁻⁴ < 1×10-28
X -9.86 < 1×10-28
U×X 0.024 < 1×10-28
U is the nominal applied power (W), X is the biomass concentration (%) and pvalue is the probability of the factor F (IC = 95%).
Figure 5 - Power yield as a function of biomass concentration (%) and nominal applied power (W).
Although these results provide signiicant information regarding the acoustic ields at a local position, the procedures involved in this research can be adapted and applied to identify P and I for diferent positions from the
sonotrode, mapping the acoustic power at all chamber
CONCLUSIONS
This study reported data of the acoustic ields produced by ultrasound application to acidiied aqueous solutions of peanut waste. In order to evaluate the acoustic properties, the speciic heat was determined. This thermophysical property could be modeled as a function of solids concentration and absolute temperature, where the pH did not present signiicant efects. Lower values were encountered for more concentrated suspensions due to the lower capacity of storing energy of lignocellulosic material relative to pure water. Acoustic power and intensity data were calculated and itted according to the signiicant parameters of inluence. As these properties are a function of speciic heat, they follow the same behavior, being higher for less concentrated suspensions under higher input powers. Ultrasound application was demonstrated to be more eicient at low concentration and higher input power, showing a maximum power yield value of 82.7%. These conditions could maximize the hydrolysis and biomass pretreatment during sonication.
Finally, the determination of the maximum acoustic ield is an important step for designing and building acoustic processor systems. Data about acoustic ields in biomass suspensions make possible the development of sonication processes involving the bioconversion of renewable sources into second-generation ethanol.
ACKNOWLEDGEMENTS
The authors acknowledge the inancial support by the Sao Paulo Research Foundation - FAPESP (Grants number 2013/09344-4 and 2013/17497-5).
REFERENCES
Alvira, P., Tomás-Pejó, E., Ballesteros, M. and Negro, M. J., Pretreatment technologies for an eicient bioethanol production process based on enzymatic hydrolysis: A review. Bioresource Technology, 101 (13), 4851-4861 (2010).
Archer, D. G., Thermodynamic Properties of Synthetic Sapphire (α‐Al2O3), Standard Reference Material 720 and the Efect of Temperature‐Scale Diferences on Thermodynamic Properties. Journal of Physical and Chemical Reference Data, 22 (6), 1441-1453 (1993). ASTM-E1269, Standart test method for determining
speciic heat capacity by diferentail scanning calorimetry. ASTM Internacional, West Conshohocken (2005).
Cabrera, E., Muñoz, M. J., Martín, R., Caro, I., Curbelo, C. and Díaz, A. B., Alkaline and alkaline peroxide pretreatments at mild temperature to enhance enzymatic
hydrolysis of rice hulls and straw. Bioresource Technology, 167 (0), 1-7 (2014).
Cárcel, J. A., Benedito, J., Bon, J. and Mulet, A., High intensity ultrasound efects on meat brining. Meat Science, 76 (4), 611-619 (2007a).
Cárcel, J. A., Benedito, J., Rosselló, C. and Mulet, A., Inluence of ultrasound intensity on mass transfer in apple immersed in a sucrose solution. Journal of Food Engineering, 78 (2), 472-479 (2007b).
Castro, A. M. and Pereira-Jr, N., Production, properties and application of cellulases in the hydrolysis of agroindustrial residues. Química Nova, 33 (1), 181-188 (2010).
Collazo, J., Pazó, J. A., Granada, E., Saavedra, Á. and Eguía, P., Determination of the speciic heat of biomass materials and the combustion energy of coke by DSC analysis. Energy, 45 746-752 (2012).
Contamine, R. F., Wilhelm, A. M., Berlan, J. and Delmas, H., Power measurement in sonochemistry. Ultrasonics Sonochemistry, 2 (1), S43-S47 (1995).
Iida, Y., Yasui, K., Tuziuti, T. and Sivakumar, M., Sonochemistry and its dosimetry. Microchemical Journal, 80 (2), 159-164 (2005).
Jenderka, K. V. and Koch, C., Investigation of spatial distribution of sound ield parameters in ultrasound cleaning baths under the inluence of cavitation. Ultrasonics, 44 (0), 401-406 (2006).
Kanthale, P. M., Gogate, P. R., Pandit, A. B. and Wilhelm, A. M., Mapping of an ultrasonic horn: link primary and secondary efects of ultrasound. Ultrasonics Sonochemistry, 10 (6), 331-335 (2003).
Kimura, T., Sakamoto, T., Leveque, J. M., Sohmiya, H., Fujita, M., Ikeda, S. and Ando, T., Standardization of ultrasonic power for sonochemical reaction. Ultrasonics Sonochemistry, 3 (3), S157-S161 (1996).
Koufopanos, C. A., Papayannakos, N., Maschio, G. and Lucchesi, A., Modelling of the pyrolysis of biomass particles. Studies on kinetics, thermal and heat transfer efects. The Canadian Journal of Chemical Engineering, 69 (4), 907-915 (1991).
Kuijpers, M. W. A., Kemmere, M. F. and Keurentjes, J. T. F., Calorimetric study of the energy eiciency for ultrasound-induced radical formation. Ultrasonics, 40 (1–8), 675-678 (2002).
Lewin, P. A., Miniature piezoelectric polymer ultrasonic hydrophone probes. Ultrasonics, 19 (5), 213-216 (1981).
Margulis, M. A. and Margulis, I. M., Calorimetric method for measurement of acoustic power absorbed in a volume of a liquid. Ultrasonics Sonochemistry, 10 (6), 343-345 (2003).
McDonnell, C. K., Lyng, J. G., Arimi, J. M. and Allen, P., The acceleration of pork curing by power ultrasound: A pilot-scale production. Innovative Food Science & Emerging Technologies, 26 (0), 191-198 (2014). Moe, S. T., Janga, K. K., Hertzberg, T., Hägg, M. B., Øyaas,
K. and Dyrset, N., Sacchariication of Lignocellulosic Biomass for Biofuel and Bioreinery Applications – A Renaissance for the Concentrated Acid Hydrolysis? Energy Procedia, 20 (0), 50-58 (2012).
Moholkar, V. S., Sable, S. P. and Pandit, A. B., Mapping the cavitation intensity in an ultrasonic bath using the acoustic emission. AIChE Journal, 46 (4), 684-694 (2000).
Okajima, I. and Sako, T., Energy conversion of biomass with supercritical and subcritical water using large-scale plants. Journal of Bioscience and Bioengineering, 117 (1), 1-9 (2014).
Pingret, D., Fabiano-Tixier, A. S., Bourvellec, C. L., Renard, C. M. G. C. and Chemat, F., Lab and pilot-scale ultrasound-assisted water extraction of polyphenols from apple pomace. Journal of Food Engineering, 111 (1), 73-81 (2012).
Raso, J., Manas, P., Pagan, R. and Sala, F. J., Inluence of diferent factors on the output power transferred into medium by ultrasound. Ultrasonics Sonochemistry, 5 (4), 157-162 (1999).
Sivakumar, M. and Pandit, A. B., Ultrasound enhanced degradation of Rhodamine B: optimization with power density. Ultrasonics Sonochemistry, 8 (3), 233-240 (2001).
Toma, M., Fukutomi, S., Asakura, Y. and Koda, S., A calorimetric study of energy conversion eiciency of a sonochemical reactor at 500 kHz for organic solvents. Ultrasonics Sonochemistry, 18 (1), 197-208 (2011). Trabelsi, F., Ait-lyazidi, H., Berlan, J., Fabre, P. L., Delmas,
H. and Wilhelm, A. M., Electrochemical determination of the active zones in a high-frequency ultrasonic reactor. Ultrasonics Sonochemistry, 3 (2), S125-S130 (1996).
Villa-Vélez, H. A., Váquiro, H. A., Lopes-Filho, J. F., Telis, V. R. N. and Telis-Romero, J., Study of the speciic heat capacity of biomass from banana waste for application in the second-generation ethanol industry. Environmental Progress and Sustainable Energy, 34 (4), 1221-1228 (2015a).
Villa-Vélez, H. A., Váquiro, H. A. and Telis-Romero, J., The efect of power-ultrasound on the pretreatment of acidiied aqueous solutions of banana lower-stalk: Structural, chemical and statistical analysis. Industrial Crops and Products, 66 (0), 52-61 (2015b).
Wu, J., Lin, L. and Chau, F., Ultrasound-assisted extraction of ginseng saponins from ginseng roots and cultured ginseng cells. Ultrasonics Sonochemistry, 8 (4), 347-352 (2001).
Zeqiri, B., Hodnett, M. and Carroll, A. J., Studies of a novel sensor for assessing the spatial distribution of cavitation activity within ultrasonic cleaning vessels. Ultrasonics, 44 (1), 73-82 (2006).