Engineering
www.abeq.org.br/bjchePrinted in BrazilVol. 34, No. 02, pp. 459 - 468, April - June, 2017 dx.doi.org/10.1590/0104-6632.20170342s20150347
REAL TIME AND
IN SITU
NEAR-INFRARED
SPECTROSCOPY (NIRS) FOR QUANTITATIVE
MONITORING OF BIOMASS, GLUCOSE, ETHANOL
AND GLYCERINE CONCENTRATIONS IN AN
ALCOHOLIC FERMENTATION
R. J. A. do Nascimento
*, G. R. de Macedo, E. S. dos Santos
and J. A. de Oliveira
Biochemical Engineering Laboratory, Department of Chemical Engineering, Federal University of Rio Grande do Norte, Natal, Rio Grande do Norte, Brazil.
Phone: +55 84 3215 3769 (Ext. 214), Fax: +55 84 3215 3770
E-mail: [email protected], [email protected], [email protected], [email protected]
(Submitted: June 2, 2015; Revised: January 22, 2016; Accepted: March 15, 2016)
Abstract – This study investigates the application of NIR spectroscopy for real-time monitoring of process parameters in alcoholic fermentations. For this purpose, fermentation batches using Saccharomyces cerevisiae were carried out and monitored in situ by an immersed NIRS probe. Samples were collected throughout the fermentations, and concentrations of biomass, glucose, ethanol and glycerin were analyzed by reference methods and multivariate data analyses such as PCA and PLSR. PCA was used to investigate data variability and to select samples for calibration and for external validation sets. A PLSR model for biomass yielded R2 and RMSEP values
of 0.99 and 0.276 g.L-1, respectively. For glucose, the carbon source, the PLSR model yielded an R2 of 0.95 and
an RMSEP of 7.14 g.L-1.The PLSR model for ethanol was characterized by an R2 of 0.95 and an RMSEP of 0.06
g.L-1. For glycerin, a highly accurate PLSR model with an R2 of 0.98 and an RMSEP of 0.116 g.L-1 was obtained.
These results indicate that an in situ NIRS probe is suitable for real-time monitoring of important parameters in alcoholic fermentations.
Keywords: near-infrared spectroscopy; monitoring; alcoholic fermentation.
INTRODUCTION
Eicient real time monitoring of bioprocesses allows for improved process modeling and control (Schügerl, 2001), which can lead to increased process yield, productivity and reproducibility (Alves-Raush et al., 2014). Therefore, instrumentation capable of real-time monitoring is essential for bioprocess optimization.
The yeast Saccharomyces cerevisiae is the most frequently used microorganism for ethanol production in the energy and beverage industries. During fermentation, culture broth samples are routinely taken to monitor and
measure speciic process parameters. Physical parameters
such as temperature, pH, dissolved oxygen, liquid level and foam level are commonly monitored by on-line sensors (Tamburini et al., 2003), but critical process parameters
such as substrate consumption, cell concentration and inal product concentration are typically measured with of-line and time-consuming methods. Of-line measurements do
not allow process control to be implemented and reduce
process eiciency (Blanco et al., 2005).
Analytical spectrometry-based methods have been used to monitor ethanol fermentations (Blanco et al., 2004; Finn
fast and non-destructive. In addition, these methods allow simultaneous analysis of multiple parameters (Ferreira et al., 1999) without requiring sample pretreatment. Near-infrared spectroscopy (NIRS) is an important technique:
iber optic probes connected directly to the process enable
simultaneous real-time and in situ monitoring of several parameters quickly and safely. Although the NIR sensors are able to withstand sterilization procedures, they are severely disturbed by the bubbles generated in vigorously aerated and mixed processes (Alves-Rausch et al., 2014).
The NIR absorbance region corresponds to overtones and combinations of the fundamental vibrations of O-H, N-H and C-H bounds (Buratti et al., 2011). These characteristics result in spectra with broad and overlapping bands (Alves-Raush et al., 2014). First and second derivatives are used to “pretreat” NIR spectra to enhance
spectral features and to reduce baseline ofsets resulting
from light scattering due to increases in cell concentration (Tamburini et al., 2003).
NIR spectroscopy has been used to monitor microbial fermentations, and many studies have used NIR sensors
to monitor of-line and at-line. For at-line monitoring, the
sample is transported through an external line to the probe, where the measurement is performed at a sampling rate often inadequate for process control objectives (Blanco et al., 2004; Blanco et al., 2006; Finn et al., 2006; González-Sáiz et al., 2008; Fernandéz-Novales et al., 2008; Xie
et al., 2009; Burratti et al., 2001). Grassi et al. (2014)
used NIRS in of-line mode to monitor pH, biomass and
soluble solid content (Brix) in a wort fermentation. By
using of-line NIRS equipment, Grassi et al. required the use of centrifugation prior to analyses. Liang et al. (2013) reported the use of at-line NIRS to monitor glutamate, glucose, lactate and alanine concentrations in a glutamate fermentation. They concluded that it is feasible to use NIRS to determine compound concentrations in the fermentation industry. Studies using NIR spectroscopy to monitor analyte concentrations in fermentation with other microorganisms can be found in the literature (Crowley et al., 2005; Roychoudhury et al., 2006; González-Sáiz et al., 2008; Jiang et al., 2012; Liang et al., 2013). To date, the use of on-line NIR spectrophotometers to monitor alcoholic fermentations has been limited and has been described in
relatively few studies, especially compared to of-line and
at-line monitoring.
Other spectroscopic techniques have also been used to monitor bioprocesses. Fayolle et al. (2000) used mid-infrared spectroscopy (mid-IR) to monitor sugars, ethanol and organic acids concentrations on-line in alcoholic and lactic acid fermentations. They measured the contents of glucose, fructose, galactose, lactose, ethanol and lactic acid but reported that predictions of concentrations were not accurate enough to guarantee good on-line monitoring. Cozzolino et al. (2006) found that NIRS and visible spectroscopy, along with chemometrics, can be used
to monitor the progress of red wine fermentations. The authors concluded that visible and NIR spectroscopies provide good solutions to accurately monitor the progress of red wine fermentations without requiring any chemical analyses. NIRS and MIRS were used by Egidio et al.
(2010) to monitor the main chemical parameters in red wine
fermentations. The monitoring of the bioprocess was
of-line, and the authors concluded that NIRS and MIRS were able to measure the concentrations of red wine analytes such as glucose, fructose, ethanol, glycerol, total phenolics,
total anthocyanins and total lavonoids. Hakemeyer et al.
(2013) used NIRS and 2-D luorescence spectroscopy to
monitor the chemical composition of culture media during storage, concluding that both spectroscopic methods were able to predict chemical composition changes over time with good accuracy.
Multivariate techniques allow the use of spectral information both qualitatively and quantitatively (Alves-Raush et al., 2014). Quantitative multivariate analysis uses multilinear regression methods to relate a matrix X of NIRS data with a matrix Y of reference concentration data (Naes
et al., 2002). Partial least squares regression (PLSR) is a multilinear regression method that may be used to obtain quantitative calibration models from matrices X and Y. The models created by PLSR can be used to predict analyte concentrations in systems at lab or industrial scales.
The aim of the present study is to evaluate in situ NIRS monitoring of an alcoholic fermentation process using S. cerevisae. This study is also intended to develop predictive PLSR models for the quantitative prediction of glucose, biomass, ethanol and glycerine concentrations. The regression models developed here may be used for real-time bioprocess monitoring and control.
MATERIALS AND METHODS
Yeast and cultivation conditions
The Saccharomyces cerevisiae CAT-1 fermentec strain
was obtained from an Estivas® industrial plant located
in the Arês municipality in the state of Rio Grande do Norte, Brazil. The strain was maintained on Petri dishes containing YEPD medium at 4 °C with the following nutrient concentrations: 10 g/L of yeast extract, 20 g/L of peptone, 20 g/L of glucose and 15 g/L of agar.
Pre-inoculum: Pre-cultures of yeast cells were grown
in two 250-mL Erlenmeyer lasks containing 150 mL of
cultivation medium (in g L-1: glucose 30; yeast extract 5;
(NH4)2SO4 10; KH2PO4 4.5; MgSO4.7H2O 1; ZnSO4. 7H2O
0.65 and pH adjusted to 5.0). Each Erlenmeyer lask was
inoculated with Saccharomyces cerevisiae and incubated in a rotary incubator at 30ºC, 150 rpm for 20 h. After 20 h
of cultivation, the contents of the Erlenmeyer lasks were
the cells in each of the three lasks were resuspended in 50
mL of fresh, sterile medium. The resuspended cells (total volume of 150 mL) were transferred to a sterile inoculator
lask, forming the initial biomass used for fermentation
tests.
Bioreactor: Cultivations for ethanol production were performed in a BIOSTAT B® (B. Braun Biotech
International) reactor with a volumetric capacity of 2 L and a working volume of 1.65 L. The composition of the cultivation medium used was the same as the medium used for the pre-inoculum. The temperature was maintained at 30 °C. The pH setpoint was set at 5.0, and cultivation conditions were established to maintain an environment of restricted aerobiosis without aeration. Agitation was performed at 150 rpm.
Sampling
The samples used to build the calibration model were
obtained from ive diferent fermentations. Samples were
taken with a 10 mL plastic syringe connected to the bioreactor collection tube. Batch 1 was sampled every hour; the other batches were sampled every half hour. Each sample was divided into two aliquots. One aliquot was used to determine cell concentrations, and the second aliquot was divided into 2 mL Eppendorf® microcentrifuge
tubes. These microcentrifuge tubes were centrifuged for 15 min at 14,000 rcf in an Eppendorf centrifuge (model
5415 D). The supernatant was iltered through a 0.22 µm
PES membrane and frozen for later reference analysis of glucose, glycerine and ethanol concentrations by HPLC.
Reference Methods
HPLC - the levels of glucose, ethanol and glycerine were determined by HPLC (Shimadzu LC-10A series). Analyses were performed at 65 °C on a Shimadzu SCR-101H column with a refractive index detector (RID-10A). A 5 mmol.L-1 sulfuric acid solution was used as the mobile phase with a low rate of 0.6 mL.min-1.
UV Absorption - The absorbances of aliquots intended for cell concentration measurements were determined at 600 nm in a 10 UV Genesys spectrophotometer. Sample cell concentrations were determined from the absorbance data using a previously obtained linear regression equation.
NIR spectral measurements
NIR spectra of cultivation samples were acquired using a Thermo-Nicolet Antaris II FT-NIR spectrophotometer
equipped with a probe connected with optical iber cables. The translectance adapter is attached to the sensor,
enabling the optical path to be adjusted from 1.5 mm to 10 mm. In this study, the smallest optical path (1.5 mm) was used. The blank spectrum, which was used as a reference during calculation of sample absorbance values, was measured automatically using an internal white standard as the background spectrum. Spectral scans were performed over the entire NIR range (10000 to 4000 cm-1) with an
optical resolution of 8 cm-1. Each recorded spectrum was
the average of 64 scans, and each spectrum was stored
and processed with TQ ANALYST 8 (Thermo Scientiic).
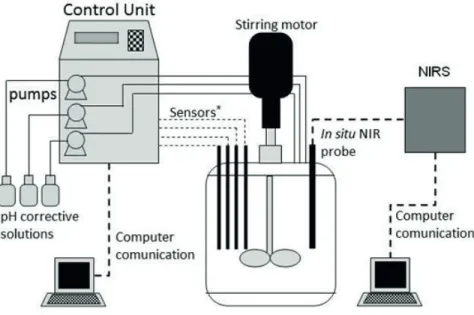
Chemometric analysis was performed using the same software package. In cultivations for ethanol production, the sensor was directly attached to the bioreactor, and spectra were acquired in real time. Figure 1 shows a schematic diagram of the bioreactor used in this study.
(
)
m 2
NIR REF
i i
i 1
PRESS
y
y
=
=
∑
−
2
1
(y
y
)
m NIR REF i i i
RMSE
m
=
−
=
∑
Data analysisIn highly aerated processes, air bubbles passing in front of the NIR probe take the place of the liquid sample, reducing the measured absorbance (Alves-Raush et al., 2014). Because alcoholic fermentations do not require
aeration, the use of spectral ilters to reduce the efect of air
bubbles was not necessary.
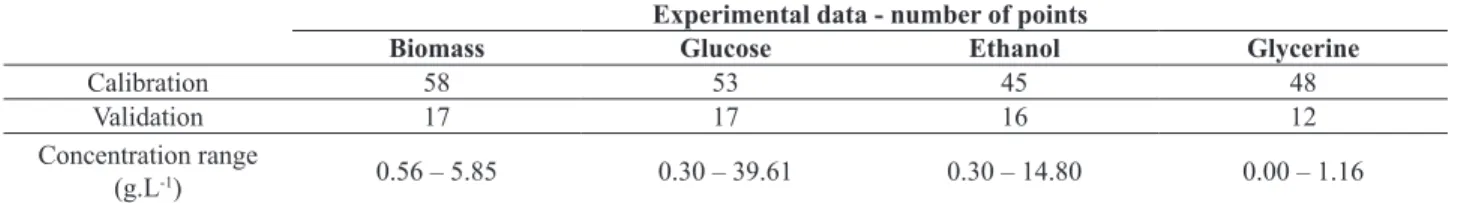
Five batches were monitored in situ, and samples
were taken for of-line reference analysis. Table 1 shows
the number of samples used to generate each calibration model as well as the respective concentration range of each model.
Principal Component Analysis (PCA) was used to investigate the total variability of samples and to select data for calibration and external validation sets. PCA is a multivariate analysis technique that aims to minimize
the original data dimensionality into a small number of variables called principal components. In the PCA score plot, observations that are closer to one another have similar characteristics (Cordella, 2012). Therefore, PCA is a useful tool for extracting information from data sets.
Calibration models were generated for glucose, ethanol, glycerin and cell density in TQ ANALYST 8 by applying PLSR to the spectral data and analyte reference concentrations. The PLS algorithm has been described in the literature (Geladi and Kowalsky, 1986; Svante, 1995; Naes et al., 2002) and determines the relationship between the X matrix (spectral data) and the Y matrix (reference analyte concentration). For model validation, a batch was chosen by PCA and kept out of the calibration process to be used as an external validation set. Table 1 shows the number of samples and the sample ranges used in the calibration models.
Table 1. Concentration range (g.L-1) and number of samples included in the calibration and external validation sets.
Experimental data - number of points
Biomass Glucose Ethanol Glycerine
Calibration 58 53 45 48
Validation 17 17 16 12
Concentration range
(g.L-1) 0.56 – 5.85 0.30 – 39.61 0.30 – 14.80 0.00 – 1.16
Calibration models were constructed using the “leave-one-out” cross-validation procedure. The optimal number of latent (factors) variables was determined by minimizing the sum of residual squared errors of prediction (PRESS), Eq. 1 (Randall, 1999; Blanco et al., 2004; Cofey and
Cooley, 1999) and minimizing the root mean squared errors of prediction (Eq. 2) obtained by external validation.
Where m is the number of samples, yREF is the value of
the reference concentration, and yNIR is the concentration
calculated by the NIRS calibration model.
The accuracies of the calibration models are expressed as the average root mean square error detailed in Eq. 2. These accuracies are referred to as RMSEC for calibration, RMSECV for cross-validation (internal validation) and RMSEP for external validation.
RESULTS
ANDDISCUSSION
Quantitative calibration models were generated for glucose, ethanol, glycerine and cell concentrations. On-line monitoring of these parameters provides valuable information, allowing the evolution of fermentations in industrial environments to be followed. The calibration models provide predicted values of parameters and may be used to implement control loops capable of reducing substrate feeds and increasing end-product quality and process yield.
To obtain robust models and to implement a real-time monitoring system for alcoholic fermentations, calibration and validation procedures were performed to identify the model that allows for the best quantitative analysis of biomass, substrate and product concentration. The chemometric approach was applied by using near-infrared spectroscopy and reference analytical techniques. The calibration procedure must guarantee that all variability in the process is captured, so the calibration set should include several batches to introduce inter-batch variability into the model. The external validation procedure consists of using a set of validation samples that do not belong to the calibration set. This method facilitates the evaluation of model robustness for predicting analyte concentrations in future fermentation batches. New spectra will be in the design space covered by the calibration procedure.
(1)
Sample spectra acquired with the NIR sensor are shown in Figure 2. It is noted that the spectra do not provide information in a clear manner, as NIR spectra are characterized by overlapping absorption bands and
light scattering diferences caused by increases in cell
concentration (Hall et al., 1996, Nishii et al., 2012). To enhance spectral features and to compensate for baseline
shifts and light scattering diferences, the original spectra
need to be subjected to pretreatments before being used to construct calibration models (Finn et al., 2006). The irst
and the second derivatives are used to solve the problem of overlapping peaks and to eliminate the baseline shift associated with increasing biomass concentration (Petersen
et al., 2009). The Savitzky-Golay smoothing ilter allows
the random noise to be reduced. Figure 3 illustrates the
spectra after pretreatment with irst and second derivatives.
Figure 2. NIRS acquired spectra for samples of all fermentations.
Figure 3. (a) NIR spectra of samples using irst derivative and Savitzky-Golay smoothing ilter; (b) NIR spectra of
samples using second derivative and Savitzky-Golay smoothing ilter.
To obtain an adequate model, it is important that calibration data include all of the variations observed throughout the process. In this study, the data from all fermentation samples were mean centered prior PCA, and a score plot was built (Figure 4) to determine which data
set was more signiicant for model calibration and which
data set could be used for external validation. With PCA,
it was possible to verify that the samples presented distinct characteristics throughout the bioprocess, including
diferences in changes in biomass, substrate, and product
any of the other batches, indicating that this batch contains samples with features distinct from the other batches. Therefore, batches 1 to 4 were used for model calibration. This data set contains the greatest number of samples
with diferent characteristics, increasing the variability
of the model prediction. Batch 5 was chosen for external validation, as this experimental run was a completely independent data set whose features were contained within the calibration data set.
Table 2. Calibration and validation results of PLS models for fermentation substrate and products using diferent pretreatments and
the smoothing ilter of Saviztky-Golay.
Analyte Pretreatment Filter Range
(cm-1) Factor
Calibration Cross Validation External Validation R2 RMSEC
(g.L-1) R
2 RMSECV
(g.L-1) R
2 RMSEP
(g.L-1) Bias
Biomass 1ª derivative SGa
5916.54-4389.19 7 0.992 0.230 0.978 0.376 0.983 0.276 - 0.10049
Glucose None SGa
7328.17-4130.78 9 0.955 3.52 0.920 4.65 0.940 7.14 7.04987
Ethanol 1ª derivative SGa
8261.55-4327.48 6 0.952 1.21 0.911 1.64 0.915 2.36 -2.70556
Glycerin 2ª derivative SGa
4454.76-4269.63 2 0.979 0.0759 0.970 0.0902 0.937 0.116 0.08553
a Savitzky-Golay smoothing ilter
Figure 4. PCA score plot of the calibration and external validation samples. The solid symbols denote calibration samples and the hollow symbols represent external validation samples.
TQ ANALYST 8 was used to select the regions of the spectra where spectral information either varied or correlated with changes in concentrations of the analyzed
compounds. The NIRS wavelength range inluences the
results of the calibration model. This is because only spectral information that changes or correlates with
The fermentations were planned to be performed under similar conditions. However, each experimental run was carried out independently. Initial concentrations of biomass
were inevitably diferent for each experimental run, and analyte concentrations evolved diferently throughout each fermentation. These diferences ensure that these data sets are diferent and independent. Furthermore, the samples
used for external validation were within the calibration range, but belonged to an independent batch that was not included in the calibration set.
To check the predictive ability of the models, an external validation was performed: new samples that did not belong to the calibration set were used to evaluate the previously obtained models.
Figure 5 shows the calibration and validation results for biomass, glucose, ethanol and glycerine. The calibration and validation values remained close to the line of perfect
correlation, indicating that analyte concentrations in the broth were modeled successfully. The concentrations of biomass, glucose, ethanol and glycerine predicted more
accurately when the Savitzky-Golay smoothing ilter was used, as the ilter was able to reduce the random noise
present in the spectra (Hongqiang and Hongzhang, 2008) and make the data easier to interpret.
The best model for biomass was obtained using a irst
derivative pretreatment and the Saviztky-Golay smoothing
ilter, with RMSEC and RMSEP values of 0.230 g.L-1 and
0.276 g.L-1, respectively. The RMSEP and RMSEC values
are very close, indicating that the obtained calibration model retained its predictive capability for the new samples not belonging to the calibration set. Gonzáles-Sáiz et al.
(2007) used NIR to monitor the alcoholic fermentation of onion juice, obtaining RMSEC and RMSEP values of 0.104 g.L-1 and 0.157 g.L-1, respectively.
Figure 5. PLS regression of predicted vs. actual concentration values of: (a.) Biomass, (b.) glucose, (c.) ethanol and (d.) glycerine. The results for the best models are plotted.
The best results for glucose and ethanol prediction were
obtained using the Savitzky-Golay smoothing ilter. The
best results for glucose prediction were obtained without pretreatment, while the best results for ethanol prediction
were obtained with a irst derivative pretreatment. For glucose, the correlation coeicient was approximately
0.96, and RMSEP and RMSEC values were 7.14 g.L-1 and
4.65 g.L-1, respectively. The calibration model obtained for
RMSEP value of 2.36 g.L-1. Meng-Lin et al. (2009) used
NIR to determine the ethanol concentration of an anaerobic H2-producing bioreactor eluent; RMSEC and RMSEP values for this model were 25.8 mg/L and 39.7 mg/L, respectively. These values are lower than the values for the model in this work, but the models generated by Meng-Lin
et al. (2009) were obtained with a large number of factors
and may be overitted. The fact that glucose and ethanol
absorb in the same region (Nishii et al., 2012) lowered the
prediction eiciency of these two analyte concentration
models (Arnold et al., 2003; Finn et al., 2006). Due to this overlap in absorption, many factors are required in the glucose and ethanol prediction models. This result may mean that the best approach for describing the dataset is to construct nonlinear models, as nonlinear models require a larger number of factors to describe the nonlinearities present in the dataset (Geladi and Kowalski, 1986).
The best model for glycerine was generated using a second derivative pretreatment and the Savitzky-Golay
smoothing ilter, with RMSEC and RMSEP values of 0.0759
g.L-1 and 0.116 g.L-1, respectively. The determination of
glycerol in fermentation broth has also been attempted by Hall et al. (1996), who reported a correlation coeicient
and standard error of prediction (SEP) of 0.996 and 2.1, respectively. Although Hall et al. (1996) reported a higher
coeicient of regression than this study, the authors also
reported a higher standard error of prediction.
Prediction
The calibration models were developed using data from batches 1 to 4 and batch 5 was used for external validation. Figure 6 shows the evolution of the fermentation batch used to validate the proposed models.
The fermentation process was monitored for 8 h. The graph shows the temporal evolution of glucose, ethanol, glycerine and biomass concentrations. Glucose concentration decreased throughout the process, as the microorganisms consume the sugars to produce ethanol, glycerine and additional biomass. Near infrared spectroscopy was able to monitor the fermentation process in real-time and in situ, but glucose and ethanol concentrations were poorly predicted at the end of the fermentation run, likely due to the fact that glucose and ethanol absorb in the same NIR region. This overlap in absorption lowers the model predictability. Despite this limitation, the glucose and ethanol models were able to follow analyte trajectories throughout the fermentation process. The models obtained for glycerin and biomass were adequate: for these two components; the predicted values were very close to those obtained via the reference method.
CONCLUSION
In alcoholic fermentation processes, the analyses required to monitor glucose, ethanol, glycerine and biomass concentrations are time-consuming and are performed
of-line in laboratories. In addition to requiring laborious
tasks, these methods are expensive and use reagents that can be detrimental to the environment. The objective of this study was to evaluate the real-time monitoring of important parameters in alcoholic fermentations using a near-infrared spectroscopy (NIRS) probe. Multivariate data analyses allowed spectra collected in real-time to be correlated with analyte concentrations obtained from reference methods. PCA allowed data to be selected for the calibration and external validation sets, and PLS
regression ensured appropriate model itting. In general,
the results demonstrated that an in situ NIRS probe is suitable for monitoring important parameters of alcoholic fermentations. Analysis time was reduced drastically, as an NIR spectrum can be acquired in less than 1 min. This fact supports the idea of real-time monitoring. It is important to highlight that a similar monitoring system may be scaled up for industrial bioreactors, and control strategies may be implemented to improve process conditions.
ACKNOWLEDGMENTS
The authors thank CAPES and CNPq for inancially
supporting this research.
REFERENCES
Alves-Rausch, J., Bienert, R., Grimm, C., Bergmaier, D., Real time in-line monitoring of large scale Bacillus
fermentations with near-infrared spectroscopy. J. Biotechnol., 189, 120-128 (2014).
Arnold, S. A., Crowley, J., Woods, N., Harvey, L. M., McNeil, B., In-situ Near Infrared Spectroscopy to Monitor Key Analytes in Mammalian Cell Cultivation. Biotechnol. Bioeng., 84, 13-19 (2003).
Blanco, M., Peinado, A. C., Mass, J., Analytical monitoring of alcoholic fermentation using NIR spectroscopy, Biotechnol. Bioeng., 88,536-542, (2004).
Blanco, M., Peinado, A. C., Mas, J., Elucidating the
composition proiles of alcoholic fermentations by use
of ALS methodology, Anal. Chim. Acta, 544, 199-205, (2005).
Blanco, M., Peinado, A. C., Mas, J., Monitoring alcoholic fermentation by joint use of soft and hard modelling methods, Anal. Chim. Acta, 556, 364-373, (2006). Burratti, S., Ballabio, D., Giovanelli, G., Dominguez, Z.,
Moles, A., Benedetti, S., Sinelli, N., Monitoring of alcoholic fermentation using near infrared and mid
infrared spectroscopies combined with electronic nose and electronic tongue, Anal. Chim. Acta, 697, 67-74, (2011).
Cofey, C.; Cooley, B. E. Jr.; Walker, D. S., Real time quantitation of a chemical reaction by iber optic
near-infrared spectroscopy. Anal. Chim. Acta., 395(3), 335-341 (1999).
Cordella, C. B. Y. (2012). PCA: The Basic Building Block of Chemometrics, Analytical Chemistry, Dr. Ira S. Krull (Ed.), InTech.
Cozzolino, D.; Parker, M.; Dambergs, R. G.; Herderich, M.; Gishen, M., Chemometrics and Visible-Near Infrared Spectroscopic Monitoring of Red Wine Fermentation in a Pilot Scale. Biotechnol. Bioeng., 95(6), 1101-1107 (2006).
Crowley, J., Arnold, S. A., Wood, N., Harvey, L. M., McNeil, B., Monitoring a high cell density recombinant
Pichia pastoris fed-batch bioprocess using transmission
and relectance near infrared spectroscopy. Enzyme
Microb. Tech., 36, 621-628 (2005).
Egidio, V. D,; Sinelli, N.; Giovanelli, G.; Moles, A.; Casiraghi, E., NIR and MIR spectroscopy as rapid methods to monitor red wine fermentation. Eur. Food Res. Technol. 230(6), 947-955 (2010).
Fayolle, Ph.; Picque, D.; Corrieu, G., On-line monitoring of fermentation processes by a new remote dispersive middle-infrared spectrometer. Food Control., 11, 291-296 (2000).
Fernandéz-Novales, J.; López, M. I.; Sánchez, M. T,; García, J. A.; Morales, J., A feasibility study on the
use of a miniature iber optic NIR spectrometer for
the prediction of volumic mass and reducing sugars in white wine fermentations. Journal of Food Engineering, 89(3), 325-329 (2008).
Ferreira, M. M. C., Antunes, A. M., Melgo, M. S., Volpe, P. L. O., Quimiometria I: calibração multivariada, um tutorial. Quim. Nova, 22, 724-731, (1999).
Filmozer, P., Liebmann, B., Varmuza, K., Repeated double cross validation. J. Chemom., 29, 160-171 (2009). Finn, B., Harvey, L. M., Mcneil, B., Near-infrared
spectroscopic monitoring of biomass, glucose, ethanol and protein content in a high cell density baker’s yeast fed-batch bioprocess, Yeast, 26, 507-517, (2006). Geladi, P., Kowalski, B. R., Partial least-squares regression:
a tutorial. Anal. Chim. Acta, 185, 1-17 (1986).
González-Sáiz, J. M.; Esteban-Díez, I.; Sánchez-Gallardo, C.; Pizarro, C., Monitoring of substrate and product concentrations in acetic fermentation processes for onion vinegar production by NIR spectroscopy: value addition to worthless onions. Anal. Bioanal. Chem., 391(8), 2937–2947 (2008).
M. J., Itoiz, R., Monitoring of Alcoholic Fermentation of Onion Juice by NIR Spectroscopy: Valorization of Worthless Onions. J. Agric. Food Chem, 55, 2930-2936 (2007).
Hall, J. W., McNeil, B., Rollins, M. J., Draper, I., Thompson, B. G., Macaloney, G., Near-Infrared Spectroscopic Determination of Acetate, Ammonium, Biomass, and Glycerol in an Industrial Escherichia coli Fermentation. Appl. Spectroscop., 50, 102-108 (1996). Hakemeyer, C.; Strauss, H.; Werz, S.; Folque, F.; Menezes,
J. C., Near-infrared and two-dimensional luorescence
spectroscopy monitoring of monoclonal antibody fermentation media quality: Aged media decreases cell growth. Biotechnol. J., 8, 835-846 (2013).
Hongqiang, L. & Hongzhang, C. Near-infrared
spectroscopy with a iber-optic probe for state variables
determination in solid-state fermentation. Process Biochem., 43(5), 511-516 (2008).
Jiang, H., Liu, G., Xiao, X., Mei, C., Ding, Y., Yu, S., Monitoring of solid-state fermentation of wheat straw in a pilot scale using FT-NIR spectroscopy and support vector data description. Microchem J., 102, 68-74 (2012).
Liang, J., Zhang, D., Guo, X., Xu, Q., Xie, X., Zhang, C., Bai, G., Xiao, X., Chen, N., At-line near-infrared spectroscopy for monitoring concentrations in temperature-triggered glutamate fermentation. Bioprocess Biosyst. Eng., 36, 1879-1887 (2013).
Meng-Lin, Z., Guo-Ping, S., Yang, M., Wei-Hua, L., Han-Qing, Y., Hideki, H., Yu-You, L., Rapid and accurate
determination of VFAs and ethanol in the eluent of an
anaerobic H2-producing bioreactor using near-infrared spectroscopy. Water Res., 43, 1823-1830 (2009). Naes, T., Isaksson, T., Fearn, T., Davies, T., Multicollinearity
and the need for data compression. In: Naes, T. editor. A User friendly guide to multivariate calibration and
classiication. Chichester, UK: NIR Publications, Chap.
4, 24-25 (2002).
Nishii, T. Genkawa, T., Watari, M., Ozaki, Y., Selection of
the NIR Region for a Regression Model of the Ethanol Concentration in Fermentation Process by an Online NIR and Mid-IR Dual-Region Spectrometer and 2D Heterospectral Correlation Spectroscopy. Anal Sci., 28, 1165-1170 (2012).
Petersen, A. E. C., Petersen, N., Lantz, A. E., Larsen, A., Gernaey, K. V. Application of near-infrared spectroscopy for monitoring and control of cell culture and fermentation. Biotechnol. Progr., 25(6), 1561-1581 (2009).
Randall, T. D., An introduction to partial least squares regression. SAS institute, 1-8 (1999).
Rocha, M. V. P., Produção de bioetanol a partir de pedúnculo de caju (Anacardium occidentale L.) por fermentação submersa, D.Sc. Thesis, Federal University of Rio Grande do Norte (2010).
Roychoudhury, P., Harvey, L. M., McNeil, B., At-line monitoring of ammonium, glucose, methyl oleate and biomass in a complex antibiotic fermentation process
using attenuated total relectance-mid-infrared
(ATR-MIR) spectroscopy. Anal. Chim. Acta, 561, 218-224 (2006).
Svante W., Chemometrics; what do we mean with it, and what do we want from it?. Chemometr Intell Lab., 30, 109-115 (1995).
Schügerl, K., Progress in monitoring, modeling and control of bioprocesses during the last 20 years. J. Biotechnol., 85, 149-173 (2001).
Tamburini, E., Vaccari, G., Tosi, S., Trilli, A., Near-Infrared Spectroscopy: A Tool for Monitoring Submerged Fermentation Processes Using an Immersion Optical-Fiber Probe. Appl. Spectrosc., 57(2), 132-138 (2003). Tamburini, E., Vaccari, G., Tosi, S., Trilli, A., Near-Infrared
Spectroscopy: A Tool for Monitoring Submerged Fermentation Processes Using an Immersion Optical-Fiber Probe. Appl. Spectrosc., 57(2), 132-138 (2003).
Xie, L., Ye, X., Liu, D., Ying, Y. Quantiication of glucose,