Efficiency in the Romanian Banking
System: An Application of Data
Envelopment Analysis
Author*: Mihai NIŢOI
bstract: The paper analyzes the efficiency and productivity of the Romanian banks from 2006-08. It uses a non-parametric approach, the data envelopment analysis (DEA) to analyze banks’ efficiency. Based on a sample of 15 commercial banks, our findings reveal that although the efficiency of the Romanian commercial banks improved since 2006, the cost efficiency scores are relatively low. Also, even if in 2007 the total factor productivity increased, in 2008 this score of the average productivity of banks decreased.
Key words: bank performance, cost efficiency, productivity, data envelopment analysis, Malmquist Index
JEL Classification: C23, D24, G21, L25
1. Introduction
The banking sector is particularly important for the stability of financial systems. The essential role of a financial system is that of the efficient allocation of national savings for investments. The financial system must ensure the exploitation of the possibilities for diversification, as well as the possibility to achieve a compromise, from the macroeconomic point of view, between reward and risk in terms of capital allocation.
* Mihai Niţoi, Ph.D. scholarships of the University of Craiova, Faculty of Economics and Business Administration, through the project POSDRU/6/1.5/S/14 “Increase the attractiveness, quality and efficiency of university doctoral studies by doctoral scholarships”; e-mail: [email protected].
Financial system stability is of crucial importance not only for the overall economic development but also for the effectiveness of central bank monetary policy. Given that the banks (especially in Romania) represent a key element of the financial system, the state of the economy and the structure of the banking system are closely related to the stability of the financial system. A banking market structured competitively, by allocating in a more efficient way the capital in economy, tends to support welfare. The various problems regarding the asymmetric information of the banking activities can be intensified both at a low level, and also at a high level of competition and can have a destabilizing effect on the overall system.
Since the fourth quarter of 2008, the economic outlook in the European Union has deteriorated substantially. This was confirmed by a significant broad-based weakening of EU economic activity that took place in the first quarter of 2009, characterized by a contraction of domestic demand and a significant decline in trade volumes. Despite signs that the pace of the economic contraction may be moderating, the outlook for the EU economy continues to be surrounded by a high degree of uncertainty. Both global and EU domestic demand are expected to decline further in 2009, and to recover only gradually in the course of 2010, which may impose further strains on the credit quality of EU banks’ loan portfolios.
Information obtained from recent bank lending surveys across the EU suggests that the tightening of credit standards for new loans to households and, in particular, the non-financial corporate sector, while less severe than that recorded in previous quarters, was still substantial. This revision of the loan standards can have a positive impact on the banks, especially on the credit risk exposure. On the other hand, in the current conditions, tight lending policies might pose additional risks to banks by contributing to a protraction of the economic downturn.
expansion of operations) and the start of a difficult period, marked by the international financial and economic crisis, as well as by uncertainties regarding the future of the national economy. Romanian banks had last year the largest incomes from interests and commissions as a percent of total assets, but also the largest return on equity rate in the entire European Union space. According to the information published in an ECB90 report, return on equity rate was 29.5%
in the Romanian banking system, almost double compared to the average of the European Union members in Central and Eastern Europe. However, these data are not entirely comparable, because of the different standards, and, on the other hand, they must be correlated with the risk exposure.
It is to be expected that the profitability of local banks decrease considerably this year because of the increase of expenses with loan provisions and following a decreased activity on the credit market. As the banking sector is the major sector that contributes to the financing of national economy, the efficiency of commercial banks is one of the most interesting and important issues for both government and the private sector. That is why we intend to analyze the efficiency and productivity of the Romanian commercial banks using the data envelopment technique.
2. Literature review
The efficiency of the banking sector is one of the most important aspects for economists worldwide. In support of this statement are numerous studies which aim at performance analysis of commercial banks. Although there are numerous modalities for the study of the efficiency of commercial banks, Data Envelopment Analysis is the most popular in literature. DEA is a linear programming model which measures the relative efficiency of decision units. The purpose of this technique is to generate indicators that reflect more completely and adequately performance in the banking sector, and not only. Thus, initially, the method involves specifying a model to define the most important inputs and outputs for a commercial bank. Then data on inputs and outputs are collected and through linear programming the efficiency frontier is estimated. Depending on how each bank places itself as opposed to this frontier, the efficiency score is determined.
Numerous applications of DEA have appeared in the bank performance literature, for example, only for the United States there are over 40 such studies. Also, there are studies that made a comparison between countries. The following is a brief review of the most recent studies about using DEA in measuring
commercial banks’ performance. For instance, Casu and Molyneux (2000) employed the DEA approach to investigate the efficiency in European banking systems. They attempted to examine whether the productive efficiency of European banking systems has improved and converged towards a common European frontier, following the process of EU legislative harmonization. Noulas (2001) studied the effect of banking deregulation on private and public-owned banks by using Data Envelopment Analysis. The results showed that the private banks were more efficient than the public-owned, although the gap between levels of efficiency is not relevant from a statistical viewpoint. Barr et al. (2002) evaluated the productive efficiency of U.S. commercial banks. Study results revealed a close interdependence between efficiency and independent measures of performance, including confidential ratings made by bank examiners. Jemric (2002) investigated the efficiency of banks in Croatia. The main results showed that foreign banks are, on average, the most efficient; also banks that recently entered the market are more efficient than those operating for a long time. Also, small banks are more efficient than large ones. Wu (2005) examined productivity and efficiency of banks in Australia during 1983-2001. The main results reported that efficiency increased in times of deregulation. Loukoianova (2008) made a comparison of the banking sectors in Western Europe, the U.S. and Japan depending on the specialization of banks.
3. Methodology
The DEA methodology is based on information on inputs and outputs of individual entities to construct an efficiency frontier enveloping the data. The model chooses a benchmark entity, which lies on this frontier, and measures the efficiency of other individual entities relative to the benchmark entity. Two alternative approaches are available in DEA to estimate the efficiency frontier. One is input-oriented, and the other is output-oriented. In the input-oriented model, the inputs are minimized and the outputs are kept at their current levels. In the output-oriented model, the outputs are maximized and the inputs are kept at their current level.
3.1. The Basic Input-Oriented DEA Problem
The basic input-oriented DEA problem can be described as follows91. Assume
there are data on K inputs and M outputs for each banks, indexed by i=1,...,N.
Let xij denote input i of bank j; and yij denote output i of bank j. Under the assumption of constant return to scale (CRS), the basic DEA problem to estimate the relative efficiency of each bank is given by:
min
φ
j i
λ
θ
,subject to
∑
=
≤
N
j
i ij jx
1
θ
λ
i = 1...K∑
=
≥
N
j
r ij jy y
1
0
λ r = 1...M
∑
=
=
N
j j
1
1
λ
0
≥
j
λ
(1)Where a bank with a subscript “zero” is one of the banks under evaluation, and xi0 and yr0 are the i-th input and r-th output of “zero”-bank, respectively.
θ
i is a bank-specific scalar that varies between zero and one and conveys the efficiency score of bank i (i.e. the distance between its input-output mix and the frontier, measured through a ray from the origin). Banks withθ
i= 1 are benchmark institutions, and their input-output mix lies on the efficient frontier. The λj is an Nx1 vector of bank-specific weights that conveys information on the benchmark comparators for bank i. For example, an efficient bank (θ
i= 1) will be trivially itsown benchmark, resulting in
λ
j with zeros everywhere except a “one” in the i-thposition. An inefficient bank will have
θ
i< 1.1 is an Nx1 vector of ones. The VRS model produces a convex hull of intersecting planes that envelope the data more tightly than the CRS model and thus tends to produce generally higher estimates of efficiency.
The concept of total cost efficiency consists of technical efficiency and allocative efficiency and its measurement can be illustrated as in Figure 1.
Figure 1
Source: Coelli, T., Rao, D.S.P., O’donnell, C.J., and Battese, G.E. (2005), An introduction to efficiency and productivity analysis, New York: Springer Press.
Technical efficiency can be measured as follows. Consider a firm producing a single output y with two inputs x1 and x2 with the input-output combination represented by point a. To facilitate the presentation, assume further that the technology is CRA, represented by isoquant I. Clearly, the input-output mix given by point a is inefficient, as it lies inside the production frontier entailed by the isoquant. A measure of the technical inefficiency can be given by the distance ab, which measures the amount by which the two inputs could be proportionally reduced without affecting output. Alternatively, technical inefficiency can be normalized using the ratio ab/a0 and represented by its complement TE = 1 – ab/a0=b0/a0. The resulting measure, which is commonly used, varies from zero to one, with a larger value indicating higher technical efficiency. In particular, a
a
I
x1/y x2/y
W
-w1/w2
b d
c
value of one indicates that a specific input-output combination lies on the efficient isoquant.
Allocative efficiency can be assessed if information on input prices is available. Suppose input prices in the example are given by w1 and w2 and represented by the isocost line W. At the relative input prices, the cost-minimizing input mix is given by point d. Therefore, the technical efficiency point b entails an excess cost equivalent to the distance bc, and the relative measure of this allocative inefficiency is given by the ratio AE=c0/b0.
Thus, total cost efficiency (CE) can be defined as the product of technical and allocative efficiency:
CE = TE AE
a b b c a c
× = × =
0 0 0 0 0 0
(2)
These three measures are bounded by zero and one, where higher values imply a higher efficiency. Further, they can be readily interpreted as percent deviations. For example, a value of economic efficiency score of 0.8 implies a gap of 0.2, or that the bank is 20 percent less efficient than its benchmark comparator.
3.2. Measure of Total Factor Productivity – An Output-Oriented Malmquist Index
Total factor productivity can be assessed using an output-oriented Malmquist index92. Assume that for each time period t=1,...,T, banks produce an observed
vector of M non-negative outputs, yt= (y1t,..., yMt ), using N non-negative
inputs, x t=(x1t,...,xNt), using an unobserved, possibly time-variant, production technology,
S = {(xt,yt)|xt can produce yt}, t = 1,……,T (3)
By assumption, output set St satisfies usual regularity conditions, i.e. it is closed, bounded, convex, and satisfies strong disposability of outputs. This allows us to construct a well-defined output distance function,
Dt(xt,yt) = inf {θ i|(xt,yt /
θ
i)∈St} (4)
In other words, Dt measures the distance between the observed output of each
bank at time t and the maximum output attainable with the observed input mix, given the technology available at time t. Notice that Dt(xt,yt)=1if and only if the observed input-output combination observed at time t lies at the boundaries of the technology frontier available at time t, otherwise, Dt(xt,yt)<1.
Three additional distance functions, Dt(xt+1,yt+1), Dt+1(xt,yt)and Dt+1(xt+1,yt+1)are defined in a similar way, either by re-dating the variables or by re-dating the technology, although in the first two cases, the resulting distances may exceed one (i.e. the observed input-output combinations may lie above the production set of the other period).
An output-oriented Malmquist productivity index can be expressed as:
M 2 1 1 1 1 1 1 1 1 1 1 1 ) , ( ) , ( ) , ( ) , ( ) , ( ) , ( ⎥ ⎦ ⎤ ⎢ ⎣ ⎡ × × = + + + + + + + + + + t t t t t t t t t t t t t t t t t t t y x D y x D y x D y x D y x D y x D (5)
where the first term measures the change in relative efficiency between the two time periods (i.e. the catching up effect), while the term in square brackets measures the technical change (i.e. the evolution of the production frontier). The term under square brackets is a geometric mean of the distances between the two production functions, measuring the distances through the observed input-output combinations. A value of the index greater (less) than one means an improvement (deterioration) of productivity. Those readers seeking more technical detail, such as the specifics of the linear programs that DEA uses to generate the frontier, we refer to excellent sources such as Coelli et al. (2005).
4. Data and variables
output. Hancock (1991) stated that it is not clear ex ante whether monetary goods are inputs or outputs in the first approach. It states that, in case that the financial returns on an asset exceed the opportunity cost of funds (or the financial cost of a liability is less than the opportunity cost), then the instrument is considered to be a financial output. Otherwise, it is considered to be an input. In a third approach, based on value added, both liabilities and assets are regarded as having the characteristics of outputs. Correspondingly, only those categories that have a substantial added value are treated as outputs.
In our analysis, the choice of inputs and outputs followed the bank intermediation approach, which assumes that banks intermediate funds between depositors and borrowers at the lowest possible cost. Banks accumulate funds, such as deposits or other borrowed funds from money market, and in combination with other inputs, such as labor or capital, transform them into outputs such as loans or other earning assets. Here, the framework assumes that banks use three inputs to produce three outputs. The outputs consist of (i) loans, (ii) other earning assets, and (iii) core operating profit. The first two represent a considerable part of banks’ assets and are customary to the literature. The third, core operating profit is justified by the recent emphasis on the improving profitability of the Romanian banks. The inputs include: (i) deposits and other borrowed funds, (ii) number of employees, and (iii) number of bank branches. Deposits affect bank profitability, and bank branches are a proxy for measuring banks’ distribution network. Input prices were estimated by dividing (i) interest expenses by the amount of total deposits and other borrowed funds, (ii) total personnel expenses by the number of employees, and (iii) other general and administrative and general expenses by the number of bank branches (Table 1).
Table 1
Description of the DEA model used for analyzing Romanian banking market
Outputs Inputs Input prices
Loans X1 – Deposits and other
borrowed funds Interest expenses/X1 Other earning assets X2 – Number of employees Personnel expenses/X2 Core operating profit X3 – Number of bank branches Other administrative and general expenses/X3
held by the banks included in the study represent more than 90% of the total assets held by the Romanian banks, and, therefore, we consider this study relevant. We estimate the model assuming variable returns to scale (VRS) and constant return to scale (CRS). If the VRS option is applied, the efficiency scores of banks are higher, in this model banks are benchmarked against a bank of similar size. With the CRS option, banks are compared overall, not taking into consideration the account sizes. The following banks are included in the study:
Table 2
Banks included in the study
1. Banca Comercială Română (BCR)
6. Banca Transilvania (BT)
11. Banca Românească
2. BRD – Groupe Société Générale
7. Alpha Bank 12. OTP Bank
3. Raiffeisen Bank 8. Bancpost 13. MKB Romexterra Bank 4. Volksbank 9. CEC Bank 14. Intesa Sanpaolo Bank 5. UniCredit Tiriac Bank 10. Credit Europe Bank 15. Banca Comercială
Carpatica (BCC)
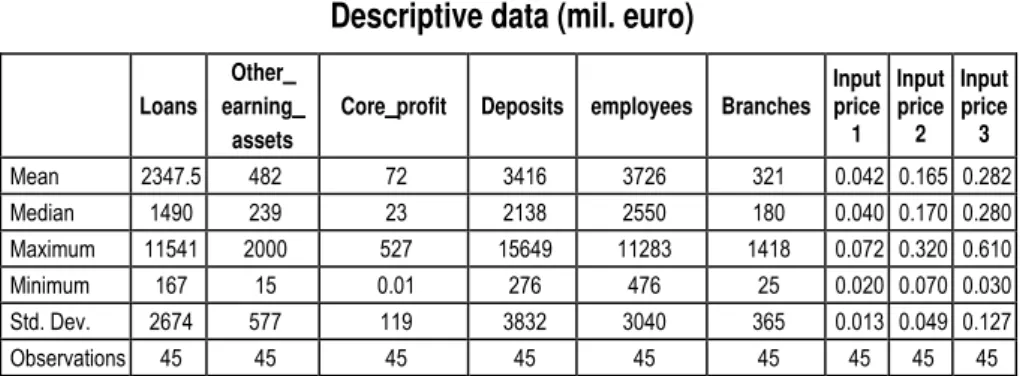
Descriptive data for the variables in our model pertaining to the banks in the sample are presented in Table 3.
Table 3
Descriptive data (mil. euro)
Loans Other_ earning_
assets
Core_profit Deposits employees Branches Input price 1
Input price 2
Input price 3
Mean 2347.5 482 72 3416 3726 321 0.042 0.165 0.282 Median 1490 239 23 2138 2550 180 0.040 0.170 0.280 Maximum 11541 2000 527 15649 11283 1418 0.072 0.320 0.610 Minimum 167 15 0.01 276 476 25 0.020 0.070 0.030 Std. Dev. 2674 577 119 3832 3040 365 0.013 0.049 0.127 Observations 45 45 45 45 45 45 45 45 45
5. Empirical results
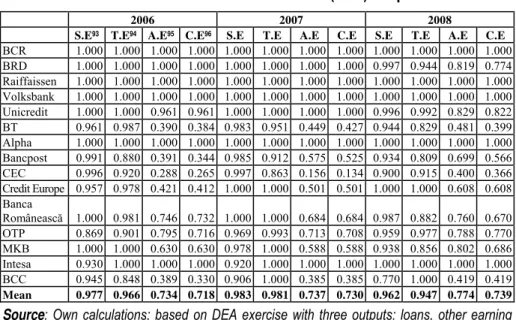
The scale efficiency scores (Table 4) show that large banks included in the study were found to be the most scale-efficient. The majority of these banks benefit from economies of scale. It is mentioned and noted that banks with shareholders from Romania (BT, CEC or BCC) have some of the lowest efficiency scores. Furthermore they fail to benefit from scale economies, which reinforce the idea that the privatization of the banking sector in Romania was a successful one in most cases. Analyzing the scale efficiency scores evolution in those three years it is noted that it has declined steadily, the growing competition in the banking sector in Romania attenuating the positive results. Overall, however, differences in scale efficiency scores are quite modest. This means that the banks included in the study operate close to the point that allows them to benefit from scale economies. With respect to technical efficiency scores, all banks are found to be operating close to the frontier.
Table 4
DEA results under Variable Return to Scale (VRS) – input-oriented
2006 2007 2008
S.E93 T.E94 A.E95 C.E96 S.E T.E A.E C.E S.E T.E A.E C.E
BCR 1.000 1.000 1.000 1.000 1.000 1.000 1.000 1.000 1.000 1.000 1.000 1.000 BRD 1.000 1.000 1.000 1.000 1.000 1.000 1.000 1.000 0.997 0.944 0.819 0.774 Raiffaissen 1.000 1.000 1.000 1.000 1.000 1.000 1.000 1.000 1.000 1.000 1.000 1.000 Volksbank 1.000 1.000 1.000 1.000 1.000 1.000 1.000 1.000 1.000 1.000 1.000 1.000 Unicredit 1.000 1.000 0.961 0.961 1.000 1.000 1.000 1.000 0.996 0.992 0.829 0.822 BT 0.961 0.987 0.390 0.384 0.983 0.951 0.449 0.427 0.944 0.829 0.481 0.399 Alpha 1.000 1.000 1.000 1.000 1.000 1.000 1.000 1.000 1.000 1.000 1.000 1.000 Bancpost 0.991 0.880 0.391 0.344 0.985 0.912 0.575 0.525 0.934 0.809 0.699 0.566 CEC 0.996 0.920 0.288 0.265 0.997 0.863 0.156 0.134 0.900 0.915 0.400 0.366 Credit Europe 0.957 0.978 0.421 0.412 1.000 1.000 0.501 0.501 1.000 1.000 0.608 0.608 Banca
Românească 1.000 0.981 0.746 0.732 1.000 1.000 0.684 0.684 0.987 0.882 0.760 0.670 OTP 0.869 0.901 0.795 0.716 0.969 0.993 0.713 0.708 0.959 0.977 0.788 0.770 MKB 1.000 1.000 0.630 0.630 0.978 1.000 0.588 0.588 0.938 0.856 0.802 0.686 Intesa 0.930 1.000 1.000 1.000 0.920 1.000 1.000 1.000 1.000 1.000 1.000 1.000 BCC 0.945 0.848 0.389 0.330 0.906 1.000 0.385 0.385 0.770 1.000 0.419 0.419
Mean 0.977 0.966 0.734 0.718 0.983 0.981 0.737 0.730 0.962 0.947 0.774 0.739
Source: Own calculations; based on DEA exercise with three outputs: loans, other earning
assets and core profit; and three inputs: deposits personnel and number of branches.
93 Scale efficiency: CRSTE (technical efficiency from DEA CRS)/VRSTE (technical efficiency
from DEA VRS).
A significant difference is observed when expressing the allocative efficiency scores; these scores were compared taking into account the inputs prices. And in this case also large banks are the most effective, but, overall, over the three years, this score has improved. The product of technical efficiency and allocation efficiency scores generated cost efficiency score. In this case we see very big differences between banks. We must observe the very low cost efficiency of banks with domestic shareholders. This is caused primarily by very extensive network of bank branches, BT, CEC and BCC failing to exploit it to the fullest. Also, large differences between cost efficiency scores show that some banks manage to control more appropriately the input prices. In view of this score note that 66.66% of the banks included in the study are inefficient.
Analyzing the scores obtained by applying option CRS (Table 5) we observe that differences among banks are much bigger. For example, in 2007 Alpha was 87.4 more efficient in terms of costs compared to CEC Bank. Also, in 2008, Volksbank was 78.9 more effective than the Commercial Bank Carpatica. Even if the dynamics of cost efficiency improved over the three years, the level at which this score has increased is quite low. Small banks will be forced either to grow the loans in accordance with the resources used, either to minimize costs of the territorial units or of the employees. Moreover, both in 2006 and in the years 2007 and 2008, 80% of the banks included in the study, are inefficient in terms of cost efficiency score. Thus, only 3 banks are efficient, their scores being equal to 1.000. The major reason for inefficiency is overemployed inputs. The banks are using more inputs than required to get the same level of output.
Table 5 DEA results under Constant Return to Scale (CRS) – input-oriented
2006 2007 2008 TFP97 T.E A.E C.E TFP T.E A.E C.E TFP T.E A.E C.E
BCR 1.000 1.000 0.886 0.886 1.132 1.000 0.943 0.943 1.245 1.000 1.000 1.000 BRD 1.000 1.000 1.000 1.000 1.129 1.000 1.000 1.000 1.015 0.941 0.808 0.761 Raiffaissen 1.000 1.000 0.648 0.648 1.015 1.000 0.719 0.719 1.103 1.000 0.927 0.927 Volksbank 1.000 1.000 1.000 1.000 1.139 1.000 1.000 1.000 1.068 1.000 1.000 1.000 Unicredit 1.000 1.000 0.951 0.951 1.182 1.000 0.973 0.973 1.251 0.988 0.789 0.779 BT 1.000 0.948 0.395 0.375 1.001 0.934 0.450 0.420 0.948 0.782 0.495 0.387 Alpha 1.000 1.000 1.000 1.000 1.117 1.000 1.000 1.000 0.867 1.000 1.000 1.000 Bancpost 1.000 0.872 0.373 0.326 1.046 0.898 0.580 0.521 0.944 0.756 0.718 0.543 CEC 1.000 0.916 0.280 0.257 0.951 0.861 0.146 0.126 1.100 0.824 0.428 0.353 Credit Europe 1.000 0.936 0.302 0.283 1.125 1.000 0.429 0.429 1.174 1.000 0.529 0.529 Banca
Româneascã 1.000 0.981 0.642 0.630 1.007 1.000 0.584 0.584 0.955 0.871 0.654 0.529
2006 2007 2008 TFP97 T.E A.E C.E TFP T.E A.E C.E TFP T.E A.E C.E
OTP 1.000 0.783 0.541 0.423 1.227 0.962 0.464 0.446 1.101 0.936 0.516 0.483 MKB 1.000 1.000 0.388 0.388 0.984 0.978 0.319 0.312 0.937 0.803 0.481 0.387 Intesa 1.000 0.930 0.584 0.543 1.037 0.920 0.518 0.477 1.251 1.000 0.647 0.647 BCC 1.000 0.801 0.255 0.205 1.153 0.906 0.248 0.224 0.969 0.770 0.274 0.211
Mean 1.000 0.945 0.616 0.594 1.080 0.964 0.625 0.612 1.055 0.911 0.684 0.638
Source: Own calculations; based on DEA exercise with three outputs: loans, other earning
assets and core profit; and three inputs: deposits personnel and number of branches.
By applying the DEA technique, besides estimating the efficiency, productivity can also be measured (Total Factor Productivity - TFP) at the level of every single bank. Productivity of the banking sector in Romania saw an evolution trend in 2007, even if in 2008 TFP decreased compared to 2007, which can be explained by the current financial situation. Thus, in 2007, the productivity index increased both for the most banks included in the study, as well as an average, in 2008 the average productivity of banks decreased compared to 2007 from 1.080 to 1.055. Also, only 6 banks managed to improve the productivity index, although the impact of the financial crisis on Romania's banking sector took effect from the last quarter of the year. On average, the TFP change is 1.055 (which is greater than 1); it indicates a 5.5 percent growth rate over 3 years. Regarding TFP growth on the basis of ownership, the foreign-owned banks have highest TFP growth.
6. Conclusions
In an increasingly competitive environment, as the banking sector is in Romania, all potential cost savings are important. Nonetheless, the general conclusion from our results is that banks, especially those with a lower market share and local management must continue to reform and improve their efficiency, in order to achieve the level of convergence with banks that have an appropriate management policy.
although the analysis spreads over only three years, there is a pro-cyclical trend in evolution. The DEA analysis applied to the banking environment in Romania offers an overview of its performance, and, in addition, this method can be applied even by banks in order to identify the inefficient banking units.
The results of this study must be correlated with the positive evolution of the bank sector in Romania in recent years. Consequently, we feel it is desirable, but also necessary to continue the analysis in 2009, in order to capture more effectively the effects induced by the global financial crisis and the ways in which Romanian banks responded to that challenge.
We consider that since most of the commercial banks in Romania did not succeed to render their activities efficient, to restructure costs, to increase productivity, in these banks we fied the reasons which were at the basis of the apparition of credit institutions specialized in many developed countries, these reasons being connected mainly to the insufficient funding offer from the commercial banks sector for certain operations; the necessity of assuring a distribution channel for the subsidized credit; the need to offer an alternative way to overcome the difficulties of access to the capital market for many economic agents.
Selective bibliography
Barr, R.S. (2002), “Evaluating the productive efficiency and performance of U.S. commercial banks”, Managerial Finance, Vol. 28, No.8, pp.3-25.
Casu, B., Molyneux, P. (1998), “A Comparative Study of Efficiency in European Banking”, Center for Financial Institutions Working Papers, University of Pennsylvania.
Coelli, T., Rao, D.S.P., O’donnell, C.J., and Battese, G.E. (2005), An introduction to efficiency and productivity analysis, New York: Springer Press.
Elisabetta, F., Alexander, K., Michael, K. (2006), “The cost efficiency of German banks: A comparison of SFA and DEA”, Discussion Paper Series 2: Banking and Financial Studies, No 10.
European Central Bank, “EU Banking Sector Stability”, August 2009.
Hancock, D. (1991), A Theory of Production for the financial firm, Norwell, MA: Kluwer Academic Publishers.
Jemric, I., Vujcic B. (2002) “Efficiency of Banks in Croatia: A DEA Approach”, Croatian National Bank Working Papers.
Noulas, A. G. (2001) “Deregulation and operating efficiency: The case of Greek Banks”, Managerial Finance, Vol. 27, No.8, pp. 35-47.
Sealey, C.W., Lindley J.T. (1977), “Inputs, Outputs and a Theory of Production and Cost at Depository Financial Institutions,” Journal of Finance, Vol. 32, No. 4, pp. 1251-66.
Supachet, C. “The Relative Efficiency of Commercial Banks in Thailand: DEA Approach”, International Research Journal of Finance and Economics, EuroJournals Publishing.