Insan Akademika Publications
INTERNATIONAL JOURNAL
OF BASIC AND APPLIED SCIENCE
P-ISSN: 2301-4458 E-ISSN: 2301-8038
Vol. 01, No. 02 Oct 2012
www.insikapub.com
Topography and Land Temperature Investigation Using Arc GIS 10
Babita Pal
1and Sailesh Samanta
21
Papua New Guinea University of Technology CAMPUS, Private Mail Bag, Lae- 411,
Morobe Province, Papua New Guinea
[email protected]
2
Department of Surveying and Land Studies,
Papua New Guinea University of Technology, Private Mail Bag, Lae- 411,
Morobe Province, Papua New Guinea
[email protected]
Key words Abstract
Geographic information systems, Remote Sensing, Surface temperature, 3-D Modeling, Spatial analysis
The paper seeks an empirical methodology for modeling and mapping of the topography using remote sensing (RS) and geographic information systems (GIS) techniques. Firstly this paper examines the mathematical approaches for different surface analysis like contour, hill-shade, slope, aspect and cut/fill analysis. View-shade analysis was also performed which have a large application on mobile telecommunication in the hilly region. Secondly this paper examines statistical approaches for monitoring surface using LANDSAT-7 ETM+ satellite data, which has wide range of electromagnetic wavelength band, including visible, infrared and thermal bands. Its thermal bands (band 6.1 and 6.2) can detect thermal radiation released from objects on the earth surface. This study has been conducted to develop surface temperature (ST) using 3 sets of algorithm from LANDSAT-7 ETM+. Finally modeled land surface temperature data set was overlaid on digital elevation model (DEM) to find out the relation of surface temperature with variation of altitude of the study area.
© 2012 Insan Akademika All Rights Reserved
1
Introduction
to studying topography, which method(s) are used depend on the scale and size of the area under study, its accessibility and the quality of existing surveying processes. Remote sensing has greatly speeded up the process of gathering information, and has allowed greater accuracy control over long distances, the direct survey still provides the basic control points and framework for all topographic work, whether manual or GIS-based. A geographic information system (GIS) can recognize and analyze the spatial relationships that exist within digitally stored spatial data. These topological relationships allow complex spatial modelling and analysis to be performed. Topological relationships between geometric entities traditionally include adjacency (what adjoins what), containment (what encloses what), and proximity (how close something is to something else).
2
Materials and Methods
2.1 Data used
Different types of data were used for preparation of surface analytical maps of the area, like- shuttle radar topography mission (SRTM) data, National atlas of Papua New Guinea and topographical map of the corresponding area. One of the most widely used digital elevation model (DEM) data sources is the elevation information provided by the shuttle radar topography mission (SRTM) (Coltelli, et. al., 1996), but as with most other DEM sources, the SRTM data requires significant levels of pre-processing to ensure that there are no spurious artifacts in the data that would cause problems in later analysis such as pits, spikes and patches of no data (Dowding, et. al., 2004). In the case of the SRTM data, these patches of no data are filled, preferably with auxiliary sources of DEM data, like-topographical maps. Both data sets were used for this study. Optical bands with standard false color combination (SFCC) of LANDSAT 7 ETM+ satellite images were used to find out the land use/ land cover classes in the study area. Thermal band were also used to calculate the daily cold and hot surface. All other details of the variables are given in the Table 1.
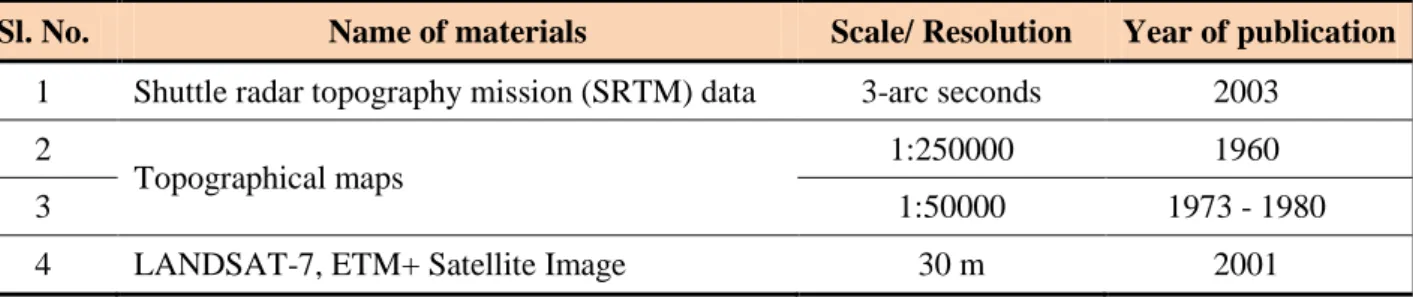
Table 1. Topographical maps and other materials
Sl. No. Name of materials Scale/ Resolution Year of publication
1 Shuttle radar topography mission (SRTM) data 3-arc seconds 2003
2
Topographical maps 1:250000 1960
3 1:50000 1973 - 1980
4 LANDSAT-7, ETM+ Satellite Image 30 m 2001
2.2 Methodology for preparation of digital elevation model
On the other hand, DEM was also generated from topographical maps. Single map rectification was performed using the geographical coordinate system and WGS 84 datum with a RMS error of 0.02. ERDAS IMAGINE 9.0 was used to rectify topographical maps of the study area using the geographical Coordinate system and WGS 84 datum with a RMS error of 0.25. The entire study area does not appear in single sheet. All the geo-referenced topographical map sheets of the area were mosaicked to get the entire study area. Using the similar projection as well as datum for all the soil maps were mosaicked in the environment. Prepared data sets in this process were compared with the SRTM data set to find out the accuracy of both data sets.
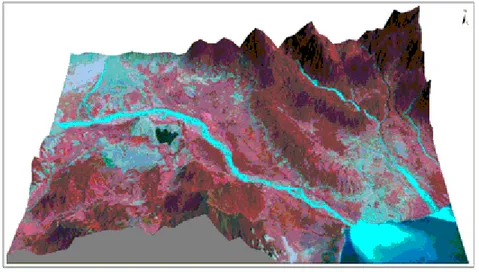
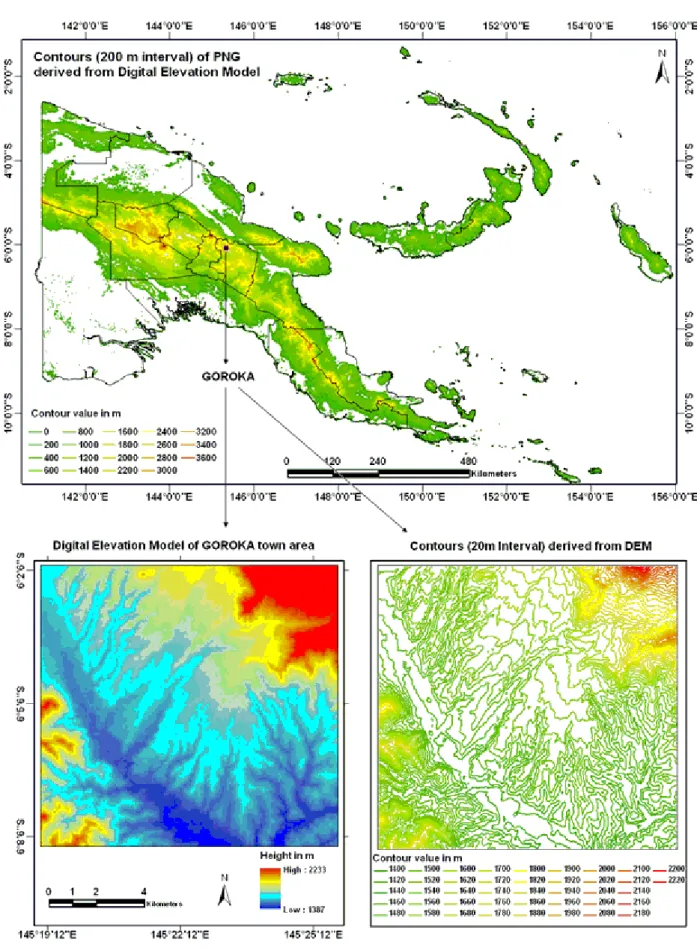
After obtaining satisfied level of accuracy, we have proceeded with the generation of the final output. The entire data range was stretched with distinct color. The final map was generated to represent the digital elevation model with 90m spatial resolution for total Papua New Guinea land area (Fig. 1). The detail map was generated with the help of 90m digital elevation model data and 30m LANDSAT-7, ETM+ image after overlaying them in the virtual GIS viewer of ERDAS IMAGINE (Fig. 2). The part of Morobe province, Lae coast and surrounding area was cropped for this purpose from digital elevation model data as well as from the LANDSAT-7, ETM+ Satellite image. We processed 15 vertical exaggerations to present the 90 m spatial resolution Digital Elevation Model.
Fig. 2: Overlay of DEM and ETM+ Image (Mouth of Markham River, Lae, Morobe)
2.3 Surface analysis using digital elevation model
Surfaces represent phenomena that have values at every point across their extent. The values at the infinite number of points across the surface are derived from a limited set of sample values. These may be based on direct measurement, such as height values for an elevation surface, or temperature values for a temperature surface; between these measured locations values are assigned to the surface by interpolation. Surfaces can also be mathematically derived from other data, such as slope and aspect surfaces derived from an elevation surface, a surface of distance from bus stops in a city, or surfaces showing concentration of criminal activity or probability of lightning strikes. Surfaces can be represented using contour, arrays of points, Triangulated Irregular Network (TIN) and raster. However most surface analysis in GIS is done based on raster or TIN data. TINs are constructed from a set of known values, sometimes called "spot heights" that are used as initial nodes in the triangulation.
2.3.1 Contour
2.3.2 Slope
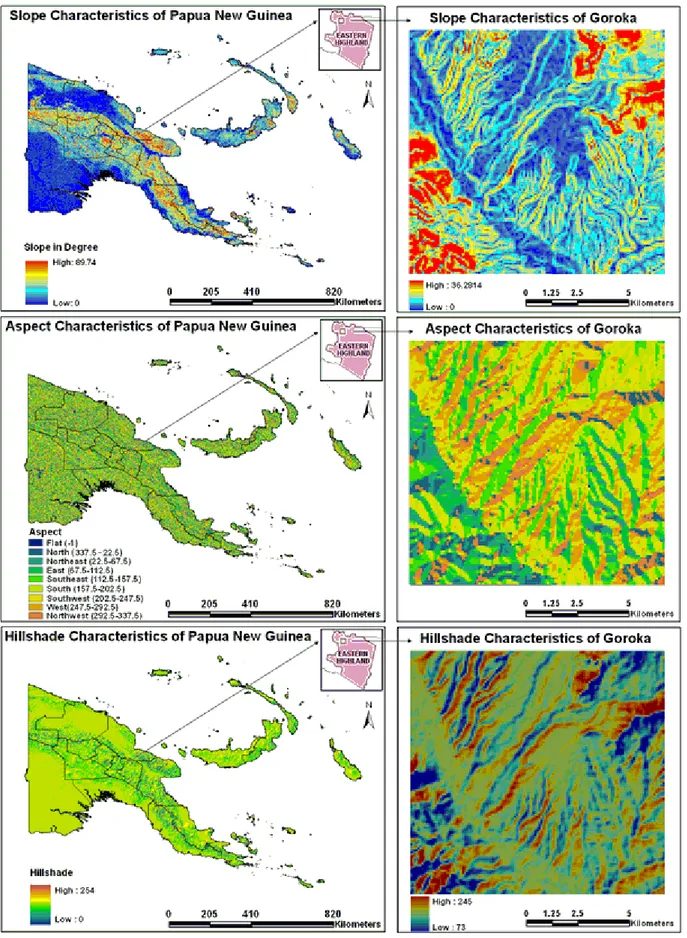
The slope tool calculates the maximum rate of change between each cell and its neighbors, for example, the steepest downhill descent for the cell (the maximum change in elevation over the distance between the cell and its eight neighbors). The lower the slope value indicates the flatter the terrain and the higher the slope value the steeper the terrain. The output slope raster can be calculated as percent of slope or degree of slope. EARDAS IMAGINE and ArcGIS were used to generate slope map of the study area using the DEM data (Fig. 4).
2.3.3 Aspect
Aspect identifies the steepest down slope direction from each cell to its neighbors. It can be thought of as slope direction or the compass direction a hill faces. Aspect is measured clockwise in degrees from zero, due north to 360, again due north, coming full circle. The value of each cell in an aspect dataset indicates the direction the cell's slope faces. Flat areas having no down slope direction were given a value of -1. EARDAS IMAGINE and ArcGIS were used to generate aspect map using the DEM data (Fig. 4).
2.3.4 Hill-shade
The hill-shade function obtains the hypothetical illumination of a surface by determining illumination values for each cell in a raster. It does this by setting a position for a hypothetical light source and calculating the illumination values of each cell in relation to neighboring cells. It can greatly enhance the visualization of a surface for analysis or graphical display, especially when using transparency. The hill-shade (Fig. 4) below has an azimuth of 315 and an altitude of 45 degrees. EARDAS IMAGINE and ArcGIS were used to generate hill-shade map using the DEM data.
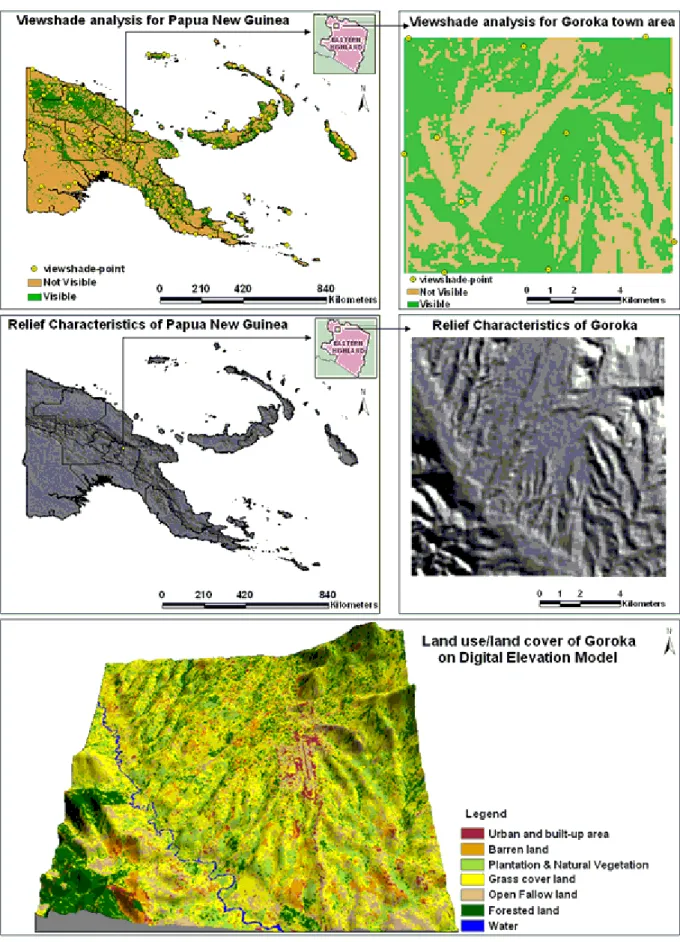
2.3.5 View-shade
2.4 Surface temperature assessment
A surface temperature model was used to calculate the surface temperature from 7th band of LANDSAT ETM+ satellite image. ERDAS IMAGINE 8.5 was used for this purpose. Unlike the published TM-temperature model that would consider the min-max digital count for every image, to get the spectral radiance, Lλ, the following algorithms (Equation1 to 3) were applied to compute the surface temperature
from band7th band of LANDSAT ETM+ satellite image.
ETM+ bands are quantized as 8 bit data; all information was stored in digital number (DN) with range between 0 and 255 (8 bit). The data was converted to radiance using a linear equation (Sobrino 2004) as shown below:
CVR = G (CVDN) + B ...(1)
Where : CVR = the cell value as radiance,
CVDN = the cell value digital number, G is the gain (0.05518 for ETM+ 7), and
B = the offset (1.2378 for ETM+ 7)
The thermal band’s radiance values were converted to brightness temperature values by applying the inverse of the Planck function. The formula (2) used (Sobrino 2004) to convert radiance to brightness temperature was:
T = K2/{(k1/CVR) + 1} ...(2)
Where : T = degrees Kelvin, CVR is the cell value as radiance, K1 = calibration constant 1{666.09 (for ETM+)}, and K2 = calibration constant 2{1282.71 (for ETM+)}
Conversion brightness temperature from degrees Kelvin to degree Celsius was converted using the following equation:
TC = TK – 273 ...(3)
Where : TC = temperature in degrees Celsius, and
TK = temperature in degrees Kelvin
3
Results and Discussion
The absolute relief of PNG is approximately 3621 meter derived by 3D analysis process from digital elevation model data set (Fig. 1). The relative relief of Goroka town and its surroundings is 846m (max altitude-2233m and minimum-1387m). As a whole if we consider PNG, the maximum slope is 89.74 degree, whereas Goroka town and its surroundings contains maximum slope of 36.28 degree, is shown in Fig.4. More than 70% of the area comes under 15 degree of slope. This moderate slope is good for agriculture activity, not for landslide. The airport is located in the plane land area with 0 degree slope, easily identified by the slope and aspect map.
(Fig. 6 & 7). The further away from the surface, the cooler the air will be. It's like standing next to a fire; the closer you are the warmer you'll feel.
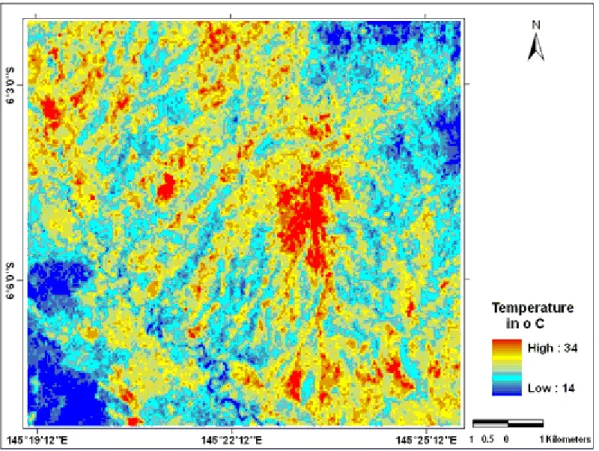
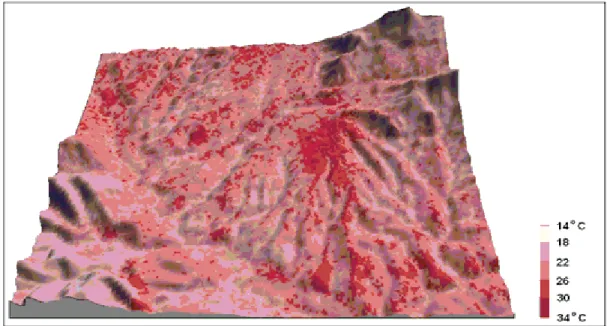
The calculated land surface temperature shows (Fig. 6) a range of temperature 14 to 34 (represented by graduated color-blue to red) degree centigrade in the Goroka region. The hot temperate areas were clearly identified (Red color pixels) from the resulted dataset. The Goroka city region and the barren lands (sand/boulders) areas were showing the high temperature value (red) for their high thermal influencing properties. The anthropogenic activity like roads, buildings and other construction are the causes of more thermal radiation, easily identified by temperature modeling. Temperature is less (blue) in the north-east and south-west hilly area where dense vegetation is present. Due to increase of the height hilly region shows less temperature (Fig. 7) then the plane land and water body.
Fig. 7: Surface temperature characteristics in relation to DEM of the area
4
Conclusions
Digital elevation data set is very useful to find out the slope, aspect, hill-shade and relief, which are very important for agricultural activity. The view-shade also derived from DEM, which is using to find the minimum number of stations to give the communication coverage by mobile communication tower for a certain region/area. With the change of elevation/vertical height the weather or climate also changed. DEM can be used to model the air temperature of a particular area along with other independent variables. Surface temperature also depends on different variable of the Earth surface or atmosphere. For temperature modeling we used ETM+ satellite image and compared with digital elevation model data set. There are many different processes to model the temperature using some dependent and independent climate variables. If we bring into play the entire variables like- land use/land cover, soil texture, digital elevation model, distance from sea, latitudinal location, continentality, solar radiation and cloudiness factor, aspect then the model may predict accurate result. This temperature model is applicable for Papua New Guinea. We can run this model for calculating the mean monthly temperature of any part of the world. It is only possible, if all data sets like elevation, soil texture and land use/land cover data of the area are available.
Acknowledgement
One of the authors (SS) expresses sincere gratitude to Papua New Guinea University of Technology & Department of Surveying and Land studies for providing digital image interpretation laboratory facility to carry out this work. The authors are also grateful to the all the academic staff of GIS section for their valuable comments and suggestions.
References
Dowding, S., Kuuskivi, T. and LI, X. (2004) Void fill of SRTM elevation data – Principles, Processes and Performance, In: Images to Decisions: Remote Sensing Foundations for GIS Applications, ASPRS, Fall Conference, September 12-16, Kansas City, MO, USA.
Hutchinson, M. (1988) Calculation of hydrologically sound digital elevation models. Third International Symposium on Spatial Data Handling, Columbus, Ohio, International Geographical Union.
Hutchinson, M. (1989) A new procedure for gridding elevation and stream line data with automatic removal of spurious pits, Journal of Hydrology vol. 106, pp.211-232.