1 Corresponding author:
Received: July 13, 2018 Accepted: November 12, 2018
Copyright: All the contents of this journal, except where otherwise noted, is licensed under a Creative Commons Attribution License.
Selection index based on phenotypic and genotypic
values predicted by REML/BLUP in Papaya
Sarah Ola Moreira
1, Karin Tesch Kuhlcamp
2, Fabíola Lacerda de Souza Barros
2,
Moises Zucoloto
3, Tiago de Oliveira Godinho
41PhD in Genetics and Plant Breeding. Researcher at Capixaba Institute for Research, Technical Assistance and Rural Extension/Incaper,
Domingos Martins - ES. Brazil. E-mail: [email protected](ORCID 0000-0003-0659-6725)
2MSc in Plant Production. Researcher at Incaper. E-mails: [email protected] (ORCID 0000-0001-8112-0431); karin.kuhlcamp@
incaper.es.gov.br (ORCID 0000-0002-1240-8877)
3PhD in Crops Science. Professor at the Federal University of Espirito Santo - Ufes. Center of Agrarian Sciences and Engineering. Department
of Agronomy. E-mail: [email protected] (ORCID 00000-0003-0539-4750)
4PhD in Forestry Resources. Researcher at Incaper. E-mail: [email protected](ORCID 00000-0001-6249-6054)
Abstract - Selection of superior genotypes based on the simultaneous responses to different characteristics is a fundamental strategy in plant breeding. This study aimed to compare the
efficiency of four selection index constructed using phenotypic and genotypic values in a
segregating population of the cultivar Rubi Incaper 511. Eight morpho-agronomic variates and
the severity of black-spot and phoma-spot were evaluated under field conditions. The classical
selection index were calculated based on non-standardized phenotypic means (NSM), standardized means (SM), and genotypic values predicted by REML/BLUP (GVP), using predetermined
economic weights. Additionally, the rank sum (RS) was obtained on the basis of the classification
of individuals in these three selection index. For ten characteristics, the selected individuals showed a higher mean than did the original population. The best selection differential values were obtained by SM, however, the highest degree of coincidence among the selected individuals was obtained
between GVP and RS (80%). The index used were efficient at selecting individuals with higher
soluble solids and lower diseases severity evaluated. Therefore, for the papaya breeding programs, different selection index need to be evaluated to maximize genetic gain.
Index terms:Carica papaya L., selection criteria, mixed model, selection differential.
Índices de seleção baseados em valores fenotípicos e genotípicos
preditos via REML/BLUP em mamoeiro
Resumo - A seleção de genótipos superiores com base na resposta simultânea à diferentes caracteres é uma estratégia fundamental no melhoramento de plantas. Neste estudo objetivou-se
comparar a eficiência de quatro índices de seleção construídos a partir de valores fenotípicos e
genotípicos, em uma população segregante da cultivar Rubi Incaper 511. Foram avaliadas oito variáveis morfoagronômicas e a severidade de pinta-preta e mancha-de-phoma em condições de campo. Os índices clássicos de seleção foram calculados com base na média fenotípica não padronizada (NSM), padronizada (SM) e nos valores genotípicos preditos via REML/Blup (GVP), utilizando pesos econômicos pré-determinados. Adicionalmente, foi obtida a soma de ranks (RS),
considerando o ordenamento dos indivíduos nesses três indices de seleção. Em dez características, os indivíduos selecionados melhoraram a média em relação à população original. Os melhores
valores de diferencial de seleção foram obtidos pelo SM, porém, o maior grau de coincidência
entre os indivíduos selecionados foi obtido entre GVP e RS (80%). Os índices utilizados foram
eficientes para selecionar os indivíduos com maior teor de sólidos solúveis e menor severidade das doenças avaliadas. Os diferentes índices de seleção devem ser avaliados quanto a sua eficiência na obtenção de ganhos genéticos, buscando aquele que trará melhores resultados aos programas
de melhoramento do mamoeiro.
Termos para indexação: Carica papaya L., critérios de seleção, modelos mistos, diferencial de seleção.
Introduction
The Brazil is one of the leading papaya-producing (Carica papaya L.) countries globally. However, only a few cultivars and hybrids are available to producers (PINTO et al., 2013; LUZ et al., 2015). To achieve high
productivity and obtain good-quality fruits, selection of
new genotypes is crucial for fruit producers. Nevertheless, selection based on a small number of variables could be
inadequate because of potential negative correlations
between the variables (PEDROZO et al., 2009; RAMOS et al., 2014) and low heritability of characteristics of interest, such as productivity. Therefore, genotype selection is more effective when it considers several characteristics (VIVAS et al., 2012; PINTO et al.; 2013; ENTRINGER et al., 2016; LEITE et al., 2016) and with selection methods capable of
efficiently evaluating available genetic material.
Different selection index can be used in plant breeding, which are generally constructed from estimates of genetic parameters or phenotypic means obtained using analysis of variance. Furthermore, one way to increase the effectiveness of selection would be to use individual genotypic values, which are additive and have greater accuracy (RAMOS et al., 2014; QUINTAL et al., 2017). These individual genotypic values can be estimated using mixed linear models of the restricted maximum likelihood/ best linear unbiased prediction type (REML/BLUP) (FERREIRA et al., 2016b; RESENDE, 2016).
In order to select individuals based on the morpho-agronomic characteristics, tolerance papaya skin freckles (PINTO et al., 2013), and disease resistance (VIVAS et al., 2013; 2014), different selection index have been used in papaya in the last few years. After comparing selection index based on phenotypic and genotypic values obtained by REML/BLUP, Ramos et al. (2014) concluded that this strategy resulted in greater consistency in the individual rankings. However, Pinto et al. (2013) support the idea
that the efficiency of the selection index is specific to each population and experimental conditions; hence, a specific evaluation is required for each breeding program.
‘Rubi Incaper 511’ is an open-pollinated cultivar launched by the Capixaba Institute for Research, Technical Assistance and Rural Extension (Incaper) in 2010 (CATTANEO et al., 2010). In a study by Barros et al. (2017), in which this cultivar was compared with eight other genetic materials, including hybrids, and the ‘Rubi Incaper 511’ had higher productivity, higher number of commercial fruits and fewer deformed fruits in the two harvests evaluated. However, the low soluble solids content of its fruits prevents its use on a commercial scale, which reinforces the need to continue the papaya breeding program developed by Incaper, which seeks to improve
fruit quality of ‘Rubi Incaper 511’.The objective of this
study was to compare different selection index based on the phenotypic and genotypic values predicted by REML/
BLUP in a segregating population of the papaya cultivar Rubi Incaper 511.
Material and methods
The experiment was conducted at the experimental farm of the Capixaba Institute for Research, Technical Assistance, and Rural Extension (Incaper) in Sooretama, state Espírito Santo. According to Köppen’s climate
classification, the climate of this area is tropical with dry
season (Aw), and it has an average annual air temperature of 23.5 °C and average annual precipitation of 1,276 mm (ALVARES et al., 2013).
The segregating population consisted of 750 plants of Carica papaya L. ‘Rubi Incaper 511’. Because of the absence of parental control, the evaluation was performed individually, which in a later stage will form half-sib families. The experiment was conducted between March 2014 and November 2015, with a spacing of 3.5 × 2 m between plants. The cultural practices were carried out according to a recommendation for culture (MARTINS; COSTA, 2003).
Eighteen months after planting, were pre-selected 150 hermaphrodite plants with the same fruit pattern and productivity of ‘Rubi Incaper 511’ as reported by Cattaneo et al. (2010). In the selected plants, the plant height (PH), stem circumference (SC) at 20 cm distance from soil,
and insertion height of the first fruit (IHFF) (in cm) were
measured. Three fruits per plant were harvested at stage 2 of maturation (when 15% of the surface showed yellow skin) and the length of the fruit (LF); width of the fruit (WF); pulp thickness (PT), in cm; mass of the fruit (MF), in kg; and soluble solids (SS), in °Brix; were measured.
The severity of black-spot on leaves (BSL) and fruits (BSF), caused by Asperisporium caricae
(Speg.) Maubl., and phoma-spot on leaf (PSL), caused by Stagonosporopsis caricae (Sydow & P. Sydow) Aveskamp, Gruyter & Verkley, were evaluated monthly between the 5th and 16th month. For BSL and PSL, the symptoms were evaluated on the leaf associated with the
first open flower, where: 1 = 0%; 3 = <5%; 5 = 6-15%; 7 = 16-25%; 8 = 26-50%; 9 = >50% of injured leaf area (ANDRADE et al., 2003). For BSF, to facilitate field
evaluation, the diagrammatic scale proposed by Vivas et al. (2010) was converted into a scale of notes with the
following standardization: 1 = 0%; 2 = 0.1%; 3 = 0.3%; 4 = 0.6%; 5 = 1.2%; 6 = 2.5%; 7 = 5.0%; 8 = 10.0%; 9 = 20.0% of injured fruit surface. The data for disease
progress curves were evaluated using the trapezoidal model (SHANER; FINNEY, 1977).
(c-c)/s2
c, where c is the arithmetic mean of the individual, cis the overall mean of the characteristic, and s2
c is the
standard deviation, and (iii) genotypic values predicted by mixed models (GVP). The following economic weights
were defined as proposed by Ramos et al. (2014), Vivas
et al. (2014) and in the objectives of the Incaper breeding
program: PH, WF, and LF = 1; SC = 5; IHFF = −10; PT = 50; MF = 20; SS = 100; PSL, BSL, and BSF = −30.
In addition, selection was made using a variation of the Mulamba and Mock (1978) index (RS), using the sum of the ordering obtained in the three selection index described above, instead of the rank sum of the individuals in each variable. For each selection index, the
mean of the first 20 classified (selection pressure of 13%) and the selection differential (SD) and the coefficient of
coincidence between selection index were estimated. The overall mean, upper and inferior limit, phenotypic variance (s2f), environmental variance (s2),
coefficient of variation (CVe), broad-sense heritability
(H2
g), broad-sense heritability, adjusted for line and
column effects (H2
adj), were estimated with mixed models
using REML/BLUP, considering the absence of an experimental design. The statistical model was defined by
y = Xu + Zg + Wl + Tc + e; where y is the vector of data;
u is the vector of overall mean; g is the vector of genotypic effects; l is the vector of line effects; c is the vector of column effects; and e is the vector of errors. Uppercase letters represent the incidence matrices for the said effects. The genetic parameters were estimated using the Selegen software (RESENDE, 2016), and the selection index were calculated using Microsoft Excel 2016.
Result and discussion
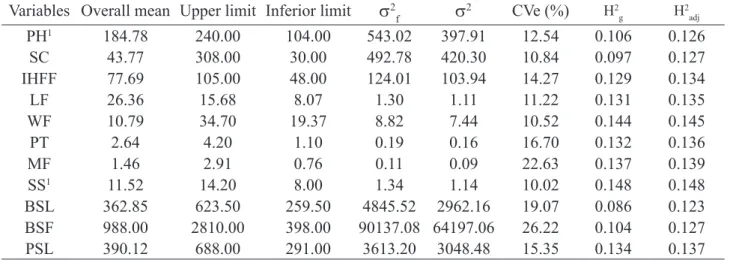
At its release, the values of MF, WF, LF, and SS for ‘Rubi Incaper 511’ were 1.47 kg, 11.6 cm, 24.1 cm, and 10.2 °Brix, respectively (CATTANEO et al., 2010). Although the species has a mixed reproductive system and the open-pollinated cultivar, pre-selected individuals maintained fruit size averages close to the original ones. However, the mean SS value in pre-selected individuals was 11.52 °Brix, better than that in the original population by approximately 13% (Table 1). The papaya producers prefer plant materials with SS values around 12 °Brix (LUZ et al., 2015). The SS content of ‘Rubi Incaper 511’, of the 10.2 °Brix (CATTANEO et al., 2010), considered low, has been one of the main obstacles for expansion of its cultivation. Hence, the objective of the papaya breeding program at Incaper is to improve the sugar content of the fruits without negatively affecting productivity. Our results indicate that pre-selection could prove useful in achieving this objective.
According to the classification proposed by Ferreira et al. (2016a), the coefficients of variation (CVe) for
the evaluated characteristics were medium, except for PT, and agreed to Pinto et al. (2013) and Ramos et al. (2014). CVe of this magnitude were expected because the experiment was not replicated, which would enhance the
environmental influence as the study was conducted under field conditions. However, they still allowed inferences
about the study population.
T h e e n v i r o n m e n t a l i n f l u e n c e m i g h t b e responsible for the low heritability coefficients obtained for all evaluated variables. The H2
gvalues
w e r e b e t w e e n 8 . 6 % a n d 1 4 . 8 % a n d t h e H2 a d j
values were between 12.3% and 14.8%, for both BSL and SS (Table 1). These values corroborate those reported by Pinto et al. (2013), which even using experimental design
reported coefficients of heritability that ranged between
0% and 20%. Oliveira et al. (2012) observed heritability of 18% for SS. The low heritability estimates can be attributed to the narrow genetic base of the population, which reduces the available genetic variability (BARROS et al., 2017; PINTO et al., 2013), as well as the effects of climate and of the nutritional conditions of the crop on fruit development. These results indicate that to
improve the heritability coefficient, it is necessary to use
strategies such as increasing the number of replicates, the environments evaluated, and the genetic variability of the population. In this study, it is intended to open half-sib families of the selected individuals, which will allow the evaluation between and within families, which may favor
the achievement of higher heritability coefficients.
Only individuals 26, 59, 75, 146, and 148 were selected by all the selection index studied (Table 2). Between SM and NSM, only 25% of the selected genotypes were coincident. In contrast, the similarity between RS and GVP was 80%. Pedrozo et al. (2009), reported that
the agreement coefficients between genotypes selected
by different selection index were between 20% and 82%. The greater the agreement between two selection index, the more similar will be the results of the selection, which can a similar observation was made in the current study, because for IHFF, WF, LF, PT, MF and SS, the highest and lowest selection differential values were obtained by NSM and SM, respectively (Table 3). The high similarity between RS e GVP corroborated by the results obtained
by Ramos et al. (2014) which also obtained a coefficient
of coincidence of 80%. This high level of similarity
was reflected in the SD values which were also close as
observed for BSF, PH, IHFF, and SC (Table 3).
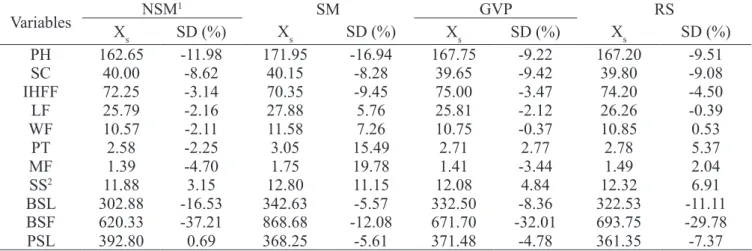
The highest values of selection differential were obtained for BSF by NSM (-37.21%), GVP (-32.01%), and RS (-29.78%). For SS, the applied index increased the overall mean between 3.15% for NSM and 11.15% for SM (Table 3). The objectives of the papaya breeding programs are to get genetic materials that are less susceptible to
diseases and would yield fruits of better quality (VIVAS et
al. 2013; RAMOS et al., 2014). Among the selection index evaluated, the SM had a better overall result, as it provided a higher SD for eight of the 11 evaluated characteristics and for not having SD results contrary to the interest of the breeding program, as observed in the other indexes studied. The results obtained from the current study
indicate that the evaluated index were efficient at selecting
individuals of interest, without, however, impairing other important characteristics such as MF, WF, LF and PT.
The selection index based on phenotypic values,
such as NSM and SM, does not require estimates of
genetic parameters, and can be used in a simpler and direct way. Thus, was observed the phenotypic means must be standardized before they are used in selection index. Similar results were obtained by Ramos et al., (2014), who evaluated the standardization of phenotypic and genotypic means and concluded that, in these two cases, the standardization of means favors selection by eliminating scale problems.
However, the mixed models allowed the
identification of the genetic values that can be used for
the selection, even in the absence of an experimental design. According to Pinto et al. (2013), the association between individual genotypic values obtained by REML/
BLUP and selection index was efficient at selecting individuals above the original population mean. Similarly, Pedrozo et al. (2009) emphasized that the use of mixed models contributed to a greater accuracy in selection, and Ferreira et al (2016b) reported that mixed models are recommended for characteristics of low heritability, such as those obtained in the study. The SD values for severity of black-spot on leaves (BSL) and fruits (BSF) obtained by GVP was larger than that obtained by SM, which resulted in a better overall result. This suggests that it is prudent to evaluate different selection indices, looking for one that will bring more results that are satisfactory to the breeding program.
The rank sum index (MULAMBA; MOCK, 1978), had intermediate selection differential values for the analyzed variables, except for PSL, which had the best SD value. This result was expected since this index is constructed from the sum of the ranking of individuals in all other indices used in this study. Evaluating different index for papaya selection, Vivas et al. (2012) reported selection differential -27.4% for PSL, and concluded that
the sum of ranks index is the most efficient procedure for
simultaneous selection of papaya hybrid resistant to black-spot, powdery mildew, and phoma-spot. When considering only the variables related to disease severity (BSL, BSF
and PSL), the rank sum index was efficient in the selection
of more tolerant papaya genotypes, as reported by Vivas et
al. (2012). However, when fruit quality and productivity
variables (LF, WF, MF and SS) are included, RS index does not exceed the overall result obtained for SM.
Table 1
. Overall mean, upper and inferior limit, phenotypic variance (
s
2f)
environmental variance (
s
2)
coefficient of variation (CVe), broad-sense heritability (
H2g
), broad-sense heritability, adjusted for line and
column effects (
H2adj
) for 11 morpho-agronomic variables and disease response in papaya.
Variables Overall mean Upper limit Inferior limit
s
2f
s
2 CVe (%) H2
g H
2 adj
PH1 184.78 240.00 104.00 543.02 397.91 12.54 0.106 0.126
SC 43.77 308.00 30.00 492.78 420.30 10.84 0.097 0.127 IHFF 77.69 105.00 48.00 124.01 103.94 14.27 0.129 0.134 LF 26.36 15.68 8.07 1.30 1.11 11.22 0.131 0.135 WF 10.79 34.70 19.37 8.82 7.44 10.52 0.144 0.145 PT 2.64 4.20 1.10 0.19 0.16 16.70 0.132 0.136 MF 1.46 2.91 0.76 0.11 0.09 22.63 0.137 0.139 SS1 11.52 14.20 8.00 1.34 1.14 10.02 0.148 0.148
BSL 362.85 623.50 259.50 4845.52 2962.16 19.07 0.086 0.123 BSF 988.00 2810.00 398.00 90137.08 64197.06 26.22 0.104 0.127 PSL 390.12 688.00 291.00 3613.20 3048.48 15.35 0.134 0.137
1PH: plant height (cm); SC: stem circumference (cm); IHFF: height of insertion of the first fruit (cm); LF: fruit length (cm); WF: fruit width
Table 2. Individuals selected and coefficients of coincidence between selection index based on non-standard means
(NSM), standardized means (SM), genotypic values predicted by REML/BLUP (GVP), and rank sum (RS) for 11 morpho-agronomic variables and disease response in papaya.
Index of selection Individuals selected
NSM 3; 26; 42; 59; 73; 74; 75; 89; 90; 92; 100; 121; 122; 123; 124; 126; 133; 145; 146; 148 SM 17; 23; 26; 27; 34; 37; 49; 59; 63; 65; 67; 75; 101; 103; 109; 125; 129; 132; 146; 148 GVP 3; 16; 17; 24; 26; 27; 37; 59; 73; 74; 75; 89; 90; 92; 100; 114; 122; 145; 146; 148 RS 17; 24; 26; 27; 37; 43; 59; 73; 74; 75; 84; 89; 90; 92; 100; 101; 122; 132; 146; 148
Coefficients of coincidence
SM GVP RS
NSM 0.25 0.7 0.6
SM - 0.4 0.5
GVP - - 0.8
Table 3. Means of selected individuals (Xs), and selection differential (SD) for 11 morpho-agronomic variables and disease response from different selection index.
Variables NSM
1 SM GVP RS
Xs SD (%) Xs SD (%) Xs SD (%) Xs SD (%) PH 162.65 -11.98 171.95 -16.94 167.75 -9.22 167.20 -9.51 SC 40.00 -8.62 40.15 -8.28 39.65 -9.42 39.80 -9.08 IHFF 72.25 -3.14 70.35 -9.45 75.00 -3.47 74.20 -4.50 LF 25.79 -2.16 27.88 5.76 25.81 -2.12 26.26 -0.39 WF 10.57 -2.11 11.58 7.26 10.75 -0.37 10.85 0.53 PT 2.58 -2.25 3.05 15.49 2.71 2.77 2.78 5.37 MF 1.39 -4.70 1.75 19.78 1.41 -3.44 1.49 2.04 SS2 11.88 3.15 12.80 11.15 12.08 4.84 12.32 6.91
BSL 302.88 -16.53 342.63 -5.57 332.50 -8.36 322.53 -11.11 BSF 620.33 -37.21 868.68 -12.08 671.70 -32.01 693.75 -29.78 PSL 392.80 0.69 368.25 -5.61 371.48 -4.78 361.35 -7.37
1Selection Index based on non-standard means (NSM), standardized means (SM), genotypic values predicted by REML/BLUP (GVP), and
rank sum (RS).
2PH: plant height (cm); SC: stem circumference (cm); IHFF: height of insertion of the first fruit (cm); LF: fruit length (cm); WF: fruit width
(cm); PT: pulp thickness (cm); MF: mass of fruit (kg); SS: soluble solids (°Brix); BSL: severity of spot on leaves; BSF: severity of black-spot on fruit; and PSL: severity of phoma-black-spot in leaf black-spot.
Conclusion
The selection index used improved the means compared to the original population for ten of the eleven characteristics evaluated. However, the values of the selection differential and the selected individuals were different. Depending on the genetic nature of the population and the experimental design used, different selection index should be evaluated in accordance with the objectives of the breeding program.
For this study, the selection index of Smith and Hazel using the standardized phenotypic means was more
efficient in the identification of individuals with better
values of soluble solids; mass, length and width of the
fruit; height of the plant and the insertion of the first fruit;
and pulp thickness.
Acknowledgments
The authors thank CNPq and Fapes for their financial support.
References
ALVARES, C.A.; STAPE, J.L.; SENTELHAS, P.C.; GOLÇALVES, J.L.M.; SPAVOREK, G. Köppen’s
ANDRADE. J.S; TATAGIBA, J.S.; VENTURA, J.A.; COSTA, H.; MARTINS, D. dos S. Avaliação da mancha-de-corynespora em diferentes sistemas de condução do mamoeiro no Norte do Espírito Santo. In: MARTINS, D. dos S. (Ed.). Papaya Brasil: qualidade do mamão para o
mercado interno. Vitória: Incaper, 2003. p. 577-579. (2)
BARROS, F.L.S.; KUHLCAMP, K.T.; ARANTES, S.D.;
MOREIRA, S.O. Productivity and quality of Formosa
and Solo papaya over two harvest seasons. Pesquisa Agropecuária Brasileira, Brasília, DF, v.52, n.8, p. 599-606, 2017. (1)
CATTANEO, L.F.; COSTA, A.F.S.; SERRANO, L.A.L.; COSTA, A.N.; FANTON, C.J.; BRAVIM, A.J.B. ‘Rubi INCAPER 511’ Primeira variedade de mamão do grupo ‘Formosa’ para o Espírito Santo. Vitória: DCM/ Incaper, 2010. (Série Documentos, 178). Disponível em:
<http://biblioteca.incaper.es.gov.br/digital/bitstream/ item/44/1/Folder-Mamao-Rubi.pdf>. Acesso em: 10 jun. 2018. (5)
ENTRINGER, G.C.; VETTORAZZI, J.C.F.; SANTOS, E.A.S.; PEREIRA, M.G.; VIANA, A.P. Genetic gain estimates and selection of S1 progenies based on selection indices and REML/BLUP in super sweet corn. Australian Journal of Crop Science, Lismore, v.10, n.3, p.411-417, 2016. (1)
FERREIRA, J.P.; SCHMILDT, E.R.; SCHMILDT, O.CATTANEO, L.F.ALEXANDRE, R.S.; CRUZ, C.D.
Comparison of methods for classification of the coefficient
of variation in papaya. Revista Ceres, Viçosa, MG, v.63, n.2, p.138-144, 2016a. (1)
FERREIRA, R.T.; VIANA, A.P.; SILVA, F.H.L.; SANTOS, E.A.; SANTOS, J.O. Seleção recorrente intrapopulacional em maracujazeiro-azedo via modelos mistos. Revista Brasileira de Fruticultura, Jaboticabal, v.38, n.1, p.158-166, 2016b. (1)
HAZEL, L.N. The genetic basis for constructing selection indexes. Genetics, Bethesda, v.28, n.6, p.476-490, 1943.
(1)
LEITE, W.S.; PAVAN, B.E.; MATOS FILHO, C.H.A.; ALCANTARA NETO, F.; OLIVEIRA, C.B.; FEITOSA, F.S. Estimativas de parâmetros genéticos, correlações e índices de seleção para seis caracteres agronômicos em linhagens F8 de soja. Comunicata Scientiae, Bom Jesus, v.7, n.3, p.302-310, 2016. (1)
LUZ, L.N.; PEREIRA, M.G.; BARROS, F.R.; BARROS, G.B.; FERREGUETTI, G.A. Novos híbridos de mamoeiro avaliados nas condições de cultivo tradicional e no semiárido brasileiro. Revista Brasileira de Fruticultura, Jaboticabal, v.37, n.1, p.159-171, 2015. (1)
MARTINS, D.S.; COSTA, A.F.S. A cultura do mamoeiro: tecnologias de produção. Vitória: Incaper, 2003. 497 p. Disponível em: <http://biblioteca.incaper.es.gov. br/digital/bitstream/item/924/1/Livro-A-Cultura-do-Mamoeiro-1.pdf> Acesso em: 10 jun. 2018. (5)
MULAMBA, N.N.; MOCK, J.J. Improvement of yield potential of the Eto Blanco maize (Zea mays L.) population by breeding for plant traits. Egypt Journal of Genetics and Cytology, Alexandria,v.7, n.1, p.40-51, 1978. (1)
OLIVEIRA, E.J.; FRAIFE FILHO, G.de A.; FREITAS, J.P.X.de; DANTAS, J.L.L.; RESENDE, M.D.V. de. Plant selection in F2 segregating populations of papaya from commercial hybrids. Crop Breeding and Applied Biotechnology, Viçosa, MG, v.12, n.3, p. 191-198, 2012. )
PEDROZO, C.A.; BENITES, F.R.G.; BARBOSA,
M.H.P.; RESENDE, M.D.V.de; SILVA, F.L. da. Eficiência
de índices de seleção utilizando a metodologia REML/
BLUP no melhoramento da cana-de-açúcar. Scientia Agraria, Curitiba, v.10, n.1, p.31-36, 2009. (1)
PINTO, F.O.; LUZ, L.N.; PEREIRA, M.G.; CARDOSO, D.L.; RAMOS, H.C.C. Metodologia dos modelos mistos
para seleção combinada em progênies segregantes de
mamoeiro. Revista Brasileira de Ciências Agrárias, Recife, v.8, n.2, p.211-217, 2013. (1)
QUINTAL, S. S. R.; VIANA, A. P.; CAMPOS, B. M.; VIVAS, M.; AMARAL JUNIOR, A. T. do. Selection via mixed models in segregating guava families based on yield
and quality traits. Revista Brasileira de Fruticultura, Jaboticabal, v.39, n.2, e-866, 2017. (1)
RAMOS, H.C.C.; PEREIRA, M.G.; VIANA, A.P.; LUZ, L.N.; CARDOSO, D.L.; FERREGUETTI, G.A. Combined selection in backcross population of papaya (Carica papaya L.) by the mixed model methodology.
American Journal of Plant Sciences, Irvine, v.5, n.20, p.2973-2983, 2014. (1)
SHANER, G.; FINNEY, R.E. The effect of nitrogen fertilization on the expression of slow-mildewing resistance in knox wheat. Phytopathology, St Paul, v.67, n.8, p.1051-1056, 1977. (1)
SMITH, H.F. A discriminant function for plant selection.
Annual Eugenics, London, v.7, n.3, p.240-250, 1936. (1)
VIVAS, M.; TERRA, C.E.P.S.; SILVEIRA, S.F.; FONTES, R.V.; PEREIRA, M.G. Escala diagramática para avaliação da severidade de pinta-preta em frutos de mamoeiro. Summa Phytopathologica, Botucatu, v.36, n.2, p.161-163, 2010. (1)
VIVAS, M.; SILVEIRA, S.F. da; PEREIRA, M.G. Prediction of genetic gain from selection indices for disease resistance in papaya hybrids. Revista Ceres, Viçosa, MG, v.59, n.6, p.781-786, 2012. (1)
VIVAS, M.; SILVEIRA, S.F. da; VIVAS, J.M.S.; PEREIRA, M.G. Predição de ganhos genéticos e seleção
de progênies de mamoeiro para resistência à pinta-preta.
Tropical Plant Pathology, Viçosa, MG, v.38, n.2, p.142-148, 2013. (1)
VIVAS, M.; SILVEIRA, S.F.da; VIVAS, J.M.S.; VIANA, A.P.; AMARAL JUNIOR, A.T.do; PEREIRA, M.G.
Seleção de progênies femininas de mamoeiro para resistência a mancha-de-phoma via modelos mistos.