2016 | Lavras | Editora UFLA | www.editora.ufla.br | www.scielo.br/cagro
http://dx.doi.org/10.1590/1413-70542016406027716
Hydrological responses to climate changes in a
headwater watershed
Respostas hidrológicas de uma bacia hidrográfica de cabeceira
às mudanças climáticas
Lívia Alves Alvarenga1*, Carlos Rogério de Mello1, Alberto Colombo1, Luz Adriana Cuartas2, Sin Chan Chou3
1Universidade Federal de Lavras/UFLA, Departamento de Engenharia/DEG, Lavras, MG, Brasil
2Centro Nacional de Monitoramento e Alertas de Desastres Naturais/CEMADEN, São José dos Campos, SP, Brasil 3Centro de Previsão de Tempo e Estudos Climáticos, Cachoeira Paulista, SP, Brasil
*Corresponding author: [email protected] Received in July 7, 2016 and approved in September 28, 2016
ABSTRACT
Climate change impacts need to be considered in water resource planning. This work aims to study of the impacts climate change on Lavrinha headwater watershed, located in the Mantiqueira Range, southeastern Brazil. The impacts from climate change (RCP 8.5 scenario) in the Lavrinha watershed runoff were analyzed based on the “Distributed Hydrology Soil Vegetation Model” (DHSVM), forced with the climate simulated for this future climate change scenario. These simulations, in turn, were generated by the Eta regional climate model coupled to Global Climate Model (GCM) HadGEM2-ES for the 2011-2040, 2041-2070 and 2071-2099 periods. The results of this study showed that the runoff is very sensitive to rising temperatures and reduced precipitation, both projected for the RCP 8.5 scenario. The hydrological simulation projected a reduction in the monthly streamflow between 20 and 77% over the twenty-first century (2011-2099), corresponding to drastic reductions in the runoff behavior and consequently in the water production capacity of the region.
Index terms: Downscaling; Eta model; DHSVM; hydrological impacts.
RESUMO
O impacto das mudanças climáticas precisa ser considerado no planejamento dos recursos hídricos. Este trabalho tem por objetivo o estudo dos impactos das mudanças climáticas na bacia de cabeceira Lavrinha, localizada na Serra da Mantiqueira, Sudeste do Brasil. Os impactos oriundos das mudanças climáticas (cenário RCP 8.5) no escoamento da bacia hidrográfica Lavrinha foram analisados com base no modelo “Distributed Hydrology Soil Vegetation Model” (DHSVM), forçado com as condições climáticas simuladas para este cenário futuro de mudanças climáticas. Estas simulações, por sua vez, foram geradas pelo modelo climático regional Eta acoplado ao Modelo Climático Global (MCG) HadGEM2-ES, nos períodos de 2011–2040, 2041–2070 e 2071–2099. Os resultados deste estudo mostraram que a vazão é bastante sensível ao aumento da temperatura e diminuição da precipitação, ambos projetados para o cenário RCP 8.5. A simulação hidrológica projetou uma redução na vazão mensal entre 20 e 77% ao longo do século XXI (2011 a 2099), correspondendo a reduções drásticas no escoamento e, consequentemente, na capacidade de produção de água da região.
Termos para indexação: Downscaling; modelo Eta; DHSVM; impactos hidrológicos.
INTRODUCTION
Low water availability can cause catastrophic economic, social and environmental problems. Taking into account that the water cycle is affected by possible climate changes and by the vegetation dynamics, the region of the Mantiqueira Range, located in southeastern of Brazil, should be highlighted as an important headwater region in terms of water dynamics (Viola et al., 2015). In addition, the Atlantic forest in these areas is an important biome threatened with extinction. In this context, it is also important to highlight water shortages that occurred in southeastern of Brazil in hydrological
years 2013/2014 and 2014/2015 which caused water supply problems for the population (Coelho et al., 2015).
Climate projections of the fifth report of the
In all RCPs, CO2 concentrations in the atmosphere will be higher in 2100 compared with the present period, before 2005. In the AR5, the emission scenarios refer to radiative forcing levels at the end of the XXI century.
The RCPs are identified by the total radiative forcing in
2100, that is, 2.6 Wm-2 for RCP 2.6 scenario (mitigation
scenario), 4.5 Wm-2 and 6.0 Wm-2 for the RCP 4.5 and
for RCP 6.0 scenarios (stabilization scenarios) and 8.5 Wm-2 for the RCP 8.5 scenario (high greenhouse gas
concentrations) (Van Vuuren et al., 2011).
Climate change involves complex interactions and possibilities of various impacts on water and energy balance, even in small watersheds. Thus, the use of hydrological models has been a very effective tool to support decisions about the future of water resources (Mello et al., 2016). The Distributed Hydrology Soil Vegetation Model (DHSVM) is a physical-distributed model tested and validated in mountainous areas in the state of Montana, USA, notably in the Middle Fork Flathead watershed (Wigmosta; Vail; Lettenmaier, 1994). In an overview, the effects of climate changes on water resources have been studied using DHSVM with different downscaling of climate change data (Dickerson-Lange; Mitchell, 2014; Leung; Wigmosta, 1999; Safeeq; Fares, 2012). Thus, the DHSVM was applied to forecast
streamflows in the Igarapé Asu watersheds (watersheds of
0.95, 6.58 and 12.43 km2) in Amazonia central (Cuartas
et al., 2012) and Bocaina river (drainage area of 251.36 km2), in São Paulo (Kruk et al., 2009). However, in Brazil,
this is the first work applied to climate changes, variability and projections in the annual and monthly streamflow of a
headwater watershed, using this model, which is suitable for watersheds in mountainous regions.
Thus, the objective of this study is to evaluate
the hydrologic impacts on the streamflow of Lavrinha
watershed using the DHSVM simulations associated with future climate-RCP 8.5 scenario (with radiative forcing of 8.5 W m-2) designed by the Eta regional climate
model, which in turn is based on the downscaling of the HadGEM2-ES model projections (Chou et al., 2014a, b).
MATERIAL AND METHODS
Study area
The Lavrinha Watershed (LW) has a 6.76 km2
drainage area and is located in the Mantiqueira Range, southeastern Minas Gerais, in the watershed of the Upper Grande River, which is an important river for the generation of electricity in the country. It is also important
to emphasize that the hydrological conditions of the watersheds in this region are fundamental information to analyze the possible climate changes projected by hydrological models. The Digital Elevation Model (DEM) of LW, with a resolution of 30 meters, is shown in Figure 1.
With average precipitation close to 2045 mm per year observed between 2006 and 2010, the LW has the rainy season between October and March and the dry season between April and September. The climate in this
watershed, according to Koppen classification is the Cwb
type (mesothermal) (Mello et al., 2012). The predominant soil class is Cambisol and most of the land is covered by Atlantic forest (Menezes et al., 2014; Pinto et al., 2015).
Climate projections for the study
Initially, the Eta model at 20-km horizontal resolution was nested to the HadGEM2-ES. These runs are described in Chou et al. (2014 a, b). These authors used
a modified version of the Eta regional model (CPTEC/
INPE) obtained from Mesinger et al. (2012). Climatic data available for this study were obtained from the Eta regional model nestled in the General Circulation Model (GCM)
Figure 1: Location of the INMET stations, DEM, and grid
infiltration mechanisms. Wigmosta, Vail and Lettenmaier,
(1994) presented the DHSVM equations in detail.
Input data for DHSVM
Data from Eta/HadGEM2-ES simulations were available at intervals of three hours. Thus, the Distributed Hydrology Soil Vegetation Model (DHSVM) was fed in the same interval with atmospheric variables in a spatial grid of 5 km. The climatic data of the central points of the cells to feed the hydrologic model were extracted. DHSVM requires the following meteorological inputs: precipitation (m), temperature (Cº), wind speed (m s-1),
relative humidity (%), shortwave and longwave solar radiation (W m-2).
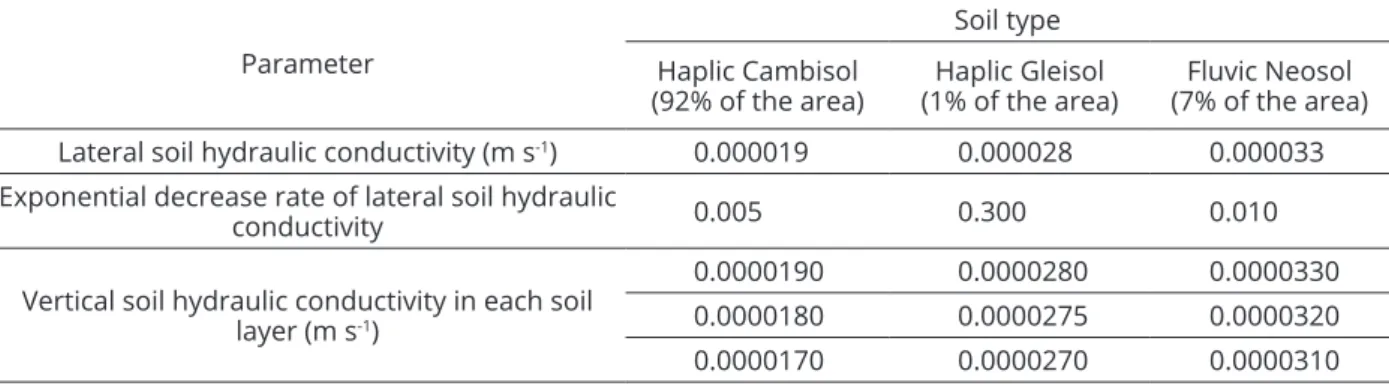
In this study, the grid cell size in DHSVM is 30 m x 30 m. The vegetation types are Atlantic Forest (63% of the area) and pasture (37% of the area) in the LW. Vegetation parameters were not changed in the calibration. There are three types of soils and based on the sensitivity analysis of DHSVM, lateral and vertical soil hydraulic conductivity and exponential decrease rate of lateral soil hydraulic conductivity were used to calibrate the model. Final DHSVM sensitive soil parameters at the end of the calibration were summarized in Table 1. All soil and vegetation parameters were based on literature (e.g. Ávila et al., 2014; Cuartas et al., 2012; Junqueira Junior et al., 2008; Wigmosta; Vail; Lettenmaier, 1994) and details can be found in Alvarenga et al. (2016).
Hydrologic simulations with DHSVM
In the calibration and validation of DHSVM we used the climate data of a climatological station, located at average LW altitude. An hourly time step was used and the period of January 1, 2005 to September 30, 2006 was selected as the stabilization period (warm up) of the model. For calibration, we selected the period from October 1, 2006 to September 30, 2008. Finally for validation we selected the period from October 1, 2008 to September 30, 2010.
The streamflow in the LW was monitored by means of an automatic water level gauge that recorded the water depth in the control section of the basin. Thus, by means of the stage-discharge rating curve obtained in
field campaigns, it was possible to generate the observed streamflow data. The model was calibrated and validated manually searching for a fit between the simulated and observed streamflow (daily and monthly averages) in LW. Thus, the performance of the model was verified based on assessments of the coefficient of determination (R2) and
Nash-Sutcliffe efficiency (E).
HadGEM2-ES (Hadley Centre Global Environmental Model) to simulate the present climate (1961-1990 period) and the climate future-RCP 8.5 scenario over the
twenty-first century (2011-2099 period) for all South America
and Central America. The 5-km Eta model simulations are produced from a second nesting of the Eta model into the HadGEM2-ES.
The resulting simulations of the Eta model nestled in simulations of the HadGEM2-ES model will, hereafter, be called Eta/HadGEM2-ES. For Eta/HadGEM2-ES simulations analysis performance from 1961 to 1990, they were compared with observed values (climatological normal of the Instituto Nacional de Meteorologia-INMET (Ramos; Santos; Fortes, 2009)) of precipitation and temperature (quarterly average). The nearest stations and with similar altitudes to the studied region are: Barbacena-B (Code: 83689), São Lourenço-SL (Code: 83736) and Campos do
Jordão-CJ (Code: 83714) (Figure 1). After verification of the
simulated present climate, we obtained the future projection
of the simulated streamflow for the 2011-2040, 2041-2070
and 2071-2099 periods.
As the observed data are from regions close to the region of this study, the correction of simulated temperature and precipitation data (correction bias) was not feasible, however, in the work of Chou et al. (2014 a) the simulations of the Eta/HadGEM2-ES were compared to observed data from regions near the present study and the simulations reproduced the climatic characteristics of this region well.
Distributed Hidrology Soil Vegetation Model (DHSVM)
The DHSVM is a physically based model that provides an integrated dynamic representation of basin processes in the spatial scale described by the Digital Elevation Model (DEM). The model solves the water and energy balance for each grid cell, at each time step.
T h e D H S V M u s e s a t w o - l a y e r c a n o p y model (overstory and understory) for calculating evapotranspiration using the Penman-Monteith equation. The soil surface can receive water from total precipitation, throughfall or surface flow from adjacent cells. The maximum infiltration rate determines the maximum
amount of water that can infiltrate at every time step. The
water movement in the unsaturated soil is simulated using a model of several layers and each vegetation layer can extract water from one or more soil layers. The percolation is calculated by Darcy’s law, using the Brooks-Corey equation to estimate the hydraulic conductivity. The
Van Liew, Arnold and Garbrecht, (2003) suggest that R2 values higher than 0.50 are considered acceptable. The
criteria proposed by Moriasi et al. (2007) was adopted for E, whose values from 0.50 upward qualify as acceptable
and fit satisfactorily. Safeeq and Fares (2012) also reported
that E values greater than 0.35 and less than 0.50 indicate average DHSVM performance; values between 0.50 and
0.70 indicate a good performance; and finally values greater
than 0.70 indicate a very good performance (to daily values).
Climate models: HadGEM2-ES Global and Eta/INPE Regional
The physical configuration of the HadGEM2-ES
model is derived from the HadGEM1 model, however, the HadGEM2-ES model is more complete and sophisticated, having an atmospheric component of 38 levels with a resolution of 1.274º of latitude and 1.875º of longitude. The oceanic component has 40 levels in the vertical and horizontal, the resolution varies from 1/3º in the tropics to 1º degree in the latitudes above 30º (Collins et al., 2011).
The downscaling of the simulations carried out by the HadGEM2-ES model was produced by the Eta/INPE regional model, in the LW region. The version of the model (Eta) used in this study was developed for studies of climate changes in the South America (Pesquero et al., 2010; Chou et al., 2012) and received updates regarding the dynamic and physics of the model, which are described in Mesinger et al. (2012) and are incorporated in the version of the model for climate change studies (Chou et al., 2014a, b). Details about the Eta model/HadGEM2-ES and of climate change modeling in South America can be obtained in the studies developed by Chou et al. (2014a, b).
The study area was covered with six points corresponding to the horizontal resolution of 5 km. The atmosphere is represented in the vertical until the pressure level of 25 hPa, with 38 levels.
Future climate change scenario - RCP 8.5
Until the end of the century, the radiative forcing in the RCPs 2.6, 4.5, 6.0, and 8.5, account for Approximately 490, 650, 850, and 1370 ppm of concentration of CO2 equivalent, respectively (Van Vuuren et al., 2011). Thus, the RCP 8.5 scenario is the highest of all RCPs in terms of greenhouse gas emissions (IPCC, 2013). Emissions of greenhouse gases in the RCP 8.5 scenario continues to rise after the end of the
twenty-first century as a result of the high intensity of energy
sector and of land use, and also due to population increase associated with high demand for food (Riahi et al., 2011).
RESULTS AND DISCUSSION
Projections of the Eta/HadGEM2-ES model
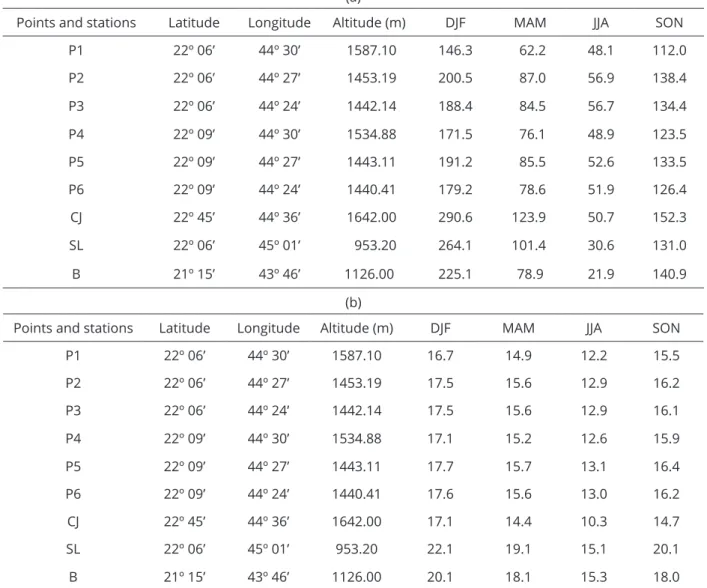
Tables 2 (a) and (b) show the points 1, 2, 3, 4, 5 and 6 (P1, P2, P3, P4, P5 and P6) of the grid box of the Eta/ HadGEM2-ES simulations and of the Campos do Jordão (CJ), São Lourenço (SL) and Barbacena (B) stations, which are the nearest and with climatic conditions similar to those observed in the LW. The Barbacena and Campos do Jordão stations showed, respectively, observed data of monthly total precipitation and temperature closer to those simulated by the Eta/HadGEM2-ES for the 1961-1990 period.
The simulated and observed values showed that the rainy season presents maximum quarterly total precipitation and temperature values during the summer months of December, January and February (DJF). The dry season has quarterly minimum temperature and total precipitation values during the winter months of June, July and August (JJA). These results suggest that the quarterly average data of total precipitation and temperature projected by simulations Eta/HadGEM2-ES were able to capture the seasonal variation patterns during the 30-year period, from 1961 to 1990 (Table 2 (a) and (b)).
Table 1: Final soil parameters values for DHSVM.
Parameter
Soil type Haplic Cambisol
(92% of the area) (1% of the area)Haplic Gleisol (7% of the area)Fluvic Neosol Lateral soil hydraulic conductivity (m s-1) 0.000019 0.000028 0.000033
Exponential decrease rate of lateral soil hydraulic
conductivity 0.005 0.300 0.010
Vertical soil hydraulic conductivity in each soil layer (m s-1)
Due to the complex and non-linear nature of the system there are many uncertainties involved in this study. Chou et al. (2014 a) also showed that the regions of complex topography, or in forests of difficult access, errors of climate simulations are associated with sparse distribution of observed data in Brazil (for comparisons). Still, evaluations of Eta simulations nested with HadGEM2-ES, BESM and
MIROC5 GCMs in the 1961-1990 period showed that the Eta/HadGEM2-ES performed well in the summer (DJF) and winter (JJA) seasons in south-central Brazil.
T h u s , E t a / H a d G E M 2 - E S c l i m a t e c h a n g e simulations were considered suitable for a better understanding of the impacts, projected by the RCP 8.5 scenario, on the hydrologic response of LW.
Table 2: Quarterly average precipitation (mm) in (a) and quarterly average temperature (ºC) in (b) of the simulated
points (P1, P2, P3, P4, P5 and P6) and of the INMET stations [(Campos do Jordão (CJ), São Lourenço (SL) and Barbacena (B), in the 1961-1990 period (present climate)].
(a)
Points and stations Latitude Longitude Altitude (m) DJF MAM JJA SON
P1 22º 06’ 44º 30’ 1587.10 146.3 62.2 48.1 112.0
P2 22º 06’ 44º 27’ 1453.19 200.5 87.0 56.9 138.4
P3 22º 06’ 44º 24’ 1442.14 188.4 84.5 56.7 134.4
P4 22º 09’ 44º 30’ 1534.88 171.5 76.1 48.9 123.5
P5 22º 09’ 44º 27’ 1443.11 191.2 85.5 52.6 133.5
P6 22º 09’ 44º 24’ 1440.41 179.2 78.6 51.9 126.4
CJ 22º 45’ 44º 36’ 1642.00 290.6 123.9 50.7 152.3
SL 22º 06’ 45º 01’ 953.20 264.1 101.4 30.6 131.0
B 21º 15’ 43º 46’ 1126.00 225.1 78.9 21.9 140.9
(b)
Points and stations Latitude Longitude Altitude (m) DJF MAM JJA SON
P1 22º 06’ 44º 30’ 1587.10 16.7 14.9 12.2 15.5
P2 22º 06’ 44º 27’ 1453.19 17.5 15.6 12.9 16.2
P3 22º 06’ 44º 24’ 1442.14 17.5 15.6 12.9 16.1
P4 22º 09’ 44º 30’ 1534.88 17.1 15.2 12.6 15.9
P5 22º 09’ 44º 27’ 1443.11 17.7 15.7 13.1 16.4
P6 22º 09’ 44º 24’ 1440.41 17.6 15.6 13.0 16.2
CJ 22º 45’ 44º 36’ 1642.00 17.1 14.4 10.3 14.7
SL 22º 06’ 45º 01’ 953.20 22.1 19.1 15.1 20.1
B 21º 15’ 43º 46’ 1126.00 20.1 18.1 15.3 18.0
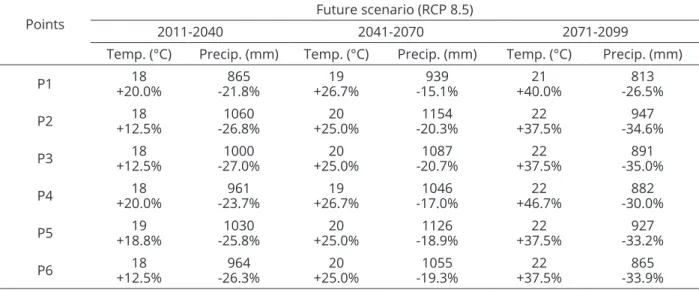
In Table 3, it is possible to note that the annual temperature and annual total precipitation averages designed by Eta/HadGEM2-ES in the RCP 8.5 scenario showed, respectively, an increase and decrease (in %) over
the twenty-first century, in points P1, P2, P3, P4, P5 and P6.
The average annual results indicated that by the end of the
twenty-first century the warming reached 7 °C (+46.7%)
and the total precipitation was reduced by up to 479 mm (-35.0%) compared to the present climate simulated by the Eta/HadGEM2- ES (1961-1990).
Variations of temperature and precipitation simulated for the 2011-2040, 2041-2070 and 2071-2099 periods (future scenario-RCP 8.5) are consistent with the trends shown in the study of Chou et al. (2014b), designed by Eta/HadGEM2-ES, for Southeast Brazil. These authors also suggest that the large reduction in precipitation in the region, particularly during December, January and February, may be associated with a decrease of both the occurrence frequency, as well as the intensity of the episodes, for the South Atlantic Convergence Zone (SACZ) in summer. The reduction of the occurrence frequency and activity of SACZ is also in line with the
intensification of the subtropical high pressure that can
block the passage of cold fronts in the region.
Hydrologic simulation with DHSVM
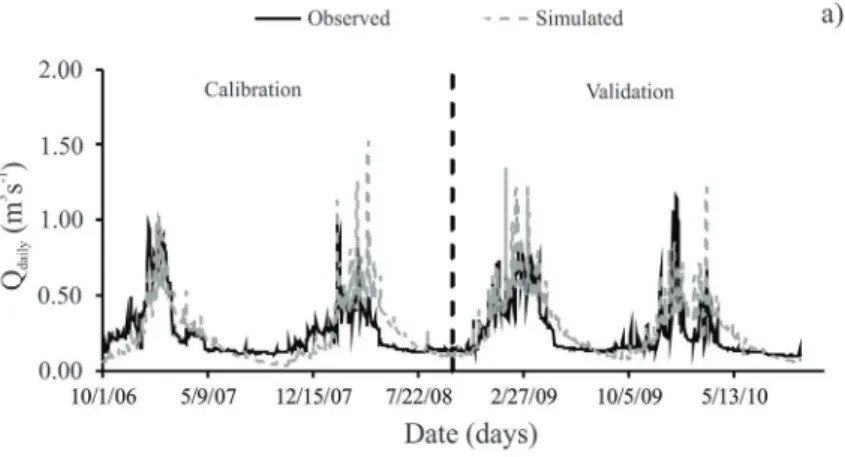
In Figures 2 (a) and (b) the daily and monthly streamflow simulated by DHSVM are reasonable
according to the streamflow observed (2006-2010). These
figures also expressed the results of the precision statistics
(coefficient of determination-R2 and Nash-Sutcliffe
efficiency-E) to evaluate the performance of DHSVM in the simulation of daily and monthly streamflow of the
LW in the calibration and validation period. The statistical indices values were considered appropriate according to
the classification of Van Liew, Arnold and Garbrecht,
(2003), Moriasi et al. (2007) and Safeeq and Fares (2012). Analysis in monthly time steps is used in most studies of climate changes impacts (Leung; Wigmosta, 1999; Viola et al., 2015); however, these studies simplify some numerical processes because the objective is to evaluate the impacts on hydrology in average terms. Thus, DHSVM was calibrated in the daily and monthly time step in this study because if the model is calibrated for daily time step with good results, the monthly time step is good enough as well.
The observed average annual streamflow in the LW was 0.25 m3s-1 during the 2006-2010 period
(with an average annual precipitation observed of 2045
mm). In this study the average annual streamflow and
precipitation simulated by DHSVM were 0.16 m3s-1 and
1326 mm, respectively, during the 1961-1990 period (present climate). Therefore, although the average annual streamflow comparisons are in different periods, the
underestimation of the simulated streamflow shows that
there are errors and uncertainties in these simulations. Nevertheless, the observed and simulated values are in order of comparable magnitude. In Table 2 (a), the underestimation of the simulated precipitation during the summer (DJF) corroborates these statements.
Table 3: Changes in the annual temperature (Temp.) And total precipitation (Precip.) averages in %, projected
by the Eta / HadGEM2-ES model for the future scenario (RCP 8.5) in comparison to present climate (1961-1990).
Points
Future scenario (RCP 8.5)
2011-2040 2041-2070 2071-2099
Temp. (°C) Precip. (mm) Temp. (°C) Precip. (mm) Temp. (°C) Precip. (mm)
P1 +20.0%18 -21.8%865 +26.7%19 -15.1%939 +40.0%21 -26.5%813
P2 +12.5%18 -26.8%1060 +25.0%20 -20.3%1154 +37.5%22 -34.6%947
P3 +12.5%18 -27.0%1000 +25.0%20 -20.7%1087 +37.5%22 -35.0%891
P4 +20.0%18 -23.7%961 +26.7%19 -17.0%1046 +46.7%22 -30.0%882
P5 +18.8%19 -25.8%1030 +25.0%20 -18.9%1126 +37.5%22 -33.2%927
During the 1961-1990 period the average annual runoff was 753 mm. For the RCP 8.5 future scenario, during the periods of 2011-2040, 2041-2070 and
2071-2099, the average annual streamflows were respectively
0.06 m3s-1 (282 mm), 0.07 m3s-1 (330 mm) and 0.05
m3s-1 (235 mm), i.e. a reduction of 63, 56 and 69%,
respectively, compared to the 1961-1990 period. These reductions can produce very severe impacts on water availability in the region as a whole, and consequently in the generation of electricity from the Upper Grande River region.
Precipitation (interpolated precipitation data) and monthly average streamflows simulated by DHSVM in the LW for 1961-1990 (present climate), 2011-2040, 2041-2070 and 2071-2099 (future climates)
are shown in Figures 3 (a) and (b) and Figures 4 (a) and (b). The seasonality of the average monthly streamflow for all periods remained consistent with the seasonality of the average monthly precipitation. In general, the maximum simulated streamflows were between October and March and the minimum between the months of April and September (Figures 3 (a) and (b) and Figures 4 (a) and (b)).
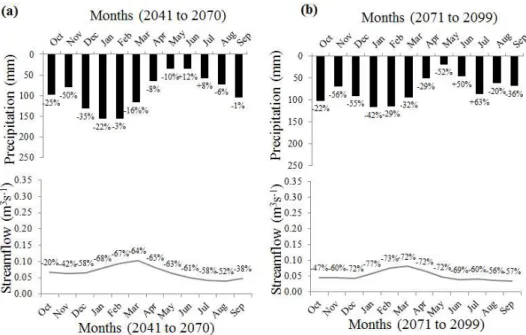
In the future scenario-RCP 8.5 (2011-2040, 2041-2070 and 2071-2099), only in the months of June and July did the precipitation show an increase between 8 and 63%, respectively. For the other months of the year the monthly
precipitation and streamflow showed the same reduction
trend, on average, for the present climate (Figure 3 (b) and Figures 4 (a) and (b)).
Figure 2: Daily (a) and monthly (b) observed and simulated streamflows during the calibration (October 1, 2006
In relation to the present climate, the future
projections of average monthly simulated streamflows
showed a decrease of up to 65% (April), 68% (January) and 77% (January) during the periods 2011-2040, 2041-2070
and 2071-2099 (future scenario-RCP 8.5), respectively. Therefore, the greatest impacts on the LW hydrology could occur at the end of the XXI century (2071- 2099) (Figure 3 (b) and Figures 4 (a) and (b)).
Figure 3: Monthly precipitation (mm month-1) and streamflow averages (m3s-1) simulated by DHSVM in the LW,
for the present climate (1961-1990) in (a) and for the future climate projection during 2011-2040 simulated by the Eta/HadGEM2-ES model (RCP 8.5 scenario) in (b).
Figure 4: Monthly precipitation and streamflow averages simulated by DHSVM in LW for the future climate
The results also showed that the LW hydrology is
strongly influenced by the wet season. Thus, the positive
effects regarding the increase in precipitation in the dry season were less pronounced than in the rainy season (Figure 3 (b) and Figures 4 (a) and (b)).
Safeeq and Fares (2012), using DHSVM, studied the climate sensitivity of the hydrological components in a watershed in Hawaii, United States, whose drainage area is 13.84 km2. The authors simulated the hydrologic response
for 43 years, taking into account future scenarios of the AR4. For the climate scenario A1FI (high emission of greenhouse
gases) they verified that the increase of 6.4 °C in the air temperature reduced 2.6% of the average annual streamflow,
and a 20% decrease in the precipitation resulted in a decline
of up to 50% in the annual streamflow of the watershed.
Other authors, like Dickerson-Lange and Mitchell (2014), also combined climate change simulations of three GCMs of the AR4 (GISS, Echam and IPSL) with the DHSVM to assess the impacts on the Nooksack River watershed, in the State of Washington, United States. This watershed has an area of 2000 km2. It
was found that from 2000 to 2075 the future climate projections indicated an increase of the average monthly temperature in summer of up to 5.2 ºC and variation in the precipitation changes in different seasons. Simulated
future streamflow indicated an increase in the winter up
to 88% and decrease in summer up to 50%.
Viola et al. (2015) also evaluated the possible hydrological changes in the watershed of the Rio Grande, in the state of Minas Gerais, Brazil. This study covered a larger area (watershed with drainage area of 2095, 2080, 7325 and 4178 km2). In the hydrologic simulations the
Lavras Simulation of Hydrology (LASH) model was used associated with the simulations of the Eta/HadCM3 to the A1B emission scenario of the AR4 in the
twenty-first century. Although the study cited was done in the
same study area as this present work, the results of both surveys indicated different hydrologic trends. Between 2011 and 2040, the results of Viola et al. (2015) showed
that a reduction may occur in the annual streamflow.
However after 2041 the projections indicated that with the increasing precipitation over the XXI century there
may occur an increase in the mean annual streamflow
(Marengo et al., 2012).
It is valid to emphasize that the future climate scenario A1B (AR4) can be considered as an intermediate scenario between the A2 scenario (high greenhouse gas emissions) and B2 scenario (low greenhouse gas emissions). In this present study the future climate scenario-RCP 8.5 (AR5) was used, which has radiative
forcing corresponding, approximately, to the A2 scenario (AR4). Therefore the differences in the hydrologic trend behavior of this study (Eta/HadGEM2-ES, RCP 8.5)
compared to that verified by Viola et al. (2015) (Eta/
HadCM3, A1B) highlight the necessity of developing more regional studies using different GCMs for climate projections of different future scenarios.
Finally, in the present study the reduction in the
monthly and annual average streamflows is due to the
increase and decrease in the monthly average temperature and precipitation in the region of this study. These changes in the streamflow (on a micro-scale) that depend on future temperature and precipitation have a high degree of uncertainty. However, despite the uncertainties of the simulated projections, the results presented provide an indication of how the hydrological conditions of the LW may change in a possible future scenario of high greenhouse gas emissions. Moreover, it is also important to emphasize that this is a pioneering study of one of the most important headwater regions of the Brazil (Mantiqueira Range).
In general, the results indicate drastic changes in the hydrologic response of the LW in all months of the year and in the annual average. Therefore, it should be noted here that the mitigation of greenhouse gases is an important target to be considered for the future of water resources in this region.
CONCLUSIONS
In the future climate-RCP 8.5 scenario, changes
projected over the twenty-first century resulted in annual and monthly average streamflow reduction of up to 69
will the possibility of obtaining more members of a set of projections to estimate uncertainty of the predicted values. In subsequent studies, for better vulnerability analysis regarding projected impacts, the development of hydrological simulations involving other future climate scenarios also can be suggested.
ACKNOWLEDGEMENTS
We would like to thank the CAPES Foundation for the visiting scholarship (doctoral research) at Purdue University (Process 99999.014035/ 2013-08), and FAPEMIG for the doctorate scholarship provided to the
first author. Acknowledgments to MCTI and PNUD by
project BRA/10/G32 for support in the generation of regionalized scenarios. Acknowledgments to the CNPq for partial funding through 308035/2013-5, 400792/2012-5 and 457874/2014-7 projects.
REFERENCES
ALVARENGA, L. A. et al. Assessment of land cover change on the hydrology of a Brazilian headwater watershed using the Distributed Hydrology-Soil-Vegetation Model. CATENA.
143:7-17, 2016.
ÁVILA, L. F. et al. Partição da precipitação pluvial em uma microbacia hidrográfica ocupada por Mata Atlântica na Serra da Mantiqueira, MG. Ciência Florestal. 24(3): 583-595, 2014.
CHOU, S. C. et al. Evaluation of the Eta simulations Nested in Three Global Climate Models. American Journal of Climate Change. 3(5):438-454, 2014a.
CHOU, S. C. et al. Assessment of climate change over South America under RCP 4.5 and 8.5 downscaling scenarios. American Journal of Climate Change. 3(5):512-525, 2014b.
CHOU, S. C. et al. Downscaling of South America present climate driven by 4-member HadCM3 runs. Climate Dynamics.
38(3-4):635-653, 2012.
COELHO, C. A. et al. The 2014 southeast Brazil austral summer drought: Regional scale mechanisms and teleconnections. Climate Dynamics. 46(11): 3737-3752, 2015.
COLLINS, W. J. et al. Development and evaluation of an Earth-system model–HadGEM2. Geoscientific Model Development. 4(4):1051-1075, 2011.
CUARTAS, L. A. et al. Distributed hydrological modeling of a micro-scale rainforest watershed in Amazonia: Model evaluation and advances in calibration using the new HAND
terrain model. Journal of Hydrology. 462-463:15-27, 2012.
DICKERSON-LANGE, S. E.; MITCHELL, R. Modeling the effects of climate change projections on streamflow in the Nooksack River basin, Northwest Washington. Hydrological Processes. 28(20):5236-5250, 2014.
FLATO, G. et al. The Physical Science Basis. In: STOCKER, T. F. et al. (ed). Contribution of working group I to the fifth
assessment report of the intergovernmental panel on climate change. United Kingdom and New York: Cambridge University Press, Cambridge, 2013. 1535p.
INTERGOVERNMENTAL PANEL ON CLIMATE CHANGE - IPCC. Summary for policymakers. In: Climate change 2013. The physical science basis. Cambridge: Cambridge University Press, 2013. 571p.
JUNQUEIRA JUNIOR, J. A. et al. Continuidade espacial de atributos físico-hídricos do solo em sub-bacia hidrográfica de cabeceira. Ciência e Agrotecnologia. 32(3):914-922, 2008.
KRUK, N. S. et al. Análise de sensibilidade do modelo hidrológico distribuído DHSVM aos parâmetros de vegetação. Revista Brasileira de Recursos Hídricos. 14(1):75-84, 2009.
LEUNG, L. R.; WIGMOSTA, M. S. Potential climate change impacts on mountain watersheds in the Pacific Northwest. Journal of the American Water Resources Association.
35(6):1463-1471, 1999.
MARENGO, J. A. et al. Development of regional future climate
change scenarios in South America using the Eta CPTEC/
HadCM3 climate change projections: Climatology and regional analyses for the Amazon, São Francisco and the Paraná River basins. Climate Dynamics. 38(9-10):1829-1848, 2012.
MELLO, C. R. de et al. Sea surface temperature (SST) and rainfall erosivity in the Upper Grande River Basin, Southeast Brazil. Ciência e Agrotecnologia. 36(1):53-59, 2012.
MELLO, C. R de et al. Agricultural watershed modeling: A review for hydrology and soil erosion processes. Ciência e Agrotecnologia. 40(1):7-25, 2016.
MENEZES, M. D. de et al. Solum depth spatial prediction
comparing conventional with knowledge-based digital
soil mapping approaches. Scientia Agricola.
71(4):316-323, 2014.
MORIASI, D. N. et al. Model evaluation guidelines for systematic quantification of accuracy in watershed simulations. Transactions of the ASABE. 50(3):885-900, 2007.
PESQUERO, J. F. et al. Climate downscaling over South America for 1961–1970 using the Eta model. Theoretical and applied climatology. 99(1-2):75-93, 2010.
PINTO, L. C. et al. Micromorphology and pedogenesis of mountainous inceptisols in the Mantiqueira range (MG). Ciência e Agrotecnologia. 39(5):455-462, 2015.
RAMOS, A. M.; SANTOS, L. A. R.; FORTES, L. T. G. Normais climatológicas do Brasil 1961-1990. DF: INMET, 2009. 465p.
RIAHI, K. et al. RCP 8.5—A scenario of comparatively high
greenhouse gas emissions. Climatic Change.
109(1-2):33-57, 2011.
SAFEEQ, M.; FARES, A. Hydrologic response of a Hawaiian watershed to future climate change scenarios. Hydrological processes. 26(18):2745-2764, 2012.
VAN LIEW, M. W.; ARNOLD, J. G.; GARBRECHT, J. D. Hydrologic simulation on agricultural watersheds: Choosing between two
models. Transactions of the ASAE. 46(6):1539-1551, 2003.
VAN VUUREN, D. P. et al. The representative concentration pathways: An overview. Climatic Change. 109(1):5-31, 2011.
VIOLA, M. R. et al. Assessing climate change impacts on Upper Grande River Basin hydrology, Southeast Brazil. International Journal of Climatology. 35(6):1054-1068, 2015.