http://dx.doi.org/10.1590/s2175-97902017000216138
A
r
*Correspondence: R. M. Mainardes. Departamento de Farmácia. Laboratório de Nanotecnologia Farmacêutica. Universidade Estadual do Centro-Oeste – UNICENTRO. Rua Simeão Camargo Varela de Sá, 03 - 85040-080 - Guarapuava – PR, Brasil. E-mail: [email protected]
A stability-indicating HPLC-PDA method for the determination
of ferulic acid in chitosan-coated poly(lactide-co-glycolide)
nanoparticles
Isabela Angeli de Lima, Najeh Maissar Khalil, Rubiana Mara Mainardes
*Department of Pharmacy, Laboratory of Pharmaceutical Nanotechnology, Universidade Estadual do Centro-Oeste/ UNICENTRO, Guarapuava, PR, Brazil
The development and validation of a simple and eicient method for the quantiication of ferulic acid in poly (D,L-lactide-co-glycolide) (PLGA) nanoparticles coated with chitosan (CS) by reverse phase high performance liquid chromatography coupled to photodiode array detection was described. For the chromatographic analysis, a reverse phase C-18 column was used, mobile phase consisting of acetonitrile and 0.5% acetic acid (37:63, v/v), isocratically eluted at a low rate of 1 mL/min. Drug determination was performed at 320 nm. The method was validated in terms of the selectivity, linearity, precision, accuracy, robustness, limits of detection and quantiication. The method was linear in the range of 10 to 100 μg/mL (r=0.999) and presented limit of detection and quantiication of 102 ng/mL and 310 ng/mL, respectively. The method was precise (intra and inter-day) based on relative standard deviation values (less than 3.20%). The recovery was between 101.06 and 102.10%. Robustness was demonstrated considering change in mobile phase proportion. Speciicity assay showed no interference from the components of nanoparticles or from the degradation products derived from acidic and oxidative conditions. The proposed method was suitable to be applied in determining the encapsulation eiciency of ferulic acid in PLGA-CS nanoparticles and can be employed as stability indicating one.
Uniterms: Nanoparticles. Ferulic acid/encapsulation eiciency. Ferulic acid/quantiication. Stability. High performance liquid chromatography/validation. PLGA-poly(lactide-co-glycolide)/nanoparticles. Chitosan.
INTRODUCTION
Trans ferulic acid (FA) [(E) -3- (4-hydroxy-3 - m e t h o x y - p h e n y l ) p r o p y l - 2 - e n o i c a c i d ] i s a hydroxycinnamic acid and polyphenolic present in a variety of cereals, fruits and vegetables, such as rice,
cofee, wheat, apple, peanut (Wu et al., 2014), artichoke, eggplant and corn meal (Trombino et al., 2013). It presents bonded to the cell wall of plants, usually linked to proteins and polysaccharides, thus, it is rarely found in its free form (Aceituno-Medina et al., 2015). Studies
indicate the potential use of FA as anti-inlammatory,
antithrombotic, antitumor, antiviral, immunoprotective, antibacterial, protector against ultraviolet rays and
especially as antioxidant (Kim et al., 2013; Lima, Duarte, Esteves, 2013; Yang, Song, 2015). However, FA
has some limitations that afect its therapeutic eicacy
when orally administered. It presents broad hepatic metabolism (Trombino et al., 2013), reduced half-life,
low aqueous solubility (Zhou et al., 2015), reduced ability to penetrate biological membranes (Trombino et al., 2013; Yang, Song, 2015), instability against oxidation and low cellular uptake (Kim et al., 2013). An alternative to overcome physicochemical, biopharmaceutical and pharmacokinetics drawbacks of drugs administered by oral route is the use of nanocarrier systems, such as the polymeric nanoparticles.
Polymeric nanoparticles improve drug absorption
and bioavailability, promote prolonged and/or speciic
important step to ensure the therapeutic efficacy. The amount of drug-loaded in nanoparticles, drug stability
and drug delivery proile must be adequately determined,
and thus, suitable and validated analytical methods are necessary (Das Neves et al., 2010).
FA has been quantiied by many analytical methods, such as high-performance liquid chromatography
(HPLC) coupled with photodiode array wavelength detector (PDA) or UV-Vis detector (Anselmi et al., 2006; Craparo et al., 2009; Kareparamban et al., 2013; Li et al., 2007; Li et al., 2004; Li, Bi, 2003; Lu et al., 2005; Nadal et al., 2015; Picone et al., 2009; Qi et al., 2007; Wang et al., 2011), liquid chromatography
tandem mass spectrometry (Guy et al., 2009; Wang et al., 2013; Zhang et al., 2009), UV-Vis spectroscopy
(Lima et al., 2013; Merlin et al., 2012), thin layer chromatography (Mabinya, Mafunga, Brand, 2006), high-performance thin layer chromatography (Hingse, Digole, Annapure, 2014; Srivastava, Singh, Singh Rawat, 2012), gas chromatography (Olthof et al., 2003), chemiluminescence (Shen et al., 2013), capillary electrophoresis (Lima, Duarte, Esteves, 2007), micellar electrokinetic chromatography (Guo et al., 2003), electrochemical analysis (Vilian, Chen, 2014) and paper-based platforms (Tee-Ngam et al., 2013). However, HPLC is considered the most reliable and popular methodology for investigating phenolic acids (Barberousse et al., 2008).
Moreover, most of these studies are about
quantification of FA coupled with other phenolic
compounds or other components extracted from plants (Andreasen et al., 2000; Guo et al., 2003; Sen et al., 1991;
Srivastava, Singh, Singh Rawat, 2012; Vichapong et al.,
2010; Waldron et al., 1996), or about the quantiication of
FA in rat plasma (Li, Bi, 2003; Qi et al., 2007; Rondini et al., 2004). There are few studies about the analysis of FA in products with pharmaceutical potential and among these are even rarer those with a documented validation study (Nadal et al., 2015). Some studies show the determination of FA in lipid nanoparticles (Bondi et al., 2009; Carbone et al., 2014; Trombino et al., 2013), metallic (Vilian, Chen, 2014), magnetic (Saikia et al., 2013) and in poly(lactide-co-glycolide) (PLGA) nanoparticles by UV spectrophotometer (Merlin et al., 2012).
Thus, aiming the adequate characterization of
the FA-loaded nanoparticles and to supply the lack of
suitable validated methods for quantification of FA in
pharmaceutical dosages, in this work it was developed and validated a simple and fast analytical methodology
by reverse phase HPLC-PDA to quantify FA in PLGA
nanoparticles coated with chitosan (CS).
MATERIAL AND METHODS
Chemical and reagents
C S ( m e d i u m m o l e c u l a r w e i g h t , 7 5 - 8 5 %
deacetylated), FA (99% purity), PLGA (65:35,
40000-75000 Da), and polyvinyl alcohol (PVA, 31KDa, 88% hydrolyzed) were purchased from Sigma Aldrich (St. Louis, MO, USA). HPLC grade acetonitrile and ethanol were obtained from LiChrosolv-Merck (Darmstadt, HE,
Germany). Acetic acid was purchased from Vetec Química Fina (Duque de Caxias, RJ, Brazil), dichloromethane
from Fmaia (Belo Horizonte, MG, Brazil), hydrochloric acid from Dinâmica (Diadema, SP, Brazil) and hydrogen peroxide and sodium hidroxyde were obtained from Biotec
(Pinhais, PR, Brazil). The water used was puriied with a Milli-Q Gradient® (Millipore®, Darmstadt, HE, Germany), with 18.2 conductivity MΩ/cm.
Chromatographic conditions
For the development and validation of the
methodology, it was used a HPLC Waters 2695 Alliance (Waters®, Milford, MA, USA) combined with a PDA Waters 2998 (Waters®, Milford, MA, USA). HPLC system was equipped with a column compartment with temperature control, on line degasser, quaternary pump,
auto sampler and auto injector. The analyses were realized using a reverse phase C18 chromatograph column (Vertical®, Bangkok, Thailand) with 5 μm particle size,
4.6 mm internal diameter and 250 mm length.
To ensure optimal chromatographic conditions, variations in the proportion of components of the mobile
phase, the sample dilution solvent, the low rate and in the
injection volume were performed. The most appropriate chromatographic conditions were selected from the
chromatographic peak characteristics and subsequently
validated. The mobile phase was composed of acetonitrile
and 0.5% acetic acid (37:63, v/v), eluted at a low rate
of 1.0 mL/min in isocratic mode. The injection volume
was 10 μL and the analyses were performed at 320 nm at
25.0±1.0 °C.
Preparation of standard and sample solutions
A standard stock solution of FA (1 mg/mL) was
prepared in acetonitrile. After, subsequent dilutions
in acetonitrile were performed in order to obtain six
standard solutions (10; 30; 50; 60; 80 and 100 μg/mL).
described further. Prior to injection, standard and sample
solutions were iltered through 0.22 μm ilter pore size.
System suitability
The system suitability was carried out based on
the analysis of ive replicates of FA standard solution (50 μg/mL). The system performance was evaluated by the
following parameters: number of theoretical plates (N), tailing factor (T) and retention factor (k).
Method validation
Va l i d a t i o n w a s c o n d u c t e d f o l l o w i n g t h e guide’s recommendations International Conference on Harmonization (ICH) (ICH, 2005) and AOAC International Standard (AOAC) (AOAC, 2016). The parameters used for this validation were linearity, range, accuracy, precision, limit of detection and limit of
quantiication, speciicity and robustness.
Specificity
The specificity was evaluated by comparing the chromatograms obtained for the supernatant of blank nanoparticles (without FA) and chitosan solution with chromatograms of samples containing FA and FA standard solution.
Linearity and range
Linearity of the method was evaluated from the construction of three independent calibration curves (peak area versus drug concentration) using six FA standard
solutions (10; 30; 50; 60; 80 and 100 μg/mL). The linearity
was evaluated by the linear regression and the correlation coefficient (r), and can be considered satisfactory if
(r)≥0.99. The statistical analysis to evaluate the linearity
and deviation from linearity was performed by analysis of variance (ANOVA).
Limit of detection (LOD) and limit of quantification (LOQ)
The LOD and LOQ were obtained based upon
the slope (S) of the calibration curve and least standard
deviation obtained from the response (σ), according to Eq. 1 and Eq. 2 (ICH, 2005) from a speciic calibration curve constructed by analysis in triplicate of ive FA standard solutions with concentrations of 0.5; 2; 5; 7 and 10 μg/mL:
Equation 1
Equation 2
Precision: repeatability and intermediate precision The repeatability of the method was evaluated by analysis of FA sample solution (supernatant of FA-loaded
nanoparticles) in concentrations of 10; 50 and 100 μg/
mL, and for each concentration, five solutions were injected on the same day, in a short period of time. To the intermediate precision, samples were analyzed in the
same way, however repeated on three diferent days. The
precision was expressed as mean ± standard deviation (SD) and relative standard deviation (RSD).
Accuracy
The accuracy was verified by spiking blank nanoparticles with known concentrations of FA solution
to obtain inal concentrations of 10, 50 and 100 μg/mL, analyzed in quintuplicate. It was determined the RSD and the percentage of recovery (Eq. 3).
Equation 3
Robustness
Robustness was determined by changes in the ratio of mobile phase (acetonitrile:0.5% acetic acid - 35:65
and 39:61 v/v) and in the low rate (0.95 and 1.05 mL/
min). There were used FA solutions with concentrations
of 10, 50 and 100 μg/mL. The percentage of recovery
and the RSD were determined, and to verify the presence
of signiicant diference, analysis of variance (ANOVA)
with Tukey’s multiple comparisons test were performed (p<0.05).
Forced Degradation Studies
For evaluation of drug stability and selectivity with respect to degradation products, FA standard solutions (50
μg/mL) were subjected to forced degradation. Solutions
were exposed during 24 h to basic hydrolysis (1 mol/L NaOH – pH: 13.50), acid hydrolysis (1 mol/L HCl – pH
0.39), oxidative reaction (3% H2O2), visible light, and
temperature of -20 °C.
Method applicability
Nanoparticles containing FA were obtained by the
single-emulsion solvent evaporation method. Briely, an
organic solution was prepared by the dissolution of PLGA and FA in ethanol (200 µL) and dichloromethane (1.8 mL).
The aqueous phase consisted of 10 mL of chitosan solution
dissolved in 2% acetic acid (v/v). The organic phase was
added to the aqueous phase and sonicated for 5 min using a probe sonicator (QR1000, Eco-Sonic®, Indaiatuba, SP,
Brazil) to produce an oil-in-water emulsion. Next, the organic solvent was evaporated under vacum for 15 min at 37 °C by a rotary evaporator (TE 120 - Tecnal®, Piracicaba,
SP, Brazil). The nanoparticles were recovered and isolated of the free drug non-encapusulated by centrifugation
(19000 rpm, 20 °C, 45 min) (Z36HK Centrifuge, Hermle® Wehingen, BH, Germany). The precipitate was
freeze-dried (dispersed in cryoprotectant sucrose 15%, w/v) and stored for posterior use.
Mean diameter and polydispersity index (PDI) were analyzed by photon correlation spectroscopy
using a Dynamic Light Scattering Brookhaven 90 Plus
(Brookhaven®, Blue Point Road Holtsville, NY, United States), at 25 °C, in 90° scattering angle and wavelength of 659 nm. The determination of the amount of FA
encapsulated into nanoparticles was performed indirectly. The supernatant obtained after ultracentrifugation of the nanoparticle dispersion, which contained the free drug, was
diluted in acetonitrile (1:100 v/v), iltered on membrane
pore 0.22 µm and analyzed by HPLC using methodology
previously validated. The encapsulation eiciency (EE%) was obtained from Eq. 4 and expressed as mean EE% and
SD. Analyses were performed in triplicate.
Equation 4
where Initial FA represents the amount of FA added to the formulation of nanoparticles and free FA represents the amount of free drug not incorporated into the
nanoparticles, quantiied by HPLC in the supernatant.
RESULTS AND DISCUSSION
Method development
B r i t i s h P h a r m a c o p o e i a p r o v i d e s a m e t h o d
for quantifying FA by HPLC, but its elution is by
gradient, using phosphoric acid and acetonitrile (British Pharmacopoeia Commission, 2011). An isocratic elution methodology presents greater simplicity of execution, low cost and reduced time. Literature describes solvents, such as acetonitrile, methanol, acetic acid, orthophosphoric
acid, acetate bufer solution and ultrapure water for FA
determination in plants, plasma and some lipid particles (Carbone et al., 2014; Li et al., 2008; Li, et al., 2004; Li, Bi, 2003; Lu et al., 2005; Seo et al., 2011; Trombino et
al., 2013; Wang et al., 2015). Based on literature, initially it was tested several proportions of acetonitrile and 0.5%
glacial acetic acid as mobile phase using a low rate of 0.8 mL/min. With low proportions of acetonitrile (less than
20%), irregular and tailing peaks were obtained, therefore, the proportion of the mobile phase was changed to increase the amount of acetonitrile. The best peak, in relation to its
symmetry and width was found using a low rate of 1.0
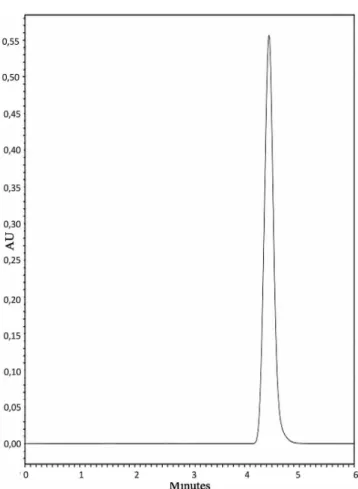
mL/min and a mobile phase composed of acetonitrile: 0.5% acetic acid (37:63 v/v). In these conditions, FA was detected in round to 4.5 min (Figure 1), a time that allows a large number of analyzes in a short time and with low cost with reagents.
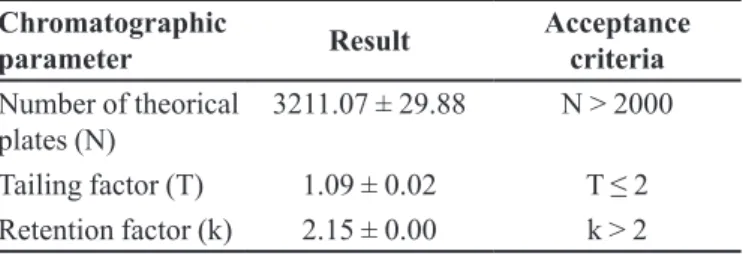
The system suitability of this method was evaluated based on the number of theoretical plates, peak symmetry (described by the tailing factor) and retention factor during the run of FA standard solution over five repetitions. The results presented in Table I and chromatographic parameters are in accordance with the criteria established
by the US FDA (1994).
Method validation
Linearity and range
Linearity indicates the ability of a method to demonstrate the results obtained are directly proportional to the concentration of analyte existing in the sample (ICH, 2005). In the present study, linearity was analyzed based on the construction of a calibration curve with six
diferent concentrations between 10 and 100 µg/mL and by calculating the regression and correlation coeicient equation (r) by the method of least squares.
An (r) of 0.999 was obtained, evidencing the
linearity of the method in this range. Additionally, the
calculated line equation, y = 54629.2405 (±932.5326) x + 48094.7369 (±24960.6400), was used in subsequent assays for quantification of the standard and sample
solutions. The validity of the test was confirmed by
ANOVA, which showed the signiicance of the regression and that the deviation from linearity was not signiicant
(p <0.0001).
TABLE I - System suitability of the HPLC method (n=5)
Chromatographic
parameter Result
Acceptance criteria
Number of theorical plates (N)
3211.07 ± 29.88 N > 2000
Tailing factor (T) 1.09 ± 0.02 T ≤ 2
LOD and LOQ
LOD is the lowest amount of analyte, which can be
detected in a sample, but not necessarily quantiied. LOQ
demonstrates the lowest amount of analyte determined with acceptable accuracy and precision (ICH, 2005). For these analyses, a specific calibration curve with concentrations below the expected range was constructed and analyzed by linear regression. From the SD of the intercept with the y-axis and the curve slope, LOD and
LOQ were calculated.
The (r) found was 0.99917, thus meeting recommendations (r of at least 0.99) and conirming the
linearity of the method (p<0.0001 - ANOVA). From line
equation, y = 55890.4530 (±796.0461) x - 7244.7629
(±1730.6330), it was possible to calculate the LOD
(102.18 ng/mL) and LOQ (309.65 ng/mL).
Precision: repeatability and intermediate precision FA sample solutions in low, medium and high concentrations (10, 50, and 100 µg/mL) were prepared
in quintuplicate and analyzed on the same day (intra-day
analysis) or on three different days (inter-day analysis)
to demonstrate the precision at level of repeatability and intermediate precision, respectively. According to AOAC (2016), to be considered a precise method, the RSD should not exceed 5.3% for solutions of 100 µg/mL and 7.3% at concentrations of 10 and 50 µg/mL. In this assay, there were obtained RSD below the recommended limit, being the highest value of 3.15% (Table II). Therefore, the precision
of the method was conirmed.
Accuracy
Accuracy of the method was demonstrated by the
percentage of recovery of three diferent concentrations
of FA solutions (10, 50 and 100 µg/mL) spiked in blank nanoparticles. Results are expressed in Table III, indicating the accuracy of the method. According to the AOAC (2016), to be considered an accurate method, the recovery
values should be between 90 and 107% for 100 µg/mL
solution and between 80 and 110% for 50 and 10 µg/mL.
Specificity
Specificity of the method was evaluated by comparing chromatograms of potential formulation interferences (supernatant from blank nanoparticles and FIGURE 1 - Representative chromatogram of 100 μg/mL FA
standard solution. Mobile phase: acetonitrile:0.5% acetic acid (37:63 v/v), low rate: 1.0 mL/min, λ: 320 nm.
TABLE II - Precision assay: repeatability and intermediate precision (n=5)
FA sample solution (µg/mL)
Quantiied concentration ± SD (µg/mL)
Recovery ± SD (%)
RSD (%)
Repeatability
10 9.74 ± 0.31 97.40 ± 3.07 3.15
50 49.30 ± 0.88 98.60 ± 1.76 1.79
100 101.60 ± 1.34 101.609 ± 1.34 1.32
Intermediate precision
Day 1
10 9.74 ± 0.31 97.40 ± 3.07 3.15
50 49.30 ± 0.88 98.60 ± 1.76 1.79
100 101.60 ± 1.34 101.60 ± 1.34 1.32
Day 2
10 10.13 ± 0.12 101.29 ± 1.25 1.23
50 50.53 ± 1.40 101.06 ± 2.79 2.77
100 102.10 ± 1.25 102.10 ± 1.25 1.23
Day 3
10 9.89 ± 0.27 98.88 ± 2.67 2.70
50 48.00 ± 1.05 96.00 ± 2.09 2.18
0.5% CS solution) with FA standard solution (Figure 1) and FA sample (Figure 2a).
It can be observed in Figure 2, the FA retention time in round to 4.5 min (A), however, in the chromatograms obtained from the supernatant of blank nanoparticles (B) and from the CS solution (C), no peaks were found in the same retention time. The results showed there was no interference at the retention time of FA from the formulation components. In that sense, it is possible to
conirm the speciicity of the purposed method.
Robustness
Robustness is the ability of the method to resist on small and deliberate variations of the analytical parameters (ICH, 2005). Table IV shows the results of the
quantiication of FA, represented as percentage of recovery and RSD, after changes in the low rate and in the mobile
phase. There was no statistical difference in recovery obtained by the reference method and when variations in the proportion of mobile phase were applied (p>0.05), therefore, the method is robust for this change. However, the methodology showed to be sensible to changes in the
low rate, requiring greater caution and attention for small
variations in this chromatographic parameter (p<0.05)
Forced degradation studies (stability indicating property)
In order to verify the speciicity of the method as
regards the impurities and the degradation products, as well as to promote information about the drug stability,
a forced degradation study was performed. To evaluate this parameter, FA standard solutions (50 µg/mL) were exposed to basic hydrolysis, acid hydrolysis, oxidation,
visible light and temperature of -20 °C, and subsequently quantiied. The chromatograms and percentage of recovery
are shown in Figure 3 and Table V, respectively.
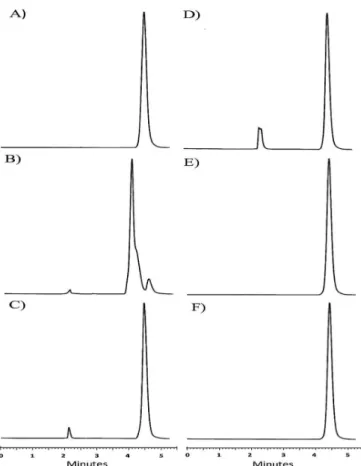
The chromatograms of the samples exposed to acid hydrolysis, oxidation, visible light and temperature of -20 °C, did not present alteration in FA retention time, allowing
its quantification. However, when the FA sample was
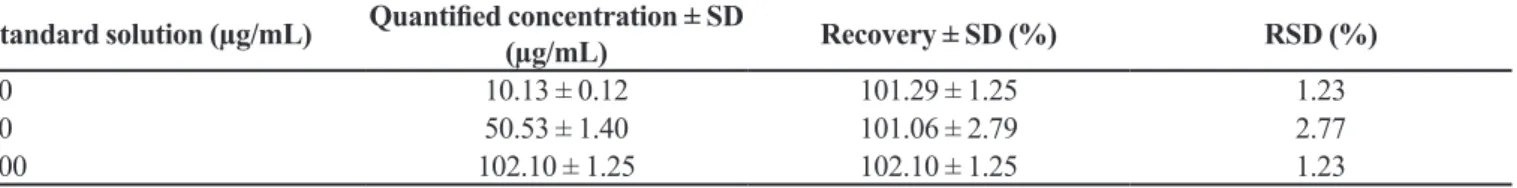
TABLE III - Percent recovery and RSD obtained by the accuracy test (n=5)
Standard solution (µg/mL) Quantiied concentration ± SD
(µg/mL) Recovery ± SD (%) RSD (%)
10 10.13 ± 0.12 101.29 ± 1.25 1.23
50 50.53 ± 1.40 101.06 ± 2.79 2.77
100 102.10 ± 1.25 102.10 ± 1.25 1.23
SD: Standard deviation; RSD: Relative standard deviation
FIGURE 2 - Representative chromatograms of: A) ferulic acid sample solution, B) supernatant from blank PLGA nanoparticles, C) 0.5% chitosan solution.
TABLE IV - Robustness results at diferent levels of low rate and mobile phase proportion (n=3)
Variation Recovery ± RSD (%)
10 µg/mL 50 µg/mL 100 µg/mL
Reference 99.32 ± 4.67a 98.04 ± 1.57a 101.02 ± 1.41a
Flow rate 0.95 mL/min 102.40 ± 2.93b 107.25 ± 1.66b 109.12 ± 0.49b
Flow rate 1.05 mL/min 91.27 ± 3.18c 92.59 ± 1.48c 95.57 ± 0.86c
Mobile phase acetonitrile:0.5% acetic acid; 35:65 v/v 100.29 ± 1.89a 102.21 ± 1.05a 104.67 ± 0.99a
Mobile phase acetonitrile:0.5% acetic acid; 39:61 v/v 99.98 ± 1.64a 101.97 ± 1.97a 104.49 ± 0.06a
exposed to alkaline pH, there was a displacement of the peak, and the retention time was 4 min. Furthermore, the possible degradation product obtained from the alkaline hydrolysis changed the FA characteristic peak shape (Figure 3b). The chromatogram of the acid degraded sample showed one additional peak with very low intensity at retention time of 2.2 min (Figure 3c). The chromatogram of the FA treated with H2O2 showed an additional peak at 2.5 min (Figure 3d).
Percentage of recovery (Table V) was adequate for
exposure to acid medium, visible light and temperature
of - 20 °C (between 97.49±0.40 and 101.52±0.27),
indicating stability in these conditions. For the exposure to oxidation, the recovery was slightly lower, although still in accordance with the AOAC (2016) recommended for the concentration of 50 µg/mL (80 to 110%). However, after the exposure to basic medium, due to the displacement and change of the peak shape by possible
degradation products, quantiication was not possible to
be performed.
Method applicability
PLGA nanoparticles containing FA coated with CS were properly obtained and presented mean size of 234±15
nm and polydispersity index of 0.195±0.018, indicating
homogenous size distribution. EE% was assessed by the HPLC method and the results showed about 60±5% of FA encapsulated in nanoparticles. Literature shows a similar result for FA encapsulated in PLGA nanoparticles (76%) (Merlin et al., 2012).
Due to the relative absence of studies in which
quantification of FA is carried out in polymeric
nanoparticles by HPLC, as well as the lack of validation and further detailing on the chromatographic methods used in other pharmaceuticals products, HPLC-PDA method here validated can be considered an alternative
for the quantitative analysis of FA. The method showed to be simple, fast, reliable and it fulill the requirements
to be applied in the encapsulation efficiency of FA in nanoparticles. Also, the method can be employed as a stability indicating one.
CONCLUSIONS
A simple, eicient and reliable method to quantify
FA in PLGA nanoparticles coated with CS by
reversed-phase HPLC with PDA was developed and adequately
validated according to ICH and AOAC. The reliability of the method has been proven by parameters of linearity,
range, LOD, LOQ, precision, accuracy, specificity,
robustness and a study of forced degradation. The analytical methodology presented a short retention time,
allowing rapid quantiication of FA with low quantities
of reagents. Also, the method proved to be suitable for
evaluating the FA encapsulation eiciency in PLGA-CS
nanoparticles. FIGURE 3 - Chromatograms obtained after forced degradation
test for 24 h. A) Ferulic acid standard solution - Reference (50 µg/mL) B) After basic hydrolysis (NaOH 1 mol/L) C) After acid
hydrolysis (HCl 1 mol/L) D) After oxidation (H202 3%) E) After
exposure to visible light F) After storage at -20 °C.
TABLE V - Results of quantification of FA after forced degradation test for 24 h (n=3)
Stress condition
Quantiied concentration ± SD
(µg/mL)
Recovery ± SD (%)
Reference 50.53 ± 1.40 NA
Basic hydrolysis NQ NQ
Acid hydrolysis 49.26 ± 0.20 97.49 ± 0.40
Oxidation 46.28 ± 1.30 91.59 ± 2.58
Visible light 51.30 ± 0.14 101.52 ± 0.27
-20 °C 50.94 ± 0.82 100.81 ± 1.63
ACKNOWLEDGEMENTS
T h i s s t u d y w a s s u p p o r t e d b y t h e C A P E S
(Coordenação de Aperfeiçoamento de Pessoal de Nível Superior), Fundação Araucária, CNPq (Conselho Nacional de Desenvolvimento Cientíico Tecnológico), and Finep
(Financiadora de Estudos e Projetos).
REFERENCES
ACEITUNO-MEDINA, M.; MENDOZA, S.; RODRIGUEZ, B.A.; LAGARON, J.M.; LOPEZ-RUBIO, A. Improved antioxidant capacity of quercetin and ferulic acid during in-vitro digestion through encapsulation within food-grade electrospun ibers. J. Funct. Foods,v.12, p.332-341, 2015.
ANDREASEN, M.F.; CHRISTENSEN, L.P.; MEYER, A.S.; HANSEN, Å. Content of phenolic acids and ferulic acid dehydrodimers in 17 rye (secale cereale L.) varieties. J. Agric. Food Chem.,v.48, n.7, p.2837-2842, 2000.
ANSELMI, C.; CENTINI, M.; RICCI, M.; BUONOCORE, A.; GRANATA, P.; TSUNO, T.; FACINO, R.M. Analytical characterization of a ferulic acid/γ-cyclodextrin inclusion
complex. J. Pharm. Biomed. Anal.,v.40, n.4, p.875-881,
2006.
BARBEROUSSE, H.; ROISEUX, O.; ROBERT, C.; PAQUOT, M . ; D E R O A N N E , C . ; B L E C K E R , C . A n a l y t i c a l methodologies for quantification of ferulic acid and its
oligomers. J. Sci. Food Agric.,v.88, n.9, p.1494-1511, 2008.
BONDI, M.L.; MONTANA, G.; CRAPARO, E.F.; PICONE, P.; CAPUANO, G.; CARLO, M.D.; GIAMMONA, G. Ferulic acid-loaded lipid nanostructures as drug delivery systems for alzheimer’s disease: preparation, characterization and
cytotoxicity studies. Curr. Nanosci.,v.5, n.1, p.26-32, 2009.
BRITISH PHARMACOPOEIA COMMISSION. British Pharmacopoeia. London: Stationery Oice, 2011.
CARBONE, C.; CAMPISI, A.; MUSUMECI, T.; RACITI, G.; BONFANTI, R.; PUGLISI, G. FA-loaded lipid drug delivery systems: preparation, characterization and
biological studies. Eur. J. Pharm. Sci.,v.52, p.12-20, 2014.
C R A PA R O , E . F. ; G E N N A R A , C . ; C H I A R A , O . M . ; G I R O L A M O , T. ; L U I S A , B . M . ; G A E TA N O , G . Amphiphilic poly(hydroxyethylaspartamide) derivative-based micelles as drug delivery systems for ferulic acid. J. Drug Target.,v.17, n.1, p.78-88, 2009.
DAS NEVES, J.; SARMENTO, B.; AMIJI, M.M.; BAHIA, M.F. Development and validation of a rapid reversed-phase HPLC method for the determination of the non-nucleoside reverse transcriptase inhibitor dapivirine from polymeric nanoparticles. J. Pharm. Biomed. Anal., v.52, n.2, p.167-172, 2010.
DE JONG, W.H.; BORM, P.J.A. Drug delivery and nanoparticles:
applications and hazards. Int. J. Nanomed.,v.3, n.2,
p.133-149, 2008.
FOOD AND DRUG ADMINISTRATION. FDA. Reviewer Guidance: validation of chromatographic methods. Silver Spring, 1994. Available at: <http://www.fda.gov/ downloads/Drugs/.../Guidances/UCM134409.pdf>. Accessed on: March 2016.
GUO, T.; SUN, Y.; SUI, Y.; LI, F. Determination of ferulic acid and adenosine in Angelicae Radix by micellar electrokinetic
chromatography. Anal. Bioanal. Chem.,v.375, n.6,
p.840-843, 2003.
GUY, P.A.; RENOUF, M.; BARRON, D.; CAVIN, C.; DIONISI, F.; KOCHHAR, S.; REZZI, S.; WILLIAMSON, G.; STEILING, H. Quantitative analysis of plasma cafeic and ferulic acid equivalents by liquid chromatography tandem
mass spectrometry. J. Chromatogr. B,v.877, n.31,
p.3965-3974, 2009.
HINGSE, S.S.; DIGOLE, S.B.; ANNAPURE, U.S. Method development for simultaneous detection of ferulic acid and vanillin using high-performance thin layer chromatography. J. Anal. Sci. Technol.,v.5, n.1, p.1-9, 2014.
INTERNATIONAL CONFERENCE ON HARMONIZATION.
ICH. Validation of analytical procedures: text and
methodology Q2(R1). Geneva: IFPMA, 2005. Available
at: <http://www.ich.org/fileadmin/Public_Web_Site/
ICH_Products/Guidelines/Quality/Q2_R1/Step4/Q2_R1__ Guideline.pdf>. Accessed on: Aug. 2015.
KAREPARAMBAN, J.; NIKAM, P.; JADHAV, A.; KADAM, V. A validated high-performance liquid chromatograhy method for estimation of ferulic acid in asafoetida and polyherbal preparation. Indian J. Pharm. Sci., v.75, n.4, p.493-495, 2013.
KIM, H.J.; RYU, K.; KANG, J.H.; CHOI, A.J.; KIM, T.I.; OH, J.M. Anticancer activity of ferulic acid-inorganic nanohybrids synthesized via two diferent hybridization routes, reconstruction and exfoliation-reassembly. Scient. W. J.,v.2013, p.1-9, 2013.
LI, F.Q.; SU, H.; WANG, J.; LIU, J.Y.; ZHU, Q.G.; FEI, Y.B.; PAN, Y.H.; HU, J.H. Preparation and characterization of sodium ferulate entrapped bovine serum albumin
nanoparticles for liver targeting. Int. J. Pharm.,v.349,
n.1-2, p.274-28n.1-2, 2008.
LI, X.; LI, X.; WANG, L.; LI, Y.; XU, Y.; XUE, M. Simultaneous determination of danshensu, ferulic acid, cryptotanshinone and tanshinone IIA in rabbit plasma by HPLC and their pharmacokinetic application in danxiongfang. J. Pharm. Biomed. Anal.,v.44, n.5, p.1106-1112, 2007.
LI, X.P.; YU, J.; LUO, J.Y.; LI, H.S.; HAN, F.J.; CHEN, X.G.; HU, Z.D. Simultaneous determination of chlorogenic acid, caffeic acid, ferulic acid, protocatechuic acid and protocatechuic aldehyde in Chinese herbal preparation by
RP-HPLC. Chem. Pharm. Bull. (Tokyo),v.52, n.10,
p.1251-1254, 2004.
LI, Y.; BI, K. HPLC determination of ferulic acid in rat plasma after oral administration of Rhizoma Chuanxiong and its
compound preparation. Biomed. Chromatogr.,v.17, n.8,
p.543-546, 2003.
LIMA, D.L.D.; DUARTE, A.C.; ESTEVES, V.I. Optimization of phenolic compounds analysis by capillary electrophoresis. Talanta,v.72, n.4, p.1404-1409, 2007.
LIMA, E.; FLORES, J.; CRUZ, A.S.; LEYVA-GOMEZ, G.; KROTZSCH, E. Controlled release of ferulic acid from a hybrid hydrotalcite and its application as an antioxidant for human ibroblasts. Micropor. Mesopor. Mat.,v. 181, p. 1-7, 2013.
LU, G.H.; CHAN, K.; LEUNG, K.; CHAN, C.L.; ZHAO, Z.Z.; JIANG, Z.H. Assay of free ferulic acid and total ferulic acid for quality assessment of Angelica sinensis. J. Chromatogr. A,v.1068, n.2, p.209-219, 2005.
MABINYA, L.V.; MAFUNGA, T.; BRAND, J.M. Determination of ferulic acid and related compounds by thin layer chromatography. Afr. J. Biotechnol., v.5, n.13, p.1271-1273, 2006.
MERLIN, J.P.J.; RAJENDRA PRASAD, N.; SHIBLI, S.M.A.; SEBEELA, M. Ferulic acid loaded Poly-d,l-lactide-co-glycolide nanoparticles: systematic study of particle size, drug encapsulation eiciency and anticancer efect in non-small cell lung carcinoma cell line in vitro. Biomed. Prev. Nutr., v.2, n.1, p.69-76, 2012.
NADAL, J.M.; TOLEDO, M.G.; PUPO, Y.M.; PADILHA DE PAULA, J.; FARAGO, P.V.; ZANIN, S.M. A stability-indicating hplc-dad method for determination of ferulic acid into microparticles: development, validation, forced degradation, and encapsulation eiciency. J. Anal. Methods Chem., v.2015, ArticleID286812, 10p., 2015.
OLTHOF, M.R.; HOLLMAN, P.C.H.; BUIJSMAN, M.N.C.P.; VAN AMELSVOORT, J.M.M.; KATAN, M.B. Chlorogenic acid, quercetin-3-rutinoside and black tea phenols are
extensively metabolized in humans. J. Nutr.,v.133, n.6,
p.1806-1814, 2003.
PICONE, P.; BONDI, M.L.; MONTANA, G.; BRUNO, A.; PITARRESI, G.; GIAMMONA, G.; DI CARLO, M. Ferulic acid inhibits oxidative stress and cell death induced by Ab oligomers: improved delivery by solid lipid nanoparticles. Free Radic. Res.,v.43, n.11, p.1133-1145, 2009.
QI, J.; JIN, X.; HUANG, L.; PING, Q. Simultaneous determination of hydroxysalor yellow A and ferulic acid in rat plasma after oral administration of the co-extractum of Rhizoma chuanxiong and Flos Carthami by HPLC-diode array detector. Biomed. Chromatogr., v.21, n.8, p.816-822, 2007.
RONDINI, L.; PEYRAT-MAILLARD, M.-N.; MARSSET-BAGLIERI, A.; FROMENTIN, G.; DURAND, P.; TOMÉ, D.; PROST, M.; BERSET, C. Bound ferulic acid from bran is more bioavailable than the free compound in rat. J. Agric. Food Chem.,v.52, n.13, p.4338-4343, 2004.
SAIKIA, J.P.; KONWARH, R.; KONWAR, B.K.; KARAK, N. Isolation and immobilization of Aroid polyphenol on magnetic nanoparticles: Enhancement of potency on surface
immobilization. Colloids Surf. B Biointerf.,v.102,
SEN, A.; MILLER, S.S.; ARNASON, J.T.; FULCHER, R.G. Quantitative determination by high performance liquid chromatography and microspectro-luorimetry of phenolic
acids in maize grain. Phytochem. Anal.,v.2, n.5, p.225-229,
1991.
SEO, Y.C.; CHOI, W.Y.; LEE, C.G.; CHA, S.W.; KIM, Y.O.; KIM, J.C.; DRUMMEN, G.P.; LEE, H.Y. Enhanced immunomodulatory activity of gelatin-encapsulated Rubus coreanus Miquel nanoparticles. Int. J. Mol. Sci.,v.12, n.12, p.9031-9056, 2011.
SHEN, G.; JIA, X.; JIN, J.; PANG, L.; CHEN, Z.; DU, B. Determination of ferulic acid by flow injection chemiluminescence analysis based on enhancement of the N-bromobutanimide–eosin-CrCl3 system in alkaline
solution. Luminescence,v.28, n.4, p.536-541, 2013.
SRIVASTAVA, S.; SINGH, A.P.; SINGH RAWAT, A.K. A HPTLC method for the identiication of ferulic acid from
Lycopodium clavatum. Asian Pac. J. Trop. Biomed.,v.2,
n.1, Supplement, p.S12-S14, 2012.
T E E - N G A M , P. ; N U N A N T, N . ; R AT TA N A R AT, P. ; SIANGPROH, W.; CHAILAPAKUL, O. Simple and rapid determination of ferulic acid levels in food and cosmetic samples using paper-based platforms. Sensors, v.13, n.10, p.13039-13053, 2013.
TROMBINO, S.; CASSANO, R.; FERRARELLI, T.; BARONE, E.; PICCI, N.; MANCUSO, C. Trans-ferulic acid-based solid lipid nanoparticles and their antioxidant efect in rat brain microsomes. Colloids Surf. B Biointerf., v.109, p.273-279, 2013.
VICHAPONG, J.; SOOKSERM, M.; SRIJESDARUK, V.; SWATSITANG, P.; SRIJARANAI, S. High performance liquid chromatographic analysis of phenolic compounds and their antioxidant activities in rice varieties. Lwt-Food Sci. Technol.,v.43, n.9, p.1325-1330, 2010.
VILIAN, A.T.E.; CHEN, S.-M. Preparation of carbon nanotubes decorated with manganese dioxide nanoparticles for electrochemical determination of ferulic acid. Mikrochim. Acta,v.182, n.5, p.1103-1111, 2014.
WALDRON, K.W.; PARR, A.J.; NG, A.; RALPH, J. Cell wall esteriied phenolic dimers: identiication and quantiication by reverse phase high performance liquid chromatography
and diode array detection. Phytochem. Anal.,v.7, n.6,
p.305-312, 1996.
WANG, J.; CAO, Y.; SUN, B.; WANG, C.Characterisation of inclusion complex of trans-ferulic acid and hydroxypropyl-β-cyclodextrin. Food Chem.,v.124, n.3, p.1069-1075, 2011.
WANG, W.; GUO, J.; ZHANG, J.; PENG, J.; LIU, T.; XIN, Z. Isolation, identiication and antioxidant activity of bound phenolic compounds present in rice bran. Food Chem., v.171, p.40-49, 2015.
WANG, X.Y.; MA, X.H.; LI, W.; CHU, Y.; GUO, J.H.; LI, S.M.; WANG, J.M.; ZHANG, H.C.; ZHOU, S.P.; ZHU, Y.H. Simultaneous determination of ive phenolic components and paeonilorin in rat plasma by liquid chromatography– tandem mass spectrometry and pharmacokinetic study after oral administration of Cerebralcare granule®. J. Pharm. Biomed. Anal.,v.86, p.82-91, 2013.
WU, W.; LEE, S.Y.; WU, X.; TYLER, J.Y.; WANG, H.; OUYANG, Z.; PARK, K.; XU, X.M.; CHENG, J.X. Neuroprotective ferulic acid (FA)-glycol chitosan (GC) nanoparticles for functional restoration of traumatically
injured spinal cord. Biomaterials,v.35, n.7, p.2355-2364,
2014.
YANG, M.-L.; SONG, Y.-M. Synthesis and investigation of water-soluble anticoagulant warfarin/ferulic acid grafted
rare earth oxide nanoparticle materials. RSC Adv.,v.5, n.23,
p.17824-17833, 2015.
ZHANG, T.; YANG, X.; ZHANG, P.; ZHU, M.; HE, Z.; BI, K. Determination of ferulic acid in rat plasma by liquid chromatography-tandem mass spectrometry method:
application to a pharmacokinetic study. Anal. Lett.,v.42,
n.14, p.2157-2169, 2009.
ZHOU, Y.; HUA, S.; YU, J.H.; DONG, P.; LIU, F.J.; HUA, D.B. A strategy for efective radioprotection by chitosan-based
long-circulating nanocarriers. J. Mater. Chem. B,v.3, n.15,
p.2931-2934, 2015.
Received for publication on 16th July 2016