ISSN 1546-9239
© 2007 Science Publications
Corresponding Author: Suhaib Yahya Kasim Al-Darzi, People's Republic of China, Shanghai, Yangpu district, Tongji University, Bridge Engineering Department, Wind Tunnel Lab, Office 204. Postal Code: 200092, Tel: 0086-21-65983116-5204, Mob: 0086-13524823687
Finite Element Simulation and Parametric Studies of Perfobond Rib Connector
Suhaib Yahya Kasim Al-Darzi, Ai Rong Chen and Yu Qing Liu Bridge Engineering Department, Tongji University, Shanghai, China
Abstract: Simulating the push-out test and conducting parametric study using finite element model are conducted using perfobond connectors. The finite element model was verified through comparing with push-out test results. The verified finite element model was then used to conduct parametric study aiming to investigate the effect of several parameters, such as height and thickness of connector, cross sectional area and yield strength of transverse reinforcement, concrete compressive strength and rib holes, on resistance capacity. The results of the parametric study are treated statistically to produce a mathematical model suggested to estimate the resistance capacity of the perfobond connector.
Key words: Perfobond connector, finite element, push-out test
INTRODUCTION
Development of bridges includes developing materials, method of design and method of construction. The design of steel-concrete composite bridge includes the design of steel beam, concrete slab and connectors. Nowadays, several types of connectors are available such as stud, channel, spiral, tendon and perfobond connectors[1-3].
Enhancing steel-concrete composite bridge can be conducted through improving connection between concrete slab and steel beam, which allows the composite action to be more effective[4]. The perfobond connector is one of the newly development connectors which give a good connection behavior comparative with the stud connector[5]. Since, design equations available to calculate resistance of perfobond connectors are mainly based on experimental investigation through performing push-out tests[6]. Connection between the two parts of bridges is investigated through push out test using perfobond connector[5].
Comparing the results of push out test with the available equations shows large difference in estimating ultimate resistance of perfobond connector. Moreover, performing push out test each time is required to estimate the ultimate resistance for each proposed project. Thus, it is proposed to model the push out test using finite element method and establish a parametric study to investigate the behavior of the perfobond connector and connector’s ultimate resistance. The
study attempts to consider the height and thickness of connector, concrete compressive strength, steel yield strength and the area of concrete dowels. The objectives of the present work can be stated as: (1) Modeling push-out specimens using finite element analysis package ANSYS. (2) Verifying the model’s accuracy in simulating push-out test comparing with experiments. (3) Using the verified model to perform parametric study considering the effects of the above parameters on ultimate resistance capacity of perfobond connector.
steel reinforcements. Push-out, full-scale flexural and deck-to-girder connection tests were presented, shown that, perfobond ribs can effectively used for connecting steel-concrete composite bridge decks[9].
Experimental and theoretical works
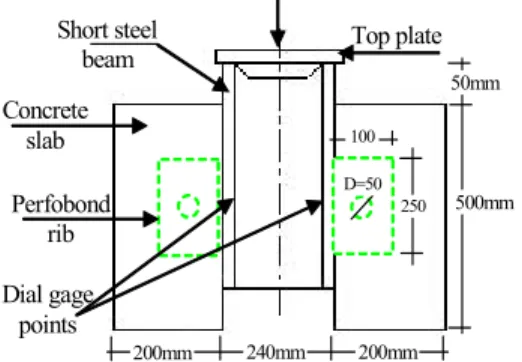
Push-out test: A push-out specimen consists of short steel beam section held in a vertical position by two identical reinforced concrete slabs attached to the beam flanges by shear connectors, Fig. 1. The overall system is subjected to vertical load, using hydraulic jack, producing shear load along the interface between concrete slab and beam flange on both sides. Top plate is used to ensure that the load applied uniformly. The push-out test was conducted using a total of 12 specimens. The 150×150×150mm concrete cubes were placed and cured at the same conditions, tested at 28days give an average value of concrete cube compressive strength fcu=54.60MPa. The beam and
connector steel yielding stress used are Fyb=345MPa.
The reinforcement steel yielding stress is Fyr=345MPa.
Four dial gages are fixed at four points at the same level which used to measure the relative displacement between steel and concrete. The load was applied slowly in several steps to failure of each specimen, measuring the applied loads and the relative displacements at each load step, drawing the load–slip curves for each specimen. The results of the experiments are then compared with the available equations used to calculate the shear resistance of perfobond connector. Usually, a series of push-out specimens are tested to study the effect of a number of parameters on the performance of the connector[3,5]. Modeling the test using finite element model is used. After verifying the model, parametric study is conducted to investigate the above parameters effects on resistance capacity of shear connector.
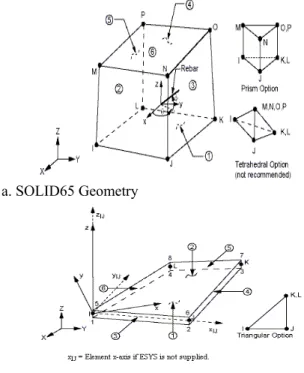
Numerical analysis: The finite element models are developed to predict the capacity of shear connectors. Several finite element models are tested with different level of modeling and different mesh size using ANSYS software V9.0. The final model is verified by comparing displacements at the same points where the dial gage fixed in experiments with the applied load, drawing load-slip curve. Due to symmetry and for simplifying calculating process, only quarter of the push-out test model is used in finite element analysis. The three-dimensional reinforced concrete solid element (Solid65) defined by eight nodal points, Fig. 2a, is used. Whereas, each nodal point has three degrees of freedom, translations in x, y and z directions, having
one solid concrete material and up to three reinforcing bar materials, with concrete capability of cracking in
Concrete slab
Short steel beam
Perfobond rib
200mm 240mm 200mm
500mm 50mm
100
250 D=50
Top plate
Dial gage points
Applied force
Fig. 1: Perfobond connector push-out specimen
tension and crushing in compression in three orthogonal directions, as well as incorporating plastic and creep behavior, using an iterative solution for nonlinear analysis and the stiffness matrix is reformulated after each iteration. Each load step is judged as converged by satisfying three convergence criteria, these are the bilinear elements status, large deflection and plasticity criteria. The three-dimensional shell element, (Shell43), Fig. 2b, is defined by four nodal points with six translational degrees of freedom per node, four nodal thicknesses, material direction angle and orthotropic material properties, having in-plane and out-of-plane stiffness, which adopted to model the steel beam section and perfobond rib connector. The three dimensional spar element (Link8) is used to model the reinforcement, which is a uniaxial tension-compression element with three degrees of freedom at each node: translations in the nodal x,y and z directions. As a pin-jointed structure, no bending of the element is considered. Plasticity, creep, swelling, stress stiffening and large deflection capabilities are included[10]. The adopted finite elements model discretization is shown in Fig. 3. The nonlinear elastic option (MELAS) is adopted to be used for concrete material, through entering uniaxial stress-strain curve for concrete. The typical stress-strain curve for concrete is linearly elastic up to 30% of the maximum compressive strength fc'.
bilinear total stress-total strain curve starting at the origin and with positive stress and strain values. The initial slope of the curve is taken as the elastic modulus of the material. At the specified yield stress, the curve continues along the second slope defined by the tangent modulus[10]. In discretizing the specimen, nodes are numbered in natural and convenient manner. The nodes for slab portion are numbered from 1 to 3234; for reinforcement from 3235 to 3319; for steel section and perfobond rib connector were numbered from 3320 to 3657. A uniformly distributed load applied at top of beam flanges, all nodes at top steel section are constraints to have a uniform displacement in load direction, whereas, in the actual test the load was applied through thick steel plate. Similarly, all nodes at the bottom of concrete slabs are constrained. Coincident nodes at the junction of perfobond rib elements and steel flange and web elements and at connector and concrete slab are merged to simulate the rigid connection of these elements replacing all nodes lie at the same coordinate location with only one node and the lowest node number of all the nodes merged is retained. The coincident concrete and steel flange element nodes are coupled in both x and z directions. The numbering scheme adopted where then changed after merging nodes, changing the total nodes number to be 3507 nodes. Similar to actual test, loads are applied slowly in several sub-steps to failure, a constant step of 3kN is used, 140 iterations for each load step are allowed, full Newton-Raphson method is applied and the solution automatically proceeded to the next load step if convergence is achieved after only a few iterations. Each analysis is continued until the solution no longer converged, at which point the ultimate load is deemed to have been attained.
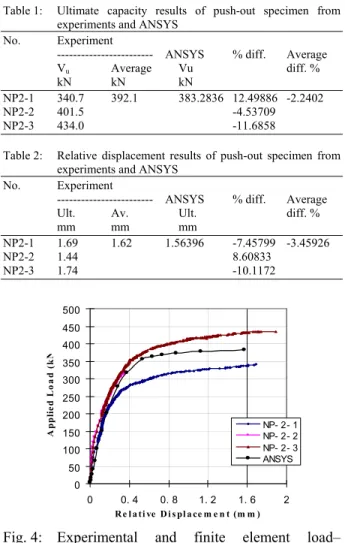
Finite element model’s verification: Table 1 shows the ultimate capacity results of push-out specimens obtained experimentally for NP2 group and ANSYS models at ultimate stage as well as Table 2 shows the relative displacements of experiments and ANSYS models at ultimate stage for the same specimens.
The experimentally obtained load–relative displacement curves results of group NP2, (etc. NP2-1, NP2-2 and NP2-3), with those obtained by finite element model are shown in Fig. 4. From Table 1 it can be observed that, the average shear capacity value predicted from finite element model is approximately 2.24% at ultimate stage lower than the experimental results, as well as from Table 2, the average displacement values predicted by finite element is 3.46% lower than experimental results. Thus, finite
element model results are considered to be reasonable and used to generate more numerical data by
a. SOLID65 Geometry
b. SHELL43 Geometry
Fig. 2: The ANSYS elements used to simulate push-out specimen
Beam flange
B eam web connector reinforcem e
Concrete slab
a. Steel beam, reinforcement and quarter concrete slab Fig. 3: Finite element modeling of push-out specimen
with perfobond connector
conducting a parametric study considering the perfobond connector geometry (height, thickness and holes dimension), concrete compressive strength and steel yield strength. Where, Vy is the yielding force in
(kN) and Vu is the ultimate force in (kN)
Table 1: Ultimate capacity results of push-out specimen from experiments and ANSYS
No. Experiment
--- ANSYS % diff. Average
Vu Average Vu diff. %
kN kN kN
NP2-1 340.7 392.1 383.2836 12.49886 -2.2402
NP2-2 401.5 -4.53709
NP2-3 434.0 -11.6858
Table 2: Relative displacement results of push-out specimen from experiments and ANSYS
No. Experiment
--- ANSYS % diff. Average
Ult. Av. Ult. diff. %
mm mm mm
NP2-1 1.69 1.62 1.56396 -7.45799 -3.45926
NP2-2 1.44 8.60833
NP2-3 1.74 -10.1172
0 50 100 150 200 250 300 350 400 450 500
0 0. 4 0. 8 1. 2 1. 6 2 R e l a t i ve D i s pl a ce m e n t (m m )
Ap p li e d L o ad ( k N
NP- 2 - 1 NP- 2 - 2 NP- 2 - 3 ANSYS
Fig. 4: Experimental and finite element load– displacement curves
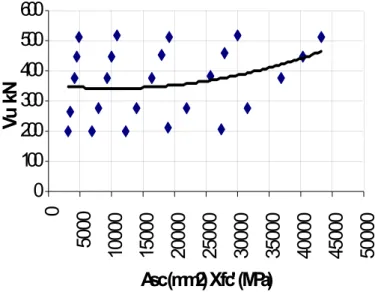
reinforcing bars; thickness and height of perfobond rib connector; and number and diameter of rib holes. In group A, thickness and height of perfobond rib connector are changed. As well as, group B treated the variation of the amount of transverse reinforcement and the yield tension strength. The final group C considered the variation of the diameter of rib holes and concrete compressive strength. A total of 82 models are considered in analysis, recording the ultimate load for each model. The shear resistance variations of groups are plotted in Fig. 5-7 for groups A,B and C respectively. Where h is height of connector, t thickness of connector, Ar area of transverse reinforcement, fy
yield strength of reinforcement, Asc shear area of
dowels, fc’ concrete compressive strength and Vu
ultimate shear resistance of perfobond connector.
Shear resistance by numerical expression: The failure of push-out specimens tested occurred in
3 0 0 3 2 5 3 5 0 3 7 5 4 0 0 4 2 5 4 5 0
1 0 0 0 1 5 0 0 2 0 0 0 2 50 0 3 0 0 0 3 5 0 0 4 0 0 0 4 5 0 0 5 0 0 0
h ( m m ) X t ( m m )
Vu
k
N
Fig. 5: Variation of shear resistance (Vu) with height (h) and thickness (t)
380 382 384 386 388 0 1 0000 0 20 0 0 0 0 30 0 0 0 0 4 00000 5 00000 6 00000 70 0 00 0 80 0 00 0 90 0 0 0 0 1 0 0 0000 11000 0 0 12000 0 0
Ar (mm2) Xfy (MPa)
Vu
k
N
Fig. 6: Variation of shear resistance (Vu) with reinforcement area (Ar) and yield strength (fy)
concrete slab and initiated by longitudinal splitting of slab[5]. Cracks are normally induced in concrete members by tensile stresses that develop due to applied loads or as a result of restraint to volumetric change. Load-deformation behavior of concrete under compressive and tensile loads is closely linked to formation and propagation of these cracks. The numerically generated results were fitted to regression model accounts for the contribution of bearing, concrete dowels and splitting resistance and transverse reinforcement.
The regression mode1 was of the form:
0 1 2 3
Vu= β + βh.t.fc'+ βAr.fy+ βAsc fc ' (1) Where Vu(kN) is the ultimate shear resistance of
perfobond connector, h(mm) height of connector,
t(mm) thickness of connector, Ar (mm2) area of
transverse reinforcement, fy (MPa) reinforcement yield
strength, Asc(mm2) concrete rib holes area, fc’ (MPa)
cylindrical concrete compressive strength given as fc’= 0.78fcu and β0, β1, β2 and β3 are regression coefficients
0
100
200
300
400
500
600
0
50
00
10
00
0
15
00
0
20
00
0
25
00
0
30
00
0
35
00
0
40
00
0
45
00
0
50
00
0
Asc (mm2) X fc' (MPa)
Vu
k
N
Fig. 7: Variation of Shear Resistance (Vu) with dowels area (Asc) and concrete strength (fc’)
The term (htfc’) accounts for contribution of concrete
bearing, while the term (Arfy) accounts for transverse
reinforcement contribution as well as term Asc fc' accounts the contributions of concrete dowels formed through holes of perfobond rib connector, which fail in double shear, hence the total shear area of dowels, Asc,
is =2n(πD2/4), where n is number of rib holes, D
diameter of rib holes. Using multiple linear regressions with least squares procedure the β0,β1, β2 and β3 are
determined and given as[11]:
β0 = 255.3092616 β1 = 0.00076175 β2 = -7.59033E-07 β3 = 0.002531749
Hence, expression for predicting shear resistance of perfobond rib connector is given as:
' 10 53 . 2 . 10 59 7 . . 10 62 . 7 31
255. 4htfc'-. 7Arfy 3Ascfc
Vu= + × − × - + × − (2)
Equation (2) is suggested to estimate shear resistance of perfobond connector within the limits of the parameters investigated.
CONCLUSION AND RECOMMENDATIONS
From the previous works, it can be concluded that: 1. Using finite element method to simulate push-out
test is acceptable.
2. The sensitivity of the perfobond connector to the variation of the area of transverse reinforcement is too small.
3. The numerical model used to estimate the shear resistance of the perfobond connector is suggested
to be used within the limit of the investigated parameters. It is also recommended that, perfobond resistance capacity need to be investigated by more detailed study by experiments and computer simulations.
ACKNOWLEDGEMENT
This research was supported by Chinese Scholarship Council and Tongji University.
REFERENCES
1. Salmon, C.G. and J.E. Johanson, 1990. Steel Structures, Design and Behavior. 3rd Edn., Harper and Row Publishers, New York, USA.
2. GBJ 17-88, 1988. Code for Design of Steel Structures, National Standard of the People's Republic of China, GBJ 17-88, Beijing, China. 3. Liu, Y.Q., 2004. Composite Bridge, Renmin
Jiaotong Publisher, Shanghai, China (Chinese). 4. Al-Darzi, S.Y.K. and A.R. Chen, 2006.
Development of hybrid bridges: State of arts and conceptual design. J. Appl. Sci., 6: 2799-2803. 5. Liu, Y.Q., 2006. Experimental and analytical
6. Oguejiofor, E.C. and M.U. Hosain, 1996. Numerical analysis of Push-Out specimens with Perfobond rib connectors. J. Computer and Structure, 62: 617-624.
7. Studnicka, J., J. Machácek, A. Krpata and M. Svitaková, 2000. Perforated shear connector for composite steel and concrete beams. Proc. Composite Construction Conference, Banff.
8. Valente, I. and P.J.S. Cruz, 2004. Experimental analysis of Perfobond shear connection between steel and lightweight concrete. J. Constructional Steel Res., 60: 465-479.
9. Kim, H.Y. and Y.J. Jeong, 2006. Experimental investigation on behaviour of steel-concrete composite bridge decks with perfobond ribs. J. Constructional Steel Res., 62: 463-471.
10. Kohnke, P., 2001. ANSYS, Inc. Theory Manual. 12th Edn., SAS IP, Inc, USA, pp: 1266.