This paper aims to contribute to decisions concerning the use of ine materials, responsible for the segregation resistance of self-compacting con-crete (SCC). In this study, samples of SCC were prepared with ly ash, a pozzolanic waste ,and ine sand that is a non-pozzolanic material, using the dosage method proposed by Tutikian-Dal Molin (2007) [1]. It was observed that the utilization of ly ash increased the resistance to compres-sive strength, mainly in more advanced ages, as well as the values of the elastic modulus and the propagation speed of ultra-sound waves. It has also decreased the penetration of chloride ions to the same strength values, where it was also observed that the inal cost of the ly ash SCC was lower than the ine sand SCC for similar strength levels. Both dosage and performance diagrams were shown.
Keywords: self-compacting concrete (SCC), ly ash, ine sand, design method, performance diagram.
O objetivo deste artigo é contribuir para a tomada de decisão sobre a deinição do uso de materiais inos responsáveis pela resistência à segregação do concreto auto-adensável (CAA). Neste estudo, amostras de CAA foram dosadas com cinza volante, um material pozolânico, e areia ina, que é um material não pozolânico, utilizando o método de dosagem proposto por Tutikian & Dal Molin (2007) [1]. Foi observado que a utilização de cinza volante aumentou a resistência à compressão, principalmente nas idades mais avançadas, assim como os valores de módulo de deformação e velocidade das ondas de ultra-som. Também diminuiu a penetração de íons cloretos, para os mesmos valores de resistência em comparação com os CAA com areia ina e o custo inal dos CAA com cinza volante foi inferior. Foram apresentados tanto os diagramas de dosagem como os de desempenho.
Palavras-chave: concreto auto-adensável (CAA), cinza volante, areia ina, método de dosagem, diagrama de desempenho.
Comparative assessment of self-compacting concretes
(SCC) with ly ash and ine
Comparativo das propriedades do concreto
auto-adensável (CAA) utilizando areia ina e cinza volante
B. F. TUTIKIAN a
D. DAL MOLIN b
a ENGENHARIA CIVIL, PPGEC, UNISINOS, [email protected] – Av. Unisinos, 950, centro 6 – Exatas, São Leopoldo / RS, Brasil; b NORIE, PPGEC, UFRGS, [email protected] – Av. Osvaldo Aranha, 99, 3° Andar, Centro – Porto Alegre / RS, Brasil.
Abstract
Comparative assessment of self-compacting concretes (SCC) with ly ash and ine
1. Introduction
Although concrete is the most widely used construction material in the world, nowadays it is no longer considered only the study of conventional concrete (CCV). The market and the construction techniques require concrete with special features. Helene (2005) [2] refers to the high strength, high performance, self-compacting, with high levels of additions and pozzolans, apparent, colourful, white, sustainable, among others.
Because of this tendency, it was developed in Japan, in 1988, a concrete which is capable of moving on its own and ill, without any intervention, the spaces in the form work: the self-compacting concrete (SCC) (REPETTE, 2005) [3]. The SCC is clearly one of the areas of the concrete technology has the greatest potential for development (PETERSSEN and REKNES, 2005) [4].
The two most important properties of SCC are the workability and stability, which depend on a satisfactory proportioning among all SCC components, including the ine materials, responsible for the stability of the mixture.
This article aims to contribute to the decision making about the deini-tion of the use of ine materials responsible for the segregadeini-tion resis-tance of SCC, using the dosage method proposed by Tutikian-Dal Molin (2007) [1]. To choose among the options offered by the market, the professional must examine the material characteristics, such as the cost of each component, the quantity availability and acceptable distances, the possibility to react chemically with water or products that hydrate the cement. If there is more than an option for a given item, it is advisable to use those that have already been used by the person responsible for the dosage. Yet, it should be taken into consid-eration that, currently, there are good options for ine, and many are from waste of the industries, which, if not used in the concrete, should be disposed under the strict environmental standards.
Hence, it was held an experimental work with two ine components highly used locally, at the Federal University of Rio Grande do Sul (UFRGS). Two SCC families were moulded, one with ly ash and one with ine sand, representing a pozzolanic and a non-pozzola-nic ine.
2. Experimental program
According to Table 1, 2 cylindrical test specimens (10 x 20 cm) were moulded to test the compressive strength at 1, 7, 28 and 91 days, and 3 CT’s elastic modulus to measure the propagation speed of ultra sonic waves, and 2 more CT’s for testing concrete
with penetration to chloride ions, totalling 13 CT’s per unit. It was determined to all the families trend-line equations, along with the coeficient of determination. With this, dosage diagrams can be drawn, representing the resistance to compression, water/ cement (w/c) ratio, proportion of the dry aggregates mass related to the mass of cement, and cement consumption per cubic meter of concrete. Performance diagrams can also be drawn, represent-ing the compressive strength at 28 days, the elastic modulus, the penetration of chloride ions and the speed of ultrasonic wave. Fol-lowing, through behavioural equations, all the parameters men-tioned above were calculated for several compressive strength rates, plus the cost, and only then compare all concrete families.
3. Constituent materials
The Tutikian-Dal Molin (2007) [1] dosage method, used in this work, allows the proportioning of concrete with any available mate-rial, provided meet some basic requirements. For the implementa-tion of this experimental work materials which are abundant locally, economic and which have already been used by the construction industry for other purposes were selected. Thus, the concrete made may be reproduced and tested in the future.
The cement used was the CPV - RS (Portland cement of high early strength and resistant to sulphates). This cement was selected be-cause it is acquired in the region and also for being the most widely used in industries of pre-cast, which is one of the places the SCC can be used with greater beneits.
The crushed basalt was chosen as the coarse aggregate, which is also commercially available in the region and proven effective in its role. River sand was used as ine aggregate and water was taken directly from the public water supply.
Comparative assessment of self-compacting concretes (SCC) with ly ash and ine
the mixing water in approximately 20%. However, in the case of SCC, the additive is used to increase the workability of the con-crete, at the same w/c ratio.
Table 2 illustrates the particle size analysis of cement and ly ash, while the X-Ray luorescence can be observed in table 3. Tests were conducted at LACER (Laboratory of Ceramics) at UFRGS. Table 4 illustrates the bulk densities and unitary masses of the ma-terials used, while Table 5 shows the particle sizes of aggregates. The bulk densities of cement and ly ash were determined accord-ing to ABNT NBR NM 1.23 [5], the bulk densities of aggregates (ine sand and regular sand) were performed through the ABNT NBR NM 52/03 [6] while the ABNT NBR NM 53/03 [7] normalized the test bulk density of coarse aggregates. The unitary masses were obtained through ABNT
NBR 7251/82 [8] and particle size analysis was obtained fol-lowing the procedure of ABNT NBR NM 248/03 [9].
4. Dosage for SCC
The dosage for SCC has fol-lowed a step-by-step, according to the method mentioned. From the determined aggregates pro -portions, conducted through the packaging of every two, it could
calculate the proportions of the concrete unit and simply mix them to determine the w/c ratio, the content of superplasticizer and to mould CT’s as a means of reference for future trials.
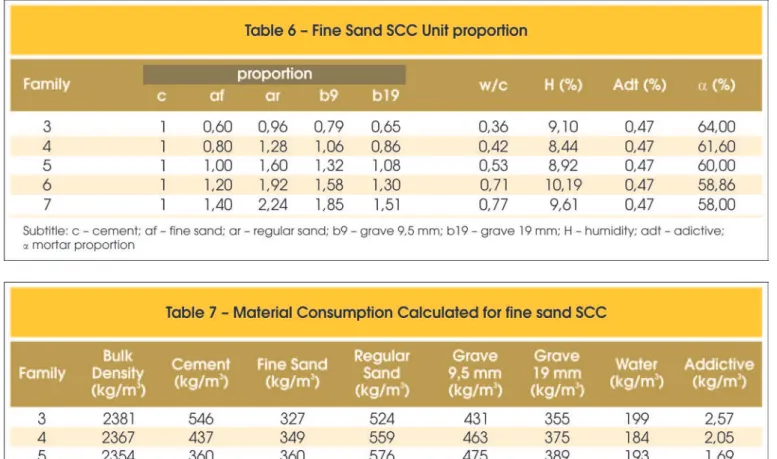
The unit proportion of SCC with ine sand are shown in Table 6, while the consumption of materials are shown in table 7. It was necessary to mix ive points to obtain the range 25 MPa to 50 MPa for the compressive strength at 28 days (fck between 20 and 45
MPa). The calculations of the consumptions of the components of concrete have been performed, based on concrete fresh density. It is observed that the content of dry mortar ranged from 58.0% to 64.0%, but these proportions can be considered from the same family, therefore, plotted on the same curve of dosage to main-tain the proportions between the aggregates ixed. The content of
SCC. Observe that all values are within the parameters estab-lished by Tutikian (2004) [10] and ABNT NBR 15823 [11]. The same packing, previously employed, has been used to the ly ash mix, instead of ine sand. With the values all the features of this SCC family can be calculated.
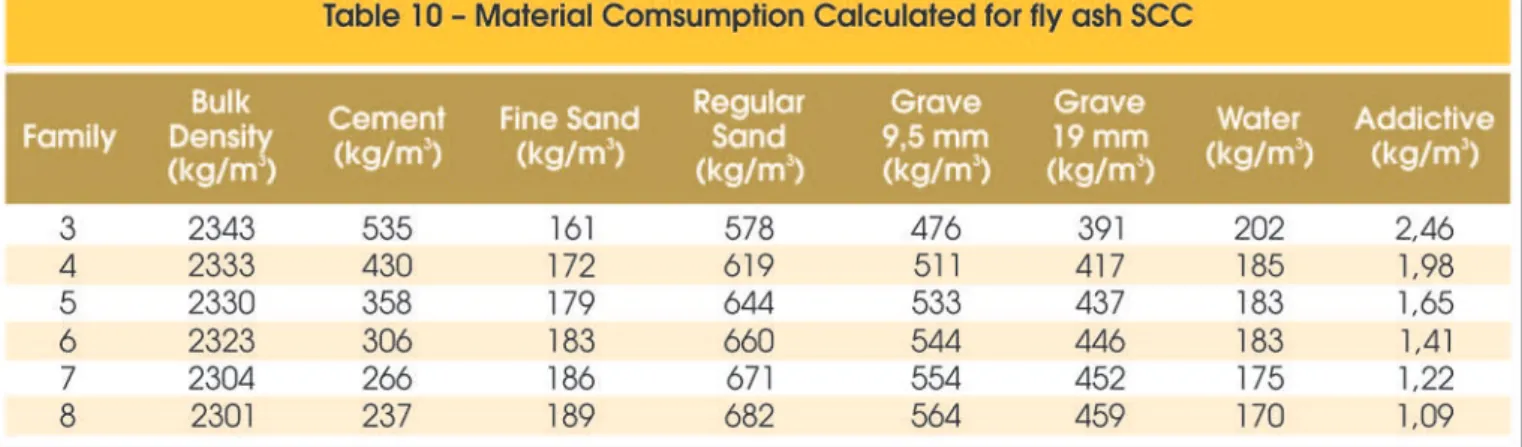
The basis to calculate the consumption of materials represented in table 9 was the speciic mass determined in fresh concrete, which was also considered for the ly ash SCC. In table 10 pro-portions per unit can be found. For this concrete family, it was necessary a dosage of 6 to determine the curves of strength and performance. The content of the superplasticizer was very close to those used in the SCC with ine sand at 0.46% while the content of the dry mortar was lower, ranging between 52% and 59.5% due to the fact that the ash content is slightly higher related to the total aggregates, compared with those of another family. The ratio w/c and moisture remained in the expected range, with the exception of the proportion 1:8, which indicates that the concrete was drier than the others, as it can be seen in Table 11, which shows the results of the workability tests for the family of ly ash SCC.
Table 11 shows the properties of fresh concrete. To characterize the fresh ly ash SCC, the slump low, V-funnel and L-box tests were chosen. Observe that all values are within the parameters established by Tutikian (2004) [10] and ABNT NBR 15823 [11].
5. Results
val-Comparative assessment of self-compacting concretes (SCC) with ly ash and ine
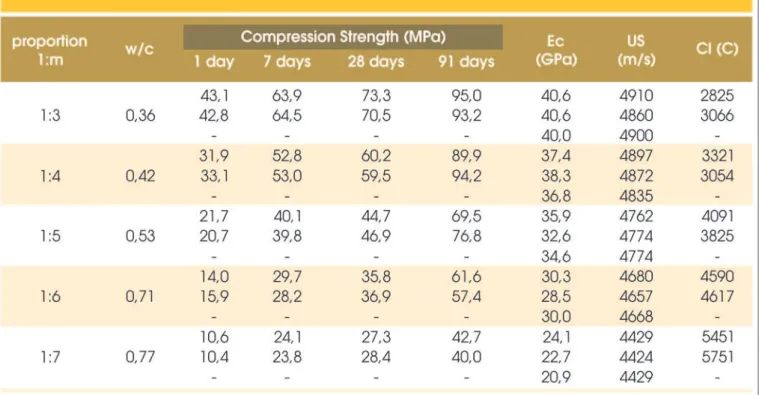
ues of elastic modulus and the propagation speed of ultrasound waves were growing as the proportions became richer and cov-ered all the expected range, following the compressive strength, as expected. The penetration of chloride ions was high for this family, whereby moderate for the richest proportions and high for the pro-portions 1:5, 1:6 and 1:7, according to the classiication proposed by ASTM 1202/97 [12].
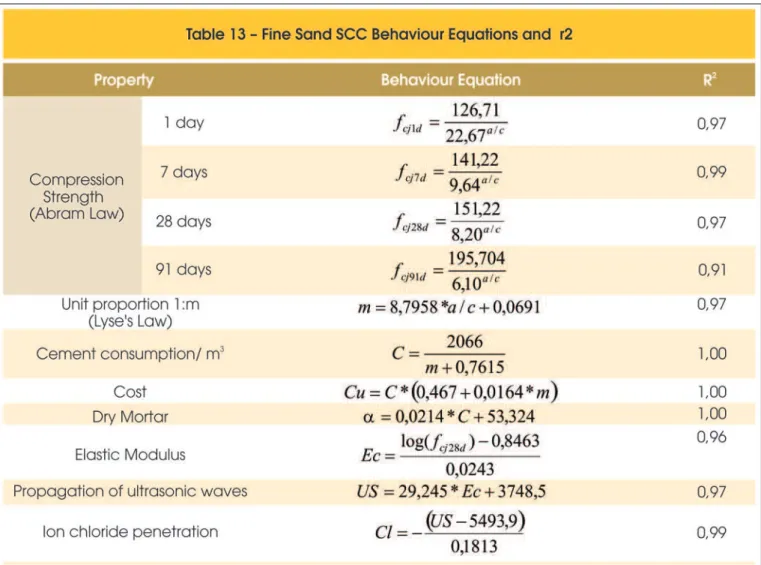
Table 13 shows the behaviour equations and correction factor for the family of ine sand SCC .
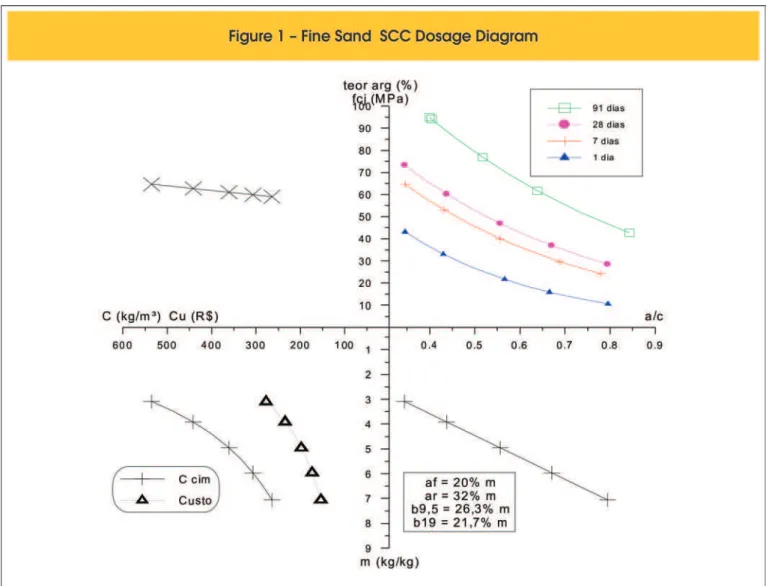
In Figure 1, it is represented the dosage diagram for the family of ine sand SCC, determined by the behaviour equations as seen on Table 13. This graph represents the compression strength at various ages, the unit proportion 1:m, the cost and consumption of cement and mortar content, which varies according to the method used. The diagram should be used only for approximations, because for precise calculations it is used behaviour equations. It is regarded that the cost curve proves adequate only to their own determina-tions, and can not be used as a passageway for the mortar content. The graph should always be used clockwise from the compressive strength or counter-clockwise, from the mortar content.
In Figure 1, a proportion for any mixture wanted from an initial re-quirement can only be obtained approximately, such as the com-pressive strength. Thus, it allows to streamline the dosage process and have a broader view of the whole behaviour of the family, with-in the range of studied values. It is observed with-in Figure 1, a large growth, already reported, of the compressive strength from 28 to 91 days, as of 1 to 7 days. It can also be observed that the slope of the cost curve does not follow the consumption of cement, that is, there is not a proportional increase in values with an increasing consumption of cement, when the mixture becomes richer. The
ta-ble at the bottom of Figure 1 determines the proportion that should be used among aggregates, ine sand (af), regular sand (ar), grave 9.5 mm (b9, 5) and 19mm grave (b19), for any point within the range studied.
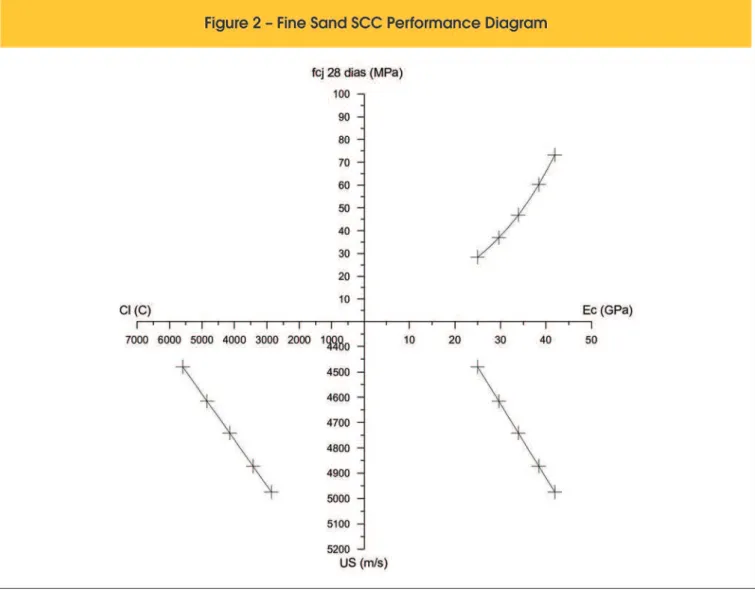
Finally, Figure 2 shows a diagram of performance for this same family, which represents the relationships between the compres-sive strength with elastic modulus, this one with speed of propaga-tion of ultrasound waves the other one with chloride ion penetra-tion. Obviously the diagram should be used in a clockwise direction and for approximations.
Finally,the results of the properties in the hardened ly ash SCC family is presented , as shown on table 14. As it has already oc-curred previously, it was used the highest values of compressive strength, elastic modulus and speed of propagation of ultrasound waves and the lowest values for the penetration of chloride ions. The compressive strength values were high, if compared with the previous family, getting in the two richer proportions at 80 MPa after 28 days. These high results were caused probably due to the fact that the method proposed considers the ly ash as an aggre-gate, and by a more eficient packaging, something beneicial for those who choose pozzolans as ine material.
Another interesting fact is the small increase of the compressive strength from 28 to 91 days. As it was used ly ash, pozzolan, which reacts for longer (over 28 days), it would be expected a high-er growth, which had not occurred.
observed that the test of the propagation speed of ultrasound waves showed a high variability when compared with other tests. This fact was not new, since that is what usually occurs in this essay. And as for the other family, the behaviour of the elastic modulus was exponential in respect to the compressive strength, and the linear equation was repeated for the other two properties of the performance diagram.
The penetration of chloride ions was low, all the proportions consid-ered of low penetration, according to the clause ASTM 1202/97 [12]. Following, Table 15 presents the behavioural equations and the correlation coeficient for all the properties of ly ash SCC. It was observed that in the correlation coeficient values were all above 0.94, increasing the reliability of the behavioural equations and, consequently, of the subsequent calculations.
Figure 3 contains a graph of strength for this family of SCC, not-ing this graph correlates the compressive strength at various ages compared with the w/c, with a unit proportion: 1:m, with the cost and consumption of cement and with the variable content of mor-tar. The chart should always be used in a clockwise direction from
the compressive strength or counter-clockwise, from the content of mortar. The cost curve can not be used as a passageway for the content of mortar. The axis ‘y’ positive represents, at the same time, compressive strength and mortar content, while the axis ‘x’ negative is divided between the cement consumption and cost. In the dosage chart it can be observed that the compressive strength growth was more signiicant between 1 and 7 days, but with a similar increase among the other ages, reaching high values at 28 and 91 days. At this point it can be noticed that a variable content of mortar, new to the proposed method, and the cost curve, making its determination easier for any point on the diagram. An-other facility for further measurements is the representation in the second quadrant, of the aggregates percentage, compared to the total ‘m’.
Comparative assessment of self-compacting concretes (SCC) with ly ash and ine
6. Comparative
In this item the costs and properties of two families for the same concrete compressive strength at a certain age will be compared. The ages of 1, 7, 28 and 91 days will be used , and the costs for these mixtures compared, as well as the modulus of elasticity, the propagation speed of ultrasound wave and the penetration of chloride ions.
The values that will be used for comparison vary according to the rupture age, as it also changes the needs. That is, the compressive strength of the concrete for one day is not the same for 28 days, as in the early ages of the cement, where it was searched only for an elastic modulus, by checking the initial de-mould resistance, in the case of conventional work, or when drawing out parts in the industry of prefabricates. It is known that the mixture will reach the highest resistance in later ages, and will meet the minimum requirements of ABNT NBR 6118/03 [13] for reinforced and pre-stressed concrete. Following, the compression strength of 10, 20 and 30 MPa for 1 day, 20, 30 and 40 MPa for 7 days and 40, 50 and 60 MPa for 91 days for the comparisons were ixed. The age of 28 days, as it is more regarded by designers and other profes-sionals, will be standard for comparisons with the elastic modulus,
propagation speed of ultrasound wave and chloride ion penetra-tion. Therefore, the compressive strength of 25, 30 and 40 MPa is determined, since they are equivalent to the compressive strength characteristic used, normally 20 to 35 MPa.
It is important to mention that these values were chosen by ana-lysing the most common uses of concrete in the works, but other values could be chosen, depending on the implementation and professional opinion. With the behaviour equations already de-termined, it is simple to calculate the mixtures for any resistance, therefore it would be suficient to recalculate for the other values.
6.1 Compressive Strength
Table 16 shows all costs of the concrete studied, allowing com-parisons. In the last column, the cost differences between the ine sand SCC and the ly ash SCC were calculated .
6.2 Elastic Modulus , ultrasound and chloride
ion penetration
Table 17 shows the results of modulus of elasticity (Ec), velocity of propagation of ultrasound waves and the penetration of chloride ions for both types of concrete with the compressive strength of 25, 30 and 40 MPa at 28 days.
It is observed that the ine sand SCC showed the modulus of elas-ticity, the speed of propagation of ultrasound waves and the lower penetration of chloride ions higher than the ly ash SCC. Therefore, it can be stated, for the materials used in this study that the tech-nical performance of the SCC with ly ash was higher than those SCC with ine sand.
Figure 6 depicts the same data of table 17, but a better way of viewing. The results of elastic modulus were multiplied by 1000 to have a better view on the scale used.
7. Conclusions
After performing this work, mainly the experimental part, it can be concluded that for the materials used, the ly ash showed always
higher results than the ine sand, both economically and techni-cally. Besides permitting more economical production of SCC, the use of ly ash also resulted in superior values of elastic modulus and propagation speed of ultrasound wave, and inferior to chloride ion penetration produced by ine sand SCC.
8. Bibliography
[01] TUTIKIAN, B.F. Proposição de um método de dosagem experimental para concretos
auto-adensáveis. Tese de doutorado, Universidade Federal do Rio Grande do Sul, Porto Alegre, 2007. [02] HELENE, P. Dosagem dos concretos de cimento
Portland. In: Concreto: ensino, pesquisa e
realizações. Ed: G.C. ISAIA. São Paulo, volume 1, capítulo 15, p.439-471, 2005.
[03] REPETTE, W.L. Concretos de última geração: presente e futuro. In: Concreto: ensino, pesquisa e realizações. Ed: G.C. ISAIA. São Paulo, volume 2, capítulo 49, p.1509-1550, 2005.
Comparative assessment of self-compacting concretes (SCC) with ly ash and ine
compacting concrete with lignosulphonate superplasticizer. In: Fourth International RILEM Symposium on Self-compacting Concrete. Chicago, EUA, 2005.
[05] ASSOCIAÇÃO BRASILEIRA DE NORMAS
TÉCNICAS. NBR NM 23: cimento Portland e outros materiais em pó – Determinação da massa especíica. Rio de Janeiro, 2001.
[06] ASSOCIAÇÃO BRASILEIRA DE NORMAS TÉCNICAS. NBR NM 52: agregado miúdo – Determinação de massa especíica e massa especíica aparente. Rio de Janeiro, 2003. [07] ASSOCIAÇÃO BRASILEIRA DE NORMAS
TÉCNICAS. NBR NM 53: agregado graúdo – Determinação de massa especíica, massa especíica aparente e absorção de água. Rio de Janeiro, 2003.
[08] ASSOCIAÇÃO BRASILEIRA DE NORMAS TÉCNICAS. NBR 7251: agregado em estado solto – Determinação da massa unitária. Rio de Janeiro, 1982.
[09] ASSOCIAÇÃO BRASILEIRA DE NORMAS
TÉCNICAS. NBR NM 248: agregados – Determinação da composição granulométrica. Rio de Janeiro, 2003. [10] TUTIKIAN, B.F. Método para dosagem de concretos
auto-adensáveis. Dissertação de mestrado, Universidade Federal do Rio Grande do Sul, Porto Alegre, 2004.
[11] ASSOCIAÇÃO BRASILEIRA DE NORMAS
TÉCNICAS. NBR 15823: Concreto auto-adensável. Partes 1 a 6. Rio de Janeiro, 2010.
[12] AMERICAN SOCIETY FOR TESTING AND MATERIALS. C1202. Standard test method for electrical indication of concrete´s ability to resist chloride ion penetration. ASTM 1202/97. [13] ASSOCIAÇÃO BRASILEIRA DE NORMAS