Comparison of the diagnosis of malaria
by microscopy, immunochromatography
and PCR in endemic areas of Venezuela
1Laboratorio de Genética Molecular, Departamento de Biomedicina,
Instituto de Investigaciones en Biomedicina y Ciencias Aplicadas, Universidad de Oriente, Cumaná, Venezuela
2Banco de Sangre, Hospital J.G. Hernández, Puerto Ayacucho,
Venezuela
3Gerencia de Saneamiento Ambiental y Malariología, Region XI, Carúpano,
Venezuela
4Instituto de Inmunología, Universidad Central de Venezuela, Caracas, Venezuela
H. Rodulfo1,
M. De Donato1,
R. Mora2,
L. González3
and C.E. Contreras4
Abstract
Whole blood samples (N = 295) were obtained from different loca-tions in Amazonas and Sucre States, in Venezuela. Malaria was diagnosed by microscopy, OptiMAL™ and polymerase chain reac-tion (PCR), with Plasmodium vivax, P. falciparum, and P. malariae
being detected when possible. We identified 93 infections, 66 of which were caused by P. vivax, 26 by P. falciparum, and 1 was a mixed infection. No infection caused by P. malariae was detected. The sensitivity and specificity of each diagnostic method were high: 95.7 and 97.9% for microscopy, 87.0 and 97.9% for OptiMAL, and 98.0 and 100% for PCR, respectively. Most samples (72.2%) showed more than 5000 parasites/µL blood. The sensitivity of the diagnosis by microscopy and OptiMAL decreased with lower parasitemia. All samples showing disagreement among the methods were reevaluated, but the first result was used for the calculations. Parasites were detected in the 6 false-negative samples by microscopy after the second examination. The mixed infection was only detected by PCR, while the other methods diagnosed it as P. falciparum (microscopy) or
P. vivax (OptiMAL) infection. Most of the false results obtained with the OptiMAL strip were related to the P. falciparum-specific band, including 3 species misdiagnoses, which could be related to the test itself or to genetic variation of the Venezuelan strains. The use of the microscopic method for malaria detection is recommended for its low cost but is very difficult to implement in large scale, population-based studies; thus, we report here more efficient methods suitable for this purpose.
Correspondence
M. De Donato
Departamento de Biomedicina Instituto de Investigaciones en Biomedicina y Ciencias Aplicadas (IIBCA), Universidad de Oriente Cerro del Medio
Cumanás 6101 Venezuela
Fax: +58-293-452-1297
E-mail: marcosdedonato@yahoo.com Research supported by the Fondo Nacional de Ciencia, Tecnología e Innovación (FONACIT, No. PEM-2001001621).
Received October 5, 2005 Accepted January 9, 2007
Key words
•Malaria
•Molecular diagnosis of
malaria
•Microscopic diagnosis
of malaria
Introduction
Malaria is the most important human parasitic disease throughout the tropical and subtropical regions of the world due to is high prevalence and mortality rate. In Ven-ezuela, malaria is also a great concern, with 46,244 cases being reported in 2004, mainly from Sucre (10.26%), Bolivar (59.63%), and Amazonas (23.18%) States (1). Detailed knowledge of the incidence and transmis-sion dynamics of the Plasmodium species in our region is the key to design effective measures for malaria control and the treat-ment schemes to be used. Medical and mi-croscopic diagnoses are universally used for the collection of epidemiological data. The standard microscopic diagnosis of malaria requires a relatively short time when the parasites are present in high numbers (≥1000 parasites/µL), but if parasitemia is very low, more than 10 min are needed to examine each slide, which is often the case in en-demic areas for malaria or when drugs are taken inappropriately (2).
On the other hand, the immunodiagnos-tic tests used for the detection of Plasmo-dium are easy to use and can produce fast results, but they usually have lower sensitiv-ity and specificsensitiv-ity than conventional micro-scopic examination. Many of them have been designed to specifically detect P. falciparum
and some of them can detect the other ma-laria species non-specifically. Among the most common immunodiagnostic tests avail-able are the Parasight F-test (Becton-Dick-inson Advanced Diagnosis, Franklin Lakes, NJ, USA) which detects P. falciparum spe-cifically using an IgG1 monoclonal anti-body that recognizes the parasite histidine-rich protein 2 (3); the ICT Malaria Pf/Pv (AMRAD, Frenchs Forest, New South Wales, Australia) and its new version NOW ICT Malaria Pf/Pv (Binax, Inc., Portland, ME, USA), which work according to the same principle but use an IgM monoclonal antibody specific for P. falciparum as well
as an antibody against the Plasmodium aldo-lase (4), and OptiMAL (DiaMed, under li-cense from Flow, Inc., Portland, OR, USA) which is based on the detection of the para-site lactate dehydrogenase, an enzyme pro-duced only by live parasites, and not a re-sidual metabolite such as parasite histidine-rich protein 2, which can thus detect active infection, being useful for the monitoring of antimalarial drug therapies (5,6).
Finally, the use of molecular biology for the diagnosis of malaria has proved to be highly sensitive for the detection of the dis-ease, but the equipment required is not widely available in many of the endemic areas and the protocol is more complex and needs better trained technicians. The use of the polymerase chain reaction (PCR), however, is extremely useful for decision making in disease control and treatment, for example, for the detection of mixed infections which play a modulatory role in the severity of the symptoms (2,7,8). The greatest advantage, however, is the ability of PCR to detect infections with parasitemia as low as 5 para-sites/µL blood (9,10). However, there are some problems with false-negative results when the DNA isolation protocol is not ap-propriate (5,11); for example, not remov-ing the inhibitors from the sample and not preventing the action of enzymes that de-grade DNA.
Due to the increase of malaria cases in the last years in the regions of Venezuela where malaria is endemic, we decided to carry out a study to evaluate three different diagnostic methods applied to individuals from Sucre and Amazonas States, which represent the extremes of the Southeastern endemic region of the country, with the high-est prevalence values in Venezuela, after Bolivar State.
Material and Methods
total of 295 samples were analyzed, 14 of which came from Cumaná, 41 from Yagua-raparo, 100 from Cangua in Sucre State, a P. vivax endemic area, 17 from Puerto Ayacucho, 110 from San Fernando de Atabapo, and 13 from Santa Barbara in Amazonas State, a P. vivax/P. falciparum
endemic area (Figure 1). Samples from Cangua, San Fernando de Atabapo, and Santa Barbara were taken at random from indi-viduals living in those communities; the rest of the samples were obtained by active searches for positive samples at different places, except for the samples from Cumaná, which were from blood bank donors known to be free of malaria infection and were used as negative controls. Blood samples were taken intravenously from symptomatic and asymptomatic individuals of both genders and different age groups, who agreed to participate in this study by signing a consent form, and who received an immediate diag-nostic result (both microscopic and OptiMAL tests) and the corresponding treatment. Samples to be used for PCR were stored frozen with EDTA at -20ºC until use. Two drops of blood were also taken from the ear to prepare thick and thin smears for micro-scopic diagnosis after standard Giemsa stain-ing, by analyzing the slides under a 100X objective. Samples with no visible parasites after scoring 100 fields were considered to be negative for this test. Parasitemia (para-sites/µL) was determined by counting the number of parasites present in the thick blood smear in relation to 500 white blood cells and using 8000 white cells per µL of blood (5) as a reference.
Additionally, an immunochromatograph-ic diagnosis was carried out using the OptiMAL® strip (Flow Inc., Portland, OR,
USA) according to manufacturer instruc-tions. This test is based on a membrane coated with monoclonal antibodies specific for parasite lactate dehydrogenase, an en-zyme produced by metabolizing malaria parasites. Briefly, a drop of blood is added to
Figure 1. Localization of the populations of Sucre and Amazonas States, Venezuela, where the samples were obtained.
control line that should be present at the top of the strip to demonstrate that it is func-tional. A second line, adjacent to the positive control line, indicates the presence of a Plas-modium parasite (P. falciparum, P. vivax, P. ovalae, or P. malariae). A third line indi-cates a positive infection with P. falciparum, containing specific antigens.
Finally, molecular biology diagnosis was carried out using the amplification of the 18S rRNA genes with primers specific for P. falciparum, P. vivax, and P. malariae (2). For this, total genomic DNA was extracted from blood samples using the Wizard Ge-nomic DNA extraction kit (Promega Corp., Madison, WI, USA) according to manufac-turer instructions. Briefly, 150 µL of blood was mixed with 450 µL of cell lysis solution and incubated for 10 min at room tempera-ture. The white blood cells and parasites were isolated by centrifugation and then mixed with 150 µL nucleus lysis solution. Fifty microliters of protein precipitation so-lution was added and vortexed for 20 s. The protein pellet was eliminated by centrifuga-tion and the DNA was precipitated with isopropanol, washed with 70% ethanol and then dried and hydrated with Tris-EDTA buffer. We used a DNA sample from a pa-tient from Yaguaraparo as the PCR-positive control for the amplification of the P. vivax
fragment, as well as DNA from the cultured strain FCB (Instituto de Inmunología, Uni-versidad Central de Venezuela, Caracas, Venezuela) of P. falciparum as the PCR-positive control for the amplification of this species fragment.
Amplification was done in a 25-µL vol-ume using Taq polymerase buffer (10 mM Tris-HCl, pH 9.0, 50 mM KCl, 0.1% Triton X-100), 200 µM of each dNTP, 0.75 U Taq
polymerase (Promega Corp.), either 1 mM MgCl2 (for P. vivax) or 3 mM MgCl2 (for P.
falciparum and P. malariae) and 2 µL of diluted DNA (about 100 ng). PCR was per-formed individually for each species using the previously published oligonucleotides at a
concentration of 175 nM. The program used for the amplification included a modification of the original program (2), with the first 10 cycles containing one step of denaturation at 94ºC for 1 min, one step of annealing at 54ºC for 2 min and one step of polymerization at 72ºC for 2 min. Next, 35 cycles were used with denaturation at 94ºC for 45 s, annealing at 56ºC for 90 s and polymerization at 72ºC for 1 min. A final extension at 72ºC for 10 min was then carried out. This modification improved the intensity of the signal while decreasing the background noise of the amplification.
Results
We detected 93 cases of true malaria infection among the 295 samples evaluated, 66 of which were caused by P. vivax, 26 by
P. falciparum and one was caused by both species. In the population-based study car-ried out in Sucre, there was a prevalence of 2% for P. vivax infection and no cases of P. falciparum or P. malariae, as expected from previous reports. In the population-based study carried out in Amazonas, the preva-lences of 12.2% for P. vivax and 15.4% for
P. falciparum infection were detected. No infection caused by P. malariae was de-tected by PCR or microscopy.
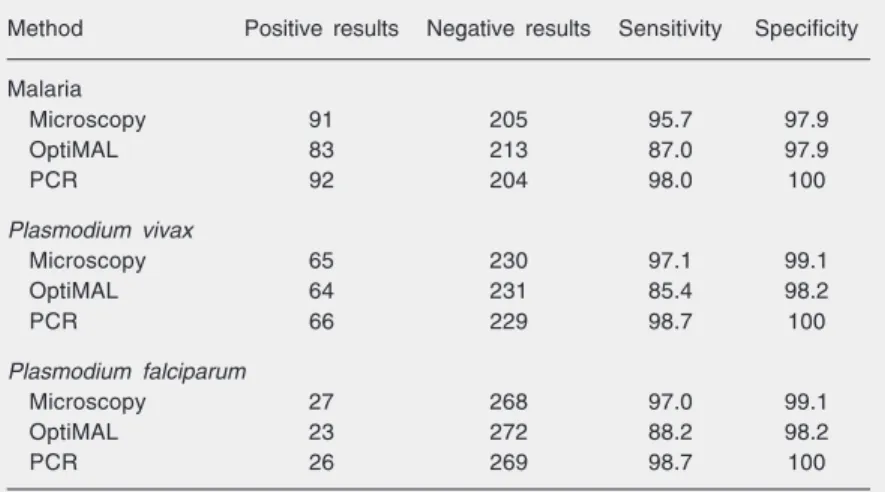
The microscopic diagnosis for malaria showed a high sensitivity (95.7%) but some-what lower than for PCR (98.0%), and both higher than for OptiMAL (87.0%), with these differences being statistically significant (Table 1). Specificity values were high (≥98%) for all methods either for species-specific or nonspecies-specific diagnosis.
When comparing the microscopic and PCR methods, there was agreement in the diagnosis of 85 positive and 199 negative samples (Table 2). Two samples were posi-tive for P. vivax by microscopy and negative by PCR. Of these, one was a true-positive for microscopy undetected by PCR, and one was a false-positive for microscopy. Simi-larly, three samples were positive for P. falciparum by microscopy and negative by PCR. Of these, 1 was a true-positive for microscopy which went undetected by PCR, and 2 were false-positives for microscopy. The 2 false-negative results obtained by PCR were reanalyzed (new DNA extraction and amplification) and found to be positive. The false-positive and -negative results obtained by microscopy were rescored by a highly trained microscopist (Malaria Reference Center) who found either parasites or no sign of infection, agreeing with both the first and second PCR analysis, as well as with the OptiMAL test. Additionally, one sample
Table 1. Characteristics of the diagnostic methods for malaria in 295 blood samples.
Method Positive results Negative results Sensitivity Specificity
Malaria
Microscopy 91 205 95.7 97.9
OptiMAL 83 213 87.0 97.9
PCR 92 204 98.0 100
Plasmodium vivax
Microscopy 65 230 97.1 99.1
OptiMAL 64 231 85.4 98.2
PCR 66 229 98.7 100
Plasmodium falciparum
Microscopy 27 268 97.0 99.1
OptiMAL 23 272 88.2 98.2
PCR 26 269 98.7 100
Sensitivity and specificity were calculated according to the criteria stated in the Material and Methods section.
Table 3. Comparison between the OptiMAL and PCR diagnosis in the 295 blood samples from this study.
PCR Total
Plasmodium Plasmodium Mixed Negative OptiMAL vivax falciparum infection results
Plasmodium vivax 59 3 1 1 64
Plasmodium falciparum 1 18 0 4 23
Mixed infection 0 0 0 0 0 Negative results 5 4 0 199 208
Total 65 25 1 204 295
All PCR results were true results except for 1 false-negative result for Plasmodium vivax and 1 for P. falciparum.
Table 2. Comparison between the microscopic and PCR diagnosis in the 295 blood samples tested in the present study.
PCR Total
Plasmodium Plasmodium Mixed Negative Microscopy vivax falciparum infection results
Plasmodium vivax 62 1 0 2 65
Plasmodium falciparum 0 23 1 3 27
Mixed infection 0 0 0 0 0 Negative results 3 1 0 199 203
Total 65 25 1 204 295
which was originally scored as positive for
P. vivax by microscopy was rescored as positive for P. falciparum (species misdiag-nosis), agreeing with the PCR and OptiMAL result. Finally, 3 samples infected with P. vivax and one with P. falciparum were diag-nosed as negative by microscopy. Rescoring of these samples agreed with the PCR and OptiMAL results.
When comparing the OptiMAL and PCR methods (Table 3), we found agreement in the diagnosis of 77 positive and 199 nega-tive samples. One sample posinega-tive for P. vivax by OptiMAL and negative by PCR
was shown to be a P. vivax false-negative result by PCR. Similarly, four samples found to be positive for P. falciparum by OptiMAL, failed to be diagnosed by PCR. Three of these were found to be negative when re-tested by PCR and OptiMAL, and one was the true-positive not detected by PCR dis-cussed above. Additionally, three samples which originally tested positive for P. vivax
and one that tested positive for P. falciparum
were retested by OptiMAL and PCR and found to be positive for P. falciparum and P. vivax, respectively (species misdiagnosis), agreeing with the original PCR and micro-scopic results. Finally, 5 samples infected with P. vivax and 4 with P. falciparum were diagnosed as negative by OptiMAL. Retest-ing of these samples agreed with the original PCR and microscopic results. Mixed infec-tion with P. vivax/P. falciparum was de-tected as a P. vivax infection by OptiMAL and as a P. falciparum infection by micros-copy. The results for the 28 (9.5%) samples with disagreement in the diagnosis by any method were concordant after retesting.
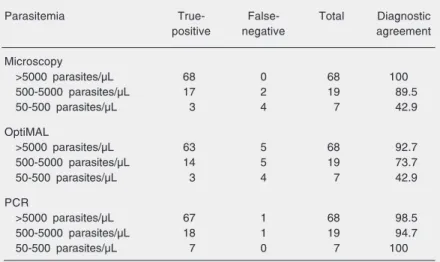
When comparing the OptiMAL and mi-croscopic methods (Table 4), there was agree-ment in the diagnosis of 80 positive and 199 negative samples. Two samples were found to be positive for P. vivax by OptiMAL and negative by microscopy. Similarly, one sam-ple found to be positive for P. falciparum by OptiMAL was diagnosed as P. vivax by microscopy; all three samples were species misdiagnoses by OptiMAL. Additionally, of 4 samples that were negative by microscopy 2 tested positive for P. vivax and 2 for P. falciparum,while of the 9 negative samples that tested negative by OptiMAL 4 tested positive for P. vivax and 5 for P. falciparum. Most of the samples (72.2%) contained more than 5000 parasites/µL blood, while 20.2% were between 500-5000 parasites/µL and 7.4% showed 50-500 parasites/µL and none was found showing fewer than 50 para-sites/µL (Table 5). The diagnostic agree-ment of the microscopic examination and Table 5. Sensitivity of each diagnostic method according to parasitemia.
Parasitemia True- False- Total Diagnostic positive negative agreement
Microscopy
>5000 parasites/µL 68 0 68 100 500-5000 parasites/µL 17 2 19 89.5 50-500 parasites/µL 3 4 7 42.9
OptiMAL
>5000 parasites/µL 63 5 68 92.7 500-5000 parasites/µL 14 5 19 73.7 50-500 parasites/µL 3 4 7 42.9
PCR
>5000 parasites/µL 67 1 68 98.5 500-5000 parasites/µL 18 1 19 94.7 50-500 parasites/µL 7 0 7 100
These values were calculated according to the criteria stated in the Material and Methods section.
Table 4. Comparisons between the OptiMAL and microscopic diagnosis in the 295 blood samples tested in the present study.
Microscopy Total
Plasmodium Plasmodium Mixed Negative OptiMAL vivax falciparum infection results
Plasmodium vivax 60 2 0 2 64
Plasmodium falciparum 1 20 0 2 23
Mixed infection 0 0 0 0 0
Negative results 4 5 0 199 208
OptiMAL test decreased with lower parasi-temia, but the PCR test showed the highest diagnostic agreement when samples had 50-500 parasites/µL. The mixed infection showed a high number of P. vivax parasites (higher than 5000 parasites/µL) but a low number of P. falciparum parasites (less than 500 parasites/µL).
Discussion
Even though conventional microscopy is the reference method and the one most used for the diagnosis of Plasmodium spp, its sensitivity and specificity are limited to the number of tests that can be analyzed per microscopist and his/her training, especially for low-parasite densities, when more time is needed for an accurate diagnosis (2,14). These limitations could explain the false results obtained in the microscopic diagno-sis of the endemic populations of Sucre and Amazonas.
Zaman et al. (15) suggested that the great-est disadvantage of the microscopic diagno-sis is the possibility of misdiagnodiagno-sis of Plas-modium species, particularly for low parasi-temia, mixed infections and when only ring forms are seen. Postigo et al. (16) reported that false-negative results by microscopy for
P. vivax are probably due to very low parasi-temia which is very difficult to detect by routine microscopic methods. This agrees with the present study, where most of the false-negative results were obtained for para-sitemia lower than 500 parasites/µL.
The significantly lower sensitivity of the OptiMAL test agrees with many reports from Afghanistan, Turkey, Kuwait, Honduras, and Peru (17-21) in which the test showed sensi-tivities ranging from 79.3 to 94% but speci-ficities ranging from 97 to 100%. Other stud-ies from Thailand, USA, Honduras and Co-lombia (22-25) have shown sensitivities and specificities close to 100%, while one study from Canada (26) showed a sensitivity of 29.1 but a specificity of 95.6%.
In addition, the lower sensitivity found for P. falciparum antigens detected by the antibodies used on the OptiMAL strips, in this study, agrees with previous reports (17, 18,20,24) with 6-57% differences in sensi-tivity but with specificities similar to those found in our study. Moody (4), in a large study with 636 patients with malaria symp-toms from Sub-Saharan Africa, showed sen-sitivities for the OptiMAL test of 96, 95.3, 57 and 47% for P. vivax, P. falciparum, P. ovale, and P. malariae, respectively, and specificities of 100% for P. falciparum and 94% for the other species, when compared with the microscopic diagnosis. They sug-gested that the lower sensitivity of the tests for P. falciparum infections were due to the fact that only gametocytes at low densities were present.
Miller et al. (27), evaluating the treat-ment of malaria by OptiMAL and conven-tional microscopy in 12 patients from Thai-land infected with P. falciparum without clinical complications, found that the color intensity in the reactive strips for the OptiMAL test decreased with the levels of parasitemia, also showing that sensitivity was 88% when the density of gametes was
≥100/µL and 35% for densities of <100/µL. This agrees with our results regarding para-sitemia and the sensitivity of OptiMAL. However, even at high parasitemia (>5000 parasites/µL), 5 false-negative results were reported for this test, which showed lower sensitivities than the other two methods at any parasitemia level.
97%. On the other hand, Grobusch et al. (34), comparing the ParaSight, ICT Malaria Pf/Pv and OptiMAL tests, found similarly high sensitivities for the first two (95.1 and 95.7%, respectively) and significantly lower sensitivity for OptiMAL (76.2%), although all tests showed again specificities higher than 97%.
Coleman et al. (35) evaluated the effi-cacy of the ICT Malaria Pf/Pv in a large study of 559 asymptomatic patients from an endemic area of Thailand using conventional microscopy as the reference method, and found that the sensitivity for P. falciparum
dropped from 100 to 23.3% when the parasi-temia was below 500 trophozoites/µL. For
P. vivax infections, the sensitivity dropped from 66.7% to 0 at parasitemia below 500 trophozoites/µL. In our case, diagnostic agreement for OptiMAL, was similar for both species but also dropped drastically in samples with <500 parasites/µL.
Our results allow us to recommend the use of both microscopy and PCR for the characterization of any diagnostic test, since by using both techniques we can obtain 100% certainty of the results. It is especially im-portant to use PCR for the species-specific diagnosis to evaluate the treatment of ma-laria, since resistance to the drugs used is species-specific, so that the treatment of one type of malaria will probably not cure the other (14).
We recommend the use of PCR for the accurate diagnosis of infections in
popula-tion-based studies that will allow the estab-lishment of better relationships among the epidemiological factors that can affect the endemicity of malaria. In addition, the use of PCR-based techniques is most valuable for the evaluation of drug treatments as well as for diagnosing the emergence of drug resis-tance in specific areas. Thus, we recommend the incorporation of the PCR technique into the Reference Centers of government insti-tutions responsible for malaria control, the evaluation of diagnostic tests, the verifica-tion of the quality of the microscopic diag-nosis at each diagnostic center, as well as the monitoring of the emergence of resistant strains of Plasmodium parasites.
Acknowledgments
The authors wish to acknowledge to Gerencia de Saneamiento Ambiental y Ma-lariología, Region XI, Carupano, Venezuela who donated the OptiMAL kits, as well as Isaurea Quijada (IIBCA, Universidad de Oriente, Cumana, Venezuela) and Melcenia Moreno (Instituto de Biomedicina, Ministerio de Ciencia, Tecnologia e Innovacion, Cara-cas, Venezuela) who helped at various stages in the research. We also wish to thank Dr. Frances Osborn for revising and correcting the English text. Finally, we wish to thank Elier Diaz (IIBCA, Universidad de Oriente, Cumana, Venezuela), who has been of great assistance in this study, working beyond the call of duty in order to complete the mission.
References
1. Dirección de Vigilancia Epidemiologica, MSDS, Venezuela. Epide-miological Bulletin, year 54 (2005), epideEpide-miological week 52, period from 12-26 to 1-01. www.msds.gov.ve. Accessed January 12, 2005. 2. Snounou G, Viriyakosol S, Jarra W, Thaithong S, Brown KN. Identi-fication of the four human malaria parasite species in field samples by the polymerase chain reaction and detection of a high prevalence of mixed infections. Mol Biochem Parasitol 1993; 58: 283-292. 3. Shiff CJ, Premji Z, Minjas JN. The rapid manual ParaSight-F test. A
new diagnostic tool for Plasmodium falciparum infection. Trans R
Soc Trop Med Hyg 1993; 87: 646-648.
4. Moody A. Rapid diagnostic tests for malaria parasites. Clin Microbiol Rev 2002; 15: 66-78.
7. Black J, Hommel M, Snounou G, Pinder M. Mixed infections with
Plasmodium falciparum and P. malariae and fever in malaria. Lancet
1994; 343: 1095.
8. Singh B, Cox-Singh J, Miller AO, Abdullah MS, Snounou G, Rahman HA. Detection of malaria in Malaysia by nested polymerase chain reaction amplification of dried blood spots on filter papers. Trans R Soc Trop Med Hyg 1996; 90: 519-521.
9. Mercereau-Puijalon O, Fandeur T, Bonnefoy S, Jacquemot C, Sarthou JL. A study of the genomic diversity of Plasmodium falcipa-rum in Senegal. 2. Typing by the use of the polymerase chain reaction. Acta Trop 1991; 49: 293-304.
10. Roper C, Elhassan IM, Hviid L, Giha H, Richardson W, Babiker H, et al. Detection of very low level Plasmodium falciparum infections using the nested polymerase chain reaction and a reassessment of the epidemiology of unstable malaria in Sudan. Am J Trop Med Hyg
1996; 54: 325-331.
11. Farnert A, Arez AP, Correia AT, Bjorkman A, Snounou G, do Rosario V. Sampling and storage of blood and the detection of malaria parasites by polymerase chain reaction. Trans R Soc Trop Med Hyg
1999; 93: 50-53.
12. Pouillot R, Gerbier G, Gardner IA. “TAGS”, a program for the evalu-ation of test accuracy in the absence of a gold standard. Prev Vet Med 2002; 53: 67-81.
13. Cortese JF, Caraballo A, Contreras CE, Plowe CV. Origin and dissemination of Plasmodium falciparum drug-resistance mutations in South America. J Infect Dis 2002; 186: 999-1006.
14. McManus DP, Bowles J. Molecular genetic approaches to parasite identification: their value in diagnostic parasitology and systematics.
Int J Parasitol 1996; 26: 687-704.
15. Zaman S, Tan L, Chan HH, Aziz L, Abdul-Samat S, Wahid R, et al. The detection of Plasmodium falciparum and P. vivax in DNA-extracted blood samples using polymerase chain reaction. Trans R Soc Trop Med Hyg 2001; 95: 391-397.
16. Postigo M, Mendoza-Leon A, Perez HA. Malaria diagnosis by the polymerase chain reaction: a field study in south-eastern Venezu-ela. Trans R Soc Trop Med Hyg 1998; 92: 509-511.
17. Kolaczinski J, Mohammed N, Ali I, Ali M, Khan N, Ezard N, et al. Comparison of the OptiMAL rapid antigen test with field microscopy for the detection of Plasmodium vivax and P. falciparum: consider-ations for the application of the rapid test in Afghanistan. Ann Trop Med Parasitol 2004; 98: 15-20.
18. Palmer CJ, Lindo JF, Klaskala WI, Quesada JA, Kaminsky R, Baum MK, et al. Evaluation of the OptiMAL test for rapid diagnosis of
Plasmodium vivax and Plasmodium falciparum malaria. J Clin Mi-crobiol 1998; 36: 203-206.
19. Aslan G, Ulukanligil M, Seyrek A, Erel O. Diagnostic performance characteristics of rapid dipstick test for Plasmodium vivax malaria.
Mem Inst Oswaldo Cruz 2001; 96: 683-686.
20. Iqbal J, Khalid N, Hira PR. Comparison of two commercial assays with expert microscopy for confirmation of symptomatically diag-nosed malaria. J Clin Microbiol 2002; 40: 4675-4678.
21. Soto TA, Solari ZL, Mendoza RD, Llanos-Cuentas A, Magill A. Evaluation of the rapid diagnostic test OptiMAL for diagnosis of malaria due to Plasmodium vivax. Braz J Infect Dis 2004; 8: 151-155.
22. Zakeri S, Najafabadi ST, Zare A, Djadid ND. Detection of malaria parasites by nested PCR in south-eastern Iran: evidence of highly mixed infections in Chahbahar district. Malar J 2002; 1: 2. 23. Quintana M, Piper R, Boling HL, Makler M, Sherman C, Gill E, et al.
Malaria diagnosis by dipstick assay in a Honduran population with coendemic Plasmodium falciparum and Plasmodium vivax. Am J Trop Med Hyg 1998; 59: 868-871.
24. Ferro BE, Gonzalez IJ, Carvajal F, Palma GI, Saravia NG. Perfor-mance of OptiMAL(R) in the diagnosis of Plasmodium vivax and
Plasmodium falciparum infections in a malaria referral center in Colombia. Mem Inst Oswaldo Cruz 2002; 97: 731-735.
25. Bualombai P, Prajakwong S, Aussawatheerakul N, Congpoung K, Sudathip S, Thimasarn K, et al. Determining cost-effectiveness and cost component of three malaria diagnostic models being used in remote non-microscope areas. Southeast Asian J Trop Med Public Health 2003; 34: 322-333.
26. Ndao M, Bandyayera E, Kokoskin E, Gyorkos TW, MacLean JD, Ward BJ. Comparison of blood smear, antigen detection, and nested-PCR methods for screening refugees from regions where malaria is endemic after a malaria outbreak in Quebec, Canada. J Clin Microbiol 2004; 42: 2694-2700.
27. Miller RS, McDaniel P, Wongsrichanalai C. Following the course of malaria treatment by detecting parasite lactate dehydrogenase en-zyme. Br J Haematol 2001; 113: 558-559.
28. Caraballo A, Ache A. The evaluation of a dipstick test for Plasmo-dium falciparum in mining areas of Venezuela. Am J Trop Med Hyg
1996; 55: 482-484.
29. Verle P, Binh LN, Lieu TT, Yen PT, Coosemans M. ParaSight-F test to diagnose malaria in hypo-endemic and epidemic prone regions of Vietnam. Trop Med Int Health 1996; 1: 794-796.
30. Singh N, Singh MP, Sharma VP. The use of a dipstick antigen-capture assay for the diagnosis of Plasmodium falciparum infection in a remote forested area of central India. Am J Trop Med Hyg 1997; 56: 188-191.
31. Humar A, Ohrt C, Harrington MA, Pillai D, Kain KC. Parasight F test compared with the polymerase chain reaction and microscopy for the diagnosis of Plasmodium falciparum malaria in travelers. Am J Trop Med Hyg 1997; 56: 44-48.
32. Figueiredo Filho AF, Figueredo MC, Nascimento JM, Calvosa VS, Povoa MM, Machado RL. Performance of an immunochromatogra-phy test for vivax malaria in the Amazon region, Brazil. Rev Saúde Pública 2003; 37: 390-392.
33. Iqbal J, Muneer A, Khalid N, Ahmed MA. Performance of the OptiMAL test for malaria diagnosis among suspected malaria pa-tients at the rural health centers. Am J Trop Med Hyg 2003; 68: 624-628.
34. Grobusch MP, Hanscheid T, Gobels K, Slevogt H, Zoller T, Rogler G, et al. Comparison of three antigen detection tests for diagnosis and follow-up of falciparum malaria in travellers returning to Berlin, Germany. Parasitol Res 2003; 89: 354-357.
35. Coleman RE, Maneechai N, Rachapaew N, Kumpitak C, Soyseng V, Miller RS, et al. Field evaluation of the ICT Malaria Pf/Pv immuno-chromatographic test for the detection of asymptomatic malaria in a