www.atmos-chem-phys.net/16/3413/2016/ doi:10.5194/acp-16-3413-2016
© Author(s) 2016. CC Attribution 3.0 License.
A global simulation of brown carbon: implications for
photochemistry and direct radiative effect
Duseong S. Jo1, Rokjin J. Park1, Seungun Lee1, Sang-Woo Kim1, and Xiaolu Zhang2
1School of Earth and Environmental Science, Seoul National University, Seoul, 151-747, Republic of Korea 2Department of Civil and Environmental Engineering, University of California, Davis, CA, USA
Correspondence to:Rokjin J. Park ([email protected])
Received: 20 July 2015 – Published in Atmos. Chem. Phys. Discuss.: 15 October 2015 Revised: 3 March 2016 – Accepted: 3 March 2016 – Published: 16 March 2016
Abstract. Recent observations suggest that a certain frac-tion of organic carbon (OC) aerosol effectively absorbs so-lar radiation, which is also known as brown carbon (BrC) aerosol. Despite much observational evidence of its presence, very few global modelling studies have been conducted be-cause of poor understanding of global BrC emissions. Here we present an explicit global simulation of BrC in a global 3-D chemical transport model (GEOS-Chem), including global BrC emission estimates from primary (3.9±1.7 and 3.0±1.3 TgC yr−1 from biomass burning and biofuel) and secondary (5.7 TgC yr−1 from aromatic oxidation) sources.
We evaluate the model by comparing the results with ob-served absorption by water-soluble OC in surface air in the United States, and with single scattering albedo observations at Aerosol Robotic Network (AERONET) sites all over the globe. The model successfully reproduces the seasonal vari-ations of observed light absorption by water-soluble OC, but underestimates the magnitudes, especially in regions with high secondary source contributions. Our global simulations show that BrC accounts for 21 % of the global mean surface OC concentration, which is typically assumed to be scatter-ing. We find that the global direct radiative effect of BrC is nearly zero at the top of the atmosphere, and consequently decreases the direct radiative cooling effect of OC by 16 %. In addition, the BrC absorption leads to a general reduction of NO2photolysis rates, whose maximum decreases occur in Asia up to −8 % (−17 %) on an annual (spring) mean ba-sis. The resulting decreases of annual (spring) mean surface ozone concentrations are up to−6 % (−13 %) in Asia, indi-cating a non-negligible effect of BrC on photochemistry in this region.
1 Introduction
Carbonaceous aerosols (CAs) are one of the most poorly un-derstood aerosols (Goldstein and Galbally, 2007; Park et al., 2003) and are divided into black carbon (BC) and organic carbon (OC) aerosols. These two types of CAs are emitted together mainly by combustion processes (except for sec-ondary organic carbon, SOC). In the literature, BC is consid-ered as light-absorbing and OC as light-scattering aerosols until recently. Therefore, the climatic effect of CAs depends on the relative contributions of BC to CAs. For example, the net direct radiative forcing (DRF) of biomass burning is es-timated to be negligible, whereas diesel use causes climate warming, although the first source is larger than the latter with regard to CAs (Forster et al., 2007).
Many field observations and chamber studies recently showed that a certain fraction of OC could absorb solar ra-diation, especially for ultra-violet wavelengths (<400 nm) (Alexander et al., 2008; Hecobian et al., 2010; Kirchstet-ter and Thatcher, 2012; KirchstetKirchstet-ter et al., 2004; Yang et al., 2009). This light-absorbing OC fraction is referred to as brown carbon (BrC) aerosol (Andreae and Gelencser, 2006; Laskin et al., 2015). If BrC is prevalent, and its DRF is sig-nificant, then previous estimates of the DRF of CAs need to be revised.
wave-lengths below 400 nm. Chung et al. (2012) found that OC contributes about 45 % of CA absorption at 520 nm by an-alyzing observations at the Gosan site in South Korea. Us-ing aerosol optical property observations at Aerosol Robotic Network (AERONET) sites, Bahadur et al. (2012) estimated that BrC absorption at 440 nm is about 40 % of BC absorp-tion at the same wavelength, whereas at 675 nm it is less than 10 % of BC absorption.
Several efforts have also been made to examine the chemi-cal and physichemi-cal properties of BrC. Some studies showed that humic-like substances (HULIS) were related to BrC (Hoffer et al., 2006; Kim and Paulson, 2013; Lukács et al., 2007) based on the high absorption Ångström exponent (AAE) of HULIS in the range of 6–7, indicating that the specific ab-sorption increases substantially towards the shorter wave-lengths (Hoffer et al., 2006), although the sources and the dominating chromophores of HULIS have not clearly been revealed yet (Moise et al., 2015; Graber and Rudich, 2006). Alexander et al. (2008) observed individual BrC spheres in East Asian outflows, and showed that the characteristics of BrC spheres (AAE of 1.5) were different from those of HULIS and also strongly absorbing. On the other hand, sev-eral classes of compounds have been identified as poten-tial contributions to BrC – nitroaromatic compounds, such as nitrophenols, imidazole-based and other N-heterocyclic compounds, and quinones (Laskin et al., 2015). Further-more, SOC produced from aromatic species has been found to absorb solar radiation, especially in high-NOx conditions (Jaoui et al., 2008; Laskin et al., 2015; Lin et al., 2015; Liu et al., 2012; Nakayama et al., 2010, 2013; Yu et al., 2014; Zhong and Jang, 2011).
Even though the chemical composition of BrC is not clearly understood yet, observations strongly indicate possi-ble important sources of BrC (Laskin et al., 2015). Using the positive matrix factorisation analysis of absorption at 365 nm over the southeastern United States in 2007, Hecobian et al. (2010) showed that biomass burning was the most dom-inant source of BrC (55 %), followed by SOC (26–34 %). Many other studies have also suggested biomass burning as the most important BrC source (Chakrabarty et al., 2010; Clarke et al., 2007; Favez et al., 2009; Hoffer et al., 2006; Kirchstetter and Thatcher, 2012; Kirchstetter et al., 2004; McMeeking, 2008; Saleh et al., 2014). Several studies re-cently proposed SOC as an additional BrC source, especially when it is aged in the atmosphere (Bones et al., 2010; Flores et al., 2014; Hawkins et al., 2014; Jaoui et al., 2008; Laskin et al., 2014, 2010; Liu et al., 2014; Nakayama et al., 2010, 2013; Nguyen et al., 2012; Updyke et al., 2012; Zhang et al., 2011; Zhong and Jang, 2011).
Despite the ample observational studies, very few mod-elling studies have been conducted to simulate global and regional distributions of BrC and to further quantify its ra-diative effect (Feng et al., 2013; Jacobson, 2001; Lin et al., 2014; Park et al., 2010; Wang et al., 2014). Jacobson (2001) first assumed 10 % of OC as a solar-absorbing aerosol in a
model, and this assumption resulted in an increase of the global DRF by 0.03–0.05 W m−2. Park et al. (2010) esti-mated BrC concentrations in East Asia using the mass ra-tio of BrC to BC, and the resulting annual clear-sky DRF of BrC over East Asia was 0.05 W m−2. Feng et al. (2013) simulated global BrC concentrations by considering 92 % of OC from biomass burning and biofuel use as BrC, and esti-mated 0.09 W m−2for the global clear-sky DRF of BrC. Lin
et al. (2014) calculated the DRF of OC by assuming that all of the biomass burning and the biofuel OC is BrC, and all of the SOC (as a high-absorbing case) as BrC. They estimated the global clear-sky DRF of OC as−0.20 W m−2.
In this study, we estimate global primary BrC emissions from open burning and biofuel use based on a reported relationship between AAE and modified combustion effi-ciency (MCE) (McMeeking, 2008). In addition to the pri-mary source above, we also consider SOC produced from aromatic oxidation as a secondary source of BrC (Hecobian et al., 2010; Jaoui et al., 2008; Lin et al., 2015; Nakayama et al., 2010; Nakayama et al., 2013; Zhong and Jang, 2011). Based on these sources, a global distribution of BrC concen-trations is explicitly simulated for the entire year of 2007 us-ing a global 3-D chemical transport model (GEOS-Chem). We evaluate the model by comparing its results with obser-vations in the United States and all over the globe. Using the best estimate of annual mean BrC concentrations, we exam-ine the global direct radiative effect (DRE) of BrC and its effect on photochemistry.
2 BrC emissions
In this section, we discuss our method to estimate primary and secondary sources of BrC, and provide explicit global BrC emissions. The primary and secondary sources include biomass burning and biofuel use, and the production from aromatic volatile organic compounds (VOCs), respectively. Estimated global emissions are used as input for GEOS-Chem below to explicitly simulate spatial and temporal dis-tributions of BrC concentrations.
2.1 Primary sources
Biomass burning is the largest source of CAs globally (Bond et al., 2004). OC is primarily emitted during the smoldering (low-temperature burning) phase of combustion (Chakrabarty et al., 2010, 2014; Schnaiter et al., 2006), whereas BC is preferentially emitted from the flaming (high-temperature burning) phase. Therefore, BrC is also emitted largely during the smoldering phase of burning. Here we use the relationship between the burning efficiency and the ob-served aerosol light absorption to estimate the BrC emission from biomass burning.
effi-ciencies that can be categorised into flaming versus smol-dering combustion (Kaufman et al., 1998; Ward et al., 1992; Ward and Hao, 1991). For example, Reid et al. (2005) used a MCE value of 0.9 to differentiate between flaming (MCE>0.9) and smoldering combustion (MCE<0.9). MCE= 1CCO2
1CCO2+1CCO
, (1)
where1C is the change in species concentration in fire off-gas relative to clean air [molecules m−3].
McMeeking (2008) further found a linear relationship be-tween the observed attenuation Ångström exponents and the calculated MCE values from a number of biomass burning samples, as shown in Eq. (2).
Å= −17.34×MCE+18.20, (2) where Å is the AAE of biomass burning samples.
The coefficient of determination (R2)of the relationship in Eq. (2) is 0.39, so the associated uncertainty appears to be significant. However, the negative relationship between AAE and MCE in Eq. (2) is robust as identified by previous stud-ies (Saleh et al., 2014; Kirchstetter and Thatcher, 2012). For example, absorption of aerosols from biomass burning can be contributed by either BC or BrC, or both (Moise et al., 2015). As discussed above, the absorption of carbonaceous aerosols is mainly caused by BC at high-MCE conditions (>0.9); in contrast, the BC/CA ratio is almost zero at low-MCE conditions (<0.8) (McMeeking, 2008). Using Eq. (2), we calculate AAE values of 0.86 and 4.3 at MCE values of 1.0 and 0.8, respectively, and each calculated AAE is in good agreement with the observed BC (0.86) and BrC AAE (5.0) from biomass burning samples measured by Kirchstetter and Thatcher (2012). Saleh et al. (2014) also showed that the BC to OC ratio (proportional to MCE) has a negative relationship with AAE.
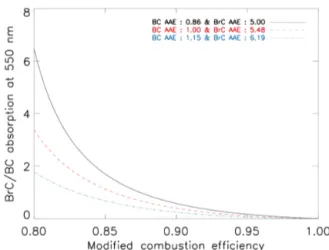
In addition, we are able to obtain the BrC/BC absorp-tion ratio using AAE. In Appendix A, we present a de-tailed description of our method for estimating the relation-ship between the BrC/BC absorption ratio and AAE. Our method assumes external mixing, and this assumption can cause uncertainties when particles are internally mixed (such as the coating effect). For uncertainty analysis, we calculate three BrC/BC absorption cases as shown in Fig. 1, which shows the estimated BrC/BC absorption ratio at 550 nm as a function of MCE. Different lines indicate different AAEs of BC and BrC according to the Table 1 of Kirchstetter and Thatcher (2012). They calculated BC AAE and BrC AAE using 115 wood smoke samples. For the calculation of BrC AAE, BC AAE had to be decided, and they assumed three different BC AAEs (0.86, 1.00, 1.15) based on their smoke samples and previous studies. Resulting BrC AAEs were 5.00, 5.48, and 6.19. We conduct three simulations accord-ing to the Fig. 1, as described later in this section. For high-MCE conditions (>0.95), the BrC contribution to the CA
Figure 1.Estimated absorption ratios of BrC to BC at 550 nm as a function of MCE. We assume that the CA absorption is only contributed by BC and BrC absorption. Black solid line indicates case 1, red dashed line represents case 2, and blue dotted line shows case 3.
absorption is negligible, whereas it becomes significant for low-MCE conditions (<0.85).
We calculate the MCE of biomass burning based on the Fire Inventory from NCAR (National Center for Atmo-spheric Research) (FINN) (Wiedinmyer et al., 2011) with vegetation-dependent emission factors of CO2and CO using Eq. (3) as follows:
MCE= 1CCO2 1CCO2+1CCO
= EFCO2/MWCO2
EFCO2/MWCO2+EFCO/MWCO
, (3)
where EF is the emission factor [g-species kg-dry matter−1] and MW is the molecular weight [g-species mole−1].
Finally, mass absorption efficiency (MAE), which is used for converting light absorption to mass concentration, is needed to obtain the BrC/BC mass ratio from the BrC/BC absorption ratio. For the fresh BC MAE at 550 nm, we use the value of 7.5 m2g−1 recommended by Bond and
Bergstrom (2006) (Nakayama et al., 2013; Park et al., 2010). For BrC, a large range of MAE values (0.09–4.1 m2g−1
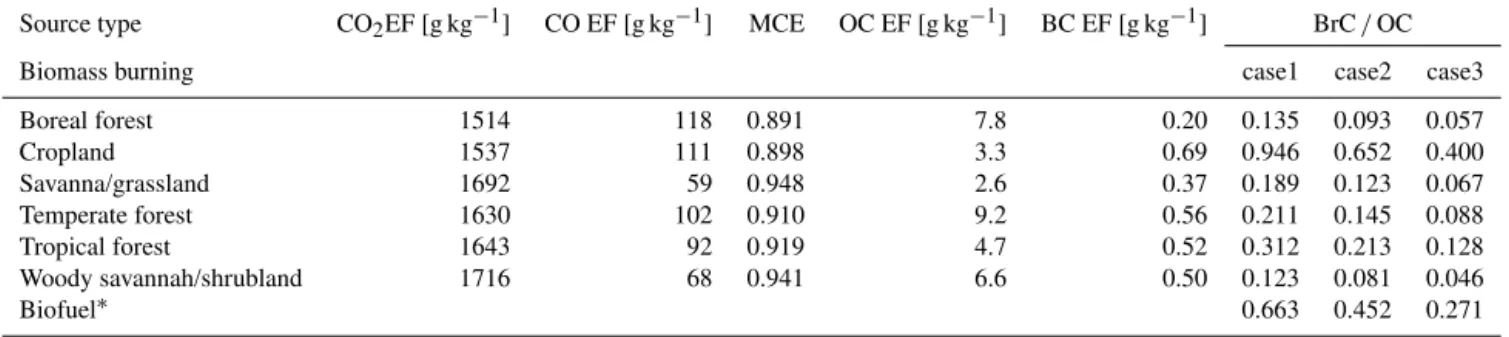
Table 1.Emission factors (EFs) and calculated parameters used for primary BrC emission estimates. Biomass burning emission is classified for six vegetation types based on the FINN inventory. Here BrC/OC is the mass ratio of BrC to OC emitted from biomass burning and
biofuel use.
Source type CO2EF [g kg−1] CO EF [g kg−1] MCE OC EF [g kg−1] BC EF [g kg−1] BrC/OC
Biomass burning case1 case2 case3
Boreal forest 1514 118 0.891 7.8 0.20 0.135 0.093 0.057 Cropland 1537 111 0.898 3.3 0.69 0.946 0.652 0.400 Savanna/grassland 1692 59 0.948 2.6 0.37 0.189 0.123 0.067 Temperate forest 1630 102 0.910 9.2 0.56 0.211 0.145 0.088 Tropical forest 1643 92 0.919 4.7 0.52 0.312 0.213 0.128 Woody savannah/shrubland 1716 68 0.941 6.6 0.50 0.123 0.081 0.046
Biofuel∗ 0.663 0.452 0.271
∗Detailed information is given in Table 2.
(Chung et al., 2012; Favez et al., 2009; Yang et al., 2009). For the primary BrC MAE, we use 1.0 m2g−1at 550 nm based
on McMeeking (2008), who conducted a number of MAE measurements of biomass burning samples (∼30 unique fu-els tested in∼230 burns) using both filter-based and optical-based methods. In brief, we use the MAE values of 7.5 and 1.0 m2g−1at 550 nm for BC and primary BrC, respectively.
But at a shorter wavelength, a higher MAE value was used for primary BrC (e.g. 5.3 m2g−1at 365 nm as discussed in Sect. 4).
Using the results in Fig. 1 with Eq. (3), we calculate the EF (mass) ratio of BrC to OC as summarised in Table 1. The EF ratio of BrC to OC differs for each vegetation type and assumed BC AAE (0.86–1.15). Among different vegetation types, cropland burning shows the highest BrC to OC mass ratio, driven by the low MCE and the highest ratio of BC to OC EF. Because we calculate the BrC to OC EF ratio by multiplying the BrC to BC EF ratio by the BC to OC ratio, the high BC to OC ratio can lead to a high BrC to OC ra-tio. Although Table 1 shows the highest BrC/OC ratio from cropland burning, its contribution to the global BrC emission is small because the OC emission from the cropland is the lowest (Wiedinmyer et al., 2011). Instead, the tropical for-est burning is the highfor-est, and the resulting total BrC emis-sion from biomass burning is 3.9±1.7 TgC yr−1, which con-tributes about 17±7 % of total OC emission from biomass burning (22.7 TgC yr−1)(Wiedinmyer et al., 2011).
Our method of estimating BrC emissions from biofuel use is similar to that of estimating emissions from biomass burn-ing. We estimate BrC/OC ratio using the MCE and BC to OC ratio in the same way as the biomass burning estimates. The only difference is that the biofuel emission of each sec-tor is not known (the biomass burning emission is known for each vegetation type). Therefore, we first estimate OC biofuel emissions from each biofuel category with the infor-mation given by previous studies (Bond et al., 2007, 2004; Fernandes et al., 2007). Because there is no clear evidence that BrC is emitted by dung, charcoal, and the industrial sec-tor, here we consider only fuelwood and agricultural residue
as BrC sources. Fuelwood burning is the largest contribu-tor to biofuel BrC emission. Our estimate of BrC/OC mass ratio is 0.271–0.663 from biofuel use. Overall results are summarised in Table 2. Note that base year of Table 2 is 2000 because previous studies reported their values based on 2000. We scale up the emission for 2007 as described in Sect. 3.2. Resulting BrC emission from biofuel use is 3.0±1.3 TgC yr−1, which is comparable to BrC emission from biomass burning.
2.2 Secondary source
We consider SOC as a source of BrC in the model based on the observed optical characteristic of SOC, depending on its chemical formation, as follows: (1) anthropogenic (aromatic) SOCs tend to absorb solar radiation more efficiently than bio-genic SOCs (Jacobson, 1999; Nakayama et al., 2010; Zhong and Jang, 2011; Zhong et al., 2012); (2) the solar absorption efficiency increases as SOCs undergo atmospheric aging pro-cesses (Bones et al., 2010; Lambe et al., 2013; Laskin et al., 2015, 2010; Updyke et al., 2012); (3) SOCs formed in in-organic seeds have a darker colour than others (Jaoui et al., 2008; Nakayama et al., 2013; Zhong and Jang, 2011; Zhong et al., 2012); moreover, SOCs become darker when they un-dergo aging in the presence of nitrogen-containing inorganic gases and aerosols (Bones et al., 2010; Laskin et al., 2010; Liu et al., 2012).
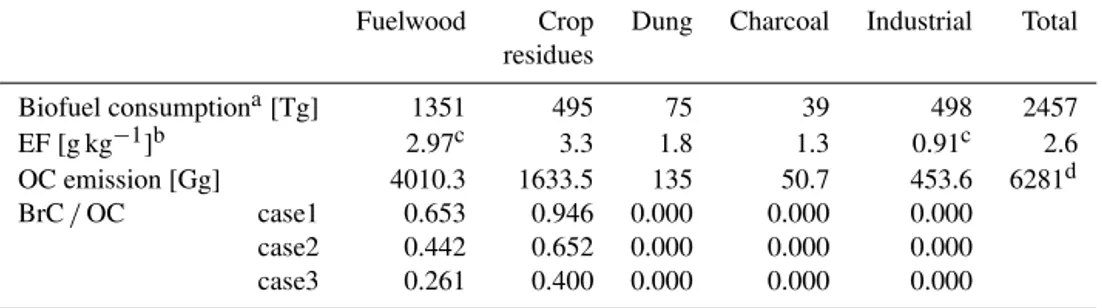
Table 2.Global biofuel consumption estimates, EFs of OC, and OC biofuel emission estimates for each biofuel category. Base year is 2000.
Fuelwood Crop Dung Charcoal Industrial Total
residues
Biofuel consumptiona[Tg] 1351 495 75 39 498 2457
EF [g kg−1]b 2.97c 3.3 1.8 1.3 0.91c 2.6
OC emission [Gg] 4010.3 1633.5 135 50.7 453.6 6281d
BrC/OC case1 0.653 0.946 0.000 0.000 0.000
case2 0.442 0.652 0.000 0.000 0.000
case3 0.261 0.400 0.000 0.000 0.000
aFrom Fernandes et al. (2007).bFrom Bond et al. (2004).cGlobal mean value is estimated from Bond et al. (2004).dFrom
GEOS-Chem biofuel OC inventory (carbon_200909) by Bond et al. (2007).
some brown SOCs can be bleached when they undergo pho-todissociation (Zhong and Jang, 2011; Sareen et al., 2013). Furthermore, browning reactions can be accelerated by cloud and fog processing of aerosols (Moise et al., 2015), which are not considered in this study. More detailed treatments of the chemical aging of BrC are needed in future BrC models.
BrC from anthropogenic SOC has different optical prop-erties (i.e. MAE, imaginary refractive index) compared with BrC from wood burning. Therefore, we apply different op-tical parameters for the model evaluation (Sect. 4) such as 5.3 m2g−1 (McMeeking, 2008) for primary BrC and
1.5 m2g−1 (Nakayama et al., 2010) for secondary BrC at
365 nm (note that the MAE of primary BrC at 550 nm is 1.0 m2g−1as discussed in Sect. 2.1). The estimated annual
source of secondary BrC is 5.7 TgC yr−1, which contributes
45 % of total BrC sources.
3 Model description 3.1 General
We use the GEOS-Chem (version 9.1.2) global 3-D chemical transport model (Bey et al., 2001) to simulate BrC for 2007. The model is driven by Modern Era Retrospective-analysis for Research and Applications (MERRA) assimilated mete-orological data from the Global Modelling and Assimilation Office Goddard Earth Observing System (Rienecker et al., 2011). The data include winds, precipitation, temperature, boundary layer height, and other meteorological variables at 0.5◦×0.667◦horizontal resolutions, but are degraded to
2◦×2.5◦for computational efficiency.
We conduct a fully coupled oxidant–aerosol simulation, including SO2−
4 –NO−3–NH+4, soil dust, and sea salt aerosols. The simulation of carbonaceous aerosols in the GEOS-Chem is based on Park et al. (2003, 2006). The model carries BC and POC (primary organic carbon), with a hydrophobic and hydrophilic fraction for each. We assume that 80 % of BC and 50 % of POC are emitted as hydrophobic (the rest is hydrophilic), then hydrophobic aerosols become hydrophilic with ane-folding time of 1.15 days (Cooke et al., 1999). For
the SOC simulation, we use the VBS approach based on Jo et al. (2013). All SOC is considered as hydrophilic, and more details are described in previous SOC studies (Chung and Se-infeld, 2002; Henze and SeSe-infeld, 2006; Henze et al., 2008; Jo et al., 2013; Liao et al., 2007). Note that we consider only the carbon mass of OC including BrC as discussed below, to avoid uncertainties involved in converting organic carbon to organic matter concentrations, which is typically done by multiplying a constant ratio (e.g. 1.4–2.1) (Aiken et al., 2008; Turpin and Lim, 2001).
3.2 Emissions
We use fossil fuel and biofuel emissions of CAs for 2000 with no monthly variations from Bond et al. (2007). How-ever, domestic wood burning for heating has strong sea-sonal dependency, so we additionally use the Monitoring At-mospheric Composition and Climate/City Zen (MACCity) emission inventory (Diehl et al., 2012; Granier et al., 2011) to obtain seasonal variations of global biofuel emissions and to scale up for 2007. For this, we divide the whole globe into re-gions with similar seasonality according to the Atmospheric Chemistry and Climate Model Intercomparison Project (AC-CMIP) (Lamarque et al., 2010), which is the basis of the MACCity inventory. We apply the annual trend of each AC-CMIP region to the emissions from Bond et al. (2007). The emissions for each region and trends are listed in Tables S1 and S2 in the Supplement.
4 Model evaluation
We conduct a model evaluation using the observed light ab-sorption of WSOC measured by Hecobian et al. (2010) and Zhang et al. (2011, 2013) in the United States. The model evaluation allows us not only to validate simulated BrC con-centrations but also to examine each source contribution to BrC in the United States. We also use the global single scat-tering albedo (SSA) observations from the AERONET to evaluate the effect of including BrC on light absorption by aerosols over the globe.
4.1 United States
Prior to evaluating BrC simulations, we first focus on BC and OC aerosols in the model to examine the general model performance in simulating carbonaceous aerosol concentra-tions in the United States. We use BC and OC observaconcentra-tions from the Interagency Monitoring of Protected Visual Envi-ronments (IMPROVE) network for 2007 (Malm et al., 1994). Most sites were situated in rural regions, measuring back-ground concentrations of BC and OC. The data were avail-able every 3 days; more than 20 000 samples were used for our comparison. For comparison with the model results, we computed the observed monthly mean concentrations of BC and OC averaged on the 2◦×2.5◦model grid.
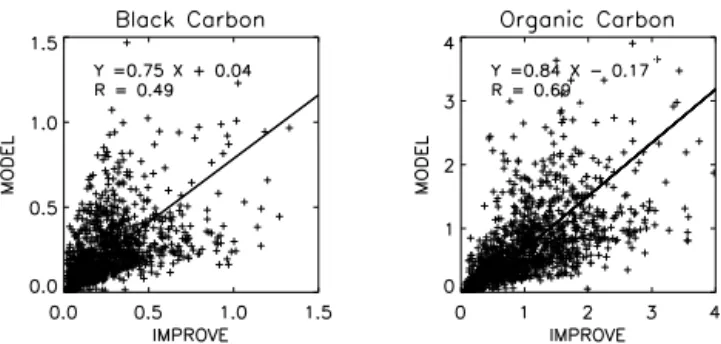
Figure 2 shows scatter plot comparisons of the observed and simulated monthly mean BC and OC concentrations in the United States. The model slightly underestimates both BC and OC over the United States, consistent with similar comparisons in Huang et al. (2013). We calculate the annual mean concentrations of the model using the simulated val-ues of model grid boxes corresponding to the IMPROVE net-work sites. The simulated annual mean BC concentration is 0.22 µgC m−3, which is 12 % lower than the observed mean value (0.25 µgC m−3). However, the bias in the model is larger for OC by 30 % (1.16 and 0.81 µgC m−3for observed
and simulated OC concentrations, respectively), which is ad-ditionally due to the underestimation of SOC in the model (Jo et al., 2013). This low bias for SOC can be reflected in the simulated BrC concentrations, which is discussed later in this section.
We use the light absorption observations of WSOC mea-sured using a UV–Vis spectrophotometer and long-path ab-sorption cell by Hecobian et al. (2010), and compare them with the light absorption by BrC in the model. Absorption coefficients of WSOC at 365 nm were measured at 15 sites in the southeastern United States in 2007. Among them, eight sites are in urban areas, and the others are in rural regions. Detailed descriptions of the measurements are available in Hecobian et al. (2010).
Because light absorption observations are measured only for soluble fractions of OC, and do not include water-insoluble components, we separate BrC in the model into water-soluble and water-insoluble components. The model
Figure 2.Scatter plot of simulated versus observed BC concentra-tions (left) and OC concentraconcentra-tions (right). Unit is µgC m−3. Values are monthly means for 2007. Regression equations and correlations are shown inset. Regression is computed with reduced major axis (RMA) method.
divides OC (or BrC) into hydrophilic and hydrophobic com-ponents. For the comparison, we do not use the simulated hy-drophilic fraction, but instead use an observed WSOC/OC ratio because the assumed division of hydrophobic and hy-drophilic fractions of OC and their conversion can be appli-cable in a global sense, but in a regional sense it may cause a significant discrepancy. For example, the observed water-soluble fraction of the total OC is generally low (of the or-der of 25 %) in the Los Angeles basin (Zhang et al., 2013); on the other hand, the model simulates a high water-soluble fraction of the total OC (63–74 %) in this region. For this rea-son, we decided to use the observed WSOC/OC ratio for the evaluations. In the southeastern United States, the observed WSOC/OC ratio is about 0.58 (Weber et al., 2007; Zhang et al., 2013), which is also used to estimate the water-soluble BrC concentrations from the total BrC concentrations in the model.
Because the model simulates a mass concentration of BrC, a conversion from the mass concentration to light absorp-tion is carried out by multiplying MAE values. For BrC from wood burning, we use the MAE value of 5.3 m2g−1
at 365 nm measured by McMeeking (2008) in order to retain the consistency between our emission estimates and the eval-uation. For BrC from SOC, we select the MAE of 1.5 m2g−1
at 365 nm calculated by Nakayama et al. (2010) (see Fig. 4 in their paper).
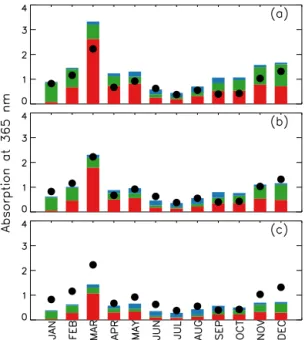
Figure 3 shows monthly mean simulated and observed light absorption coefficients of BrC at 365 nm averaged over all sites in the southeastern United States for 2007. Black cir-cles and coloured bars indicate the observed and simulated BrC absorption at 365 nm, respectively, and different colours in the bar show contributions from different sources. Each panel represents a different model simulation with each case of AAE selections as shown in Fig. 1 and Table 1.
burn-Figure 3.Simulated versus observed monthly mean light absorp-tion at 365 nm by water-soluble BrC over the southeastern United States in 2007. Unit is Mm−1. Black circles denote observations, and bar graphs indicate model results for each source: biomass burning (red), biofuel (green), and SOC (blue). Each panel shows the comparisons with different emission estimate cases –(a)case 1, (b)case 2, and(c)case 3.
ing (Hecobian et al., 2010). During the summer, the observed light absorptions decreased substantially.
The model generally captures the observed seasonal vari-ation with high absorption in the winter, having a peak in March and low absorption in the summer (Rof 0.93). On an annual mean basis, we find that the model is too high at 46 % for case 1, and is too low at−31 % for case 3, relative to the observations. The model for case 2 is in best agreement with the observations (4 %) on an annual mean basis.
The BrC source contribution in the model is similar to the observed source contribution. Hecobian et al. (2010) showed that biomass burning was the main contributor for the win-ter season, whereas the SOC contribution increased during the summer season. The simulated seasonal variation is con-sistent with the observation, as shown in Fig. 3. The annual mass contribution of SOC to BrC is 38 % (in case 2), which is in good agreement with the observed contribution of 32 % (Hecobian et al., 2010). Based on the results in Fig. 3, the model for the case 2 yields best estimates of BrC emissions. In addition to the observation by Hecobian et al. (2010), we use the light absorption observations by Zhang et al. (2011, 2013). Measurements were carried out in Atlanta, GA (33.778427◦N, 84.396181◦W), Pasadena,
CA (34.140528◦N, 118.122455◦W), and Riverside, CA
(33.97185◦N, 117.32266◦W) for a month or less. As
dis-cussed above, we apply the observed WSOC/OC ratio to the model BrC concentrations: 26 % for the Los Angeles basin
Figure 4.Simulated versus observed daily mean light absorption at 365 nm by water-soluble BrC over the United States in 2010; unit is Mm−1. Black circles denote observations and bar graphs indi-cate model results for each source – biomass burning (red), bio-fuel (green), and SOC (blue).
(Pasadena and Riverside) (Zhang et al., 2013) and 58 % for Atlanta (Weber et al., 2007; Zhang et al., 2013).
Figure 4 shows the daily mean observed and simulated light absorption coefficients from the best model (case 2) for Atlanta, Pasadena, and Riverside for 2010. The upper panel shows the comparison of the observed versus simulated light absorption for Atlanta. The highest observed daily absorption occurred on 24 August, but the model fails to reproduce it. Furthermore, the model generally overestimates the observed absorption by 44 %, and the large discrepancies mainly occur in September. This large discrepancy in September is similar to the result shown in Fig. 3b for 2007.
The middle and lower panels show the comparisons at the Los Angeles basin sites in May and June. The observed mean light absorptions at these sites (0.81 and 0.98 Mm−1
un-derestimation of the simulated SOC concentrations using the 1-D VBS (Jo et al., 2013).
We find from the model evaluation over the United States that the model generally captures the observed mean absorp-tion and its seasonal variability in the region where primary sources are dominant. On the other hand, the model underes-timates the observed mean absorption in the region with the dominant secondary sources. The low bias is partly explained by the SOC underestimation in the model. However, the un-derestimations of BrC from SOC (38–48 %) are higher than those of SOC (18 %), indicating the importance of additional secondary BrC sources that we did not include in the model. A MAE value for secondary BrC could be another possible reason for the bias in the model. Although chamber studies suggested weak absorbing characteristics of BrC from SOC (Nakayama et al., 2010, 2013; Zhong and Jang, 2011), some field observations speculated the existence of strongly ab-sorbing BrC from SOC (Alexander et al., 2008; Chung et al., 2012). For example, applying the MAE value of 3.5 m2g−1 at 365 nm (a half of the MAE at 365 nm from Alexander et al., 2008) for secondary BrC yields a similar mean absorp-tion value to the observaabsorp-tion over LA basin. Extensive ob-servations of optical characteristics of BrC depending on the formation mechanisms would be needed to reduce the asso-ciated uncertainties and to improve the model.
4.2 Evaluation against global AERONET observations No global observation of BrC is available yet. Here we use the observed SSA at AERONET sites to evaluate the model by focusing on the effect of BrC on the simulated aerosol ab-sorption. We also use observed aerosol optical depth (AOD) to evaluate the model capability to simulate aerosol mass concentrations.
For comparisons of AOD and SSA between the model and observations, we use FlexAOD (http://pumpkin.aquila.infn. it/flexaod/), which calculates AOD and SSA using simulated aerosol mass concentrations from GEOS-Chem with the Mie algorithm (Mischenko et al., 2002; Curci et al., 2015).
For optical properties of BrC, we use imaginary refractive indices of BrC from McMeeking (2008) for wood burning sources, and from Nakayama et al. (2010) for SOC sources. Detailed description of the values used in AOD and SSA cal-culation are provided in Sect. 6, where we discuss the DRE of BrC.
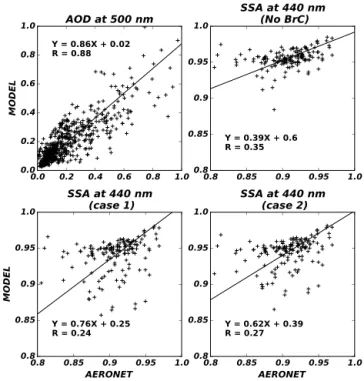
Figure 5 shows comparisons of monthly mean simulated versus observed AOD at 500 nm and SSA at 440 nm. We find that the model captures the observed AOD quite well with a regression slope of 0.86 and aRof 0.88. However, the model tends to overestimate the observed SSA, implying that the simulated aerosol concentrations appear to have too large a fraction of scattering aerosols. We find that the inclusion of BrC in the model reduces the high bias of simulated SSA by 33 and 23 % (lower left and lower right panel of Fig. 5), indicating a considerable contribution of BrC to aerosol
ab-0.0 0.2 0.4 0.6 0.8 1.0 0.0
0.2 0.4 0.6 0.8 1.0
MODEL
Y = 0.86X + 0.02 R = 0.88
AOD at 500 nm
0.8 0.85 0.9 0.95 1.0 0.8
0.85 0.9 0.95 1.0
Y = 0.39X + 0.6 R = 0.35
SSA at 440 nm
(No BrC)
0.8 0.85 0.9 0.95 1.0 AERONET
0.8 0.85 0.9 0.95 1.0
MODEL
Y = 0.76X + 0.25 R = 0.24
SSA at 440 nm
(case 1)
0.8 0.85 0.9 0.95 1.0 AERONET
0.8 0.85 0.9 0.95 1.0
Y = 0.62X + 0.39 R = 0.27
SSA at 440 nm
(case 2)
Figure 5.Scatter plots of simulated versus observed AOD at 500 nm (upper left), SSA at 440 nm without BrC (upper right), SSA at 440 nm with BrC of case 1 (lower left), and SSA at 440 nm with BrC of case 2 (lower right) for 2007. Reduced major axis regres-sion is shown along with the regresregres-sion equation andR. Each point
indicates monthly averaged AOD or SSA when the number of ob-servation is greater than 10 days.
sorption. Although the statistics suggest a greater improve-ment with case 1 in terms of the bias, simulated SSA values at sites in Africa with high BrC concentrations, are too low apart from the regression line (discrepancy>0.1). This re-sult also supports our selection of case 2 as the best model for BrC emission estimates.
Despite a decrease of simulated SSA with BrC, the model is still too high relative to the observations. The overestima-tion might be partly caused by the underestimaoverestima-tion of BC emissions from biomass burning (Bond et al., 2013). This is also supported by the fact that the discrepancy gets larger for biomass burning regions, where a difference between the model and AERONET SSA is 40 % higher than that in re-gions with high anthropogenic emissions. Emission factors of BC used in this study are 0.2–0.69 g kg−1(Wiedinmyer et
al., 2011), which are lower than the value of 1 g kg−1 used
by Chin et al. (2009), who found no significant bias in their model compared with the AERONET SSA. Lin et al. (2014) also reported a small bias in their model compared with AERONET SSA using 4.7 Tg yr−1of global annual biomass burning BC emissions, which is about 2 times higher than 2.2 Tg yr−1of this study.
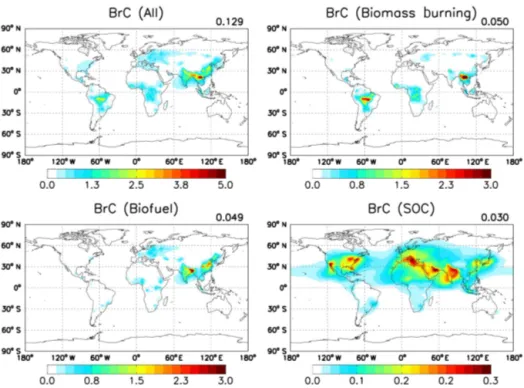
Figure 6.Annual surface map of total BrC (top left) and BrC from three source categories: biomass burning (top right), biofuel (bottom left), and SOC (bottom right). Mean values are presented in the upper right corner of each panel. Unit is µgC m−3.
a global top-down emission of BC is twice as large as the bottom-up estimates of BC based on the Kalman filter ap-proach. They suggested that BC emissions in East Asia, Southeast Asia, and eastern Europe are significantly underes-timated in current bottom-up emission inventories. This issue is critically important, and possibly has an important implica-tion for climate. However, an investigaimplica-tion of BC emissions for the SSA discrepancy above is beyond the scope of our work, and will be conducted in future studies.
Light absorption enhancement of aged BC could also be one of the reasons for the SSA overestimation in the model. Here we use the same optical parameters for all BC in the model. However, Bond et al. (2006) suggested that the ab-sorption of aged BC is about 1.5 times greater than that of fresh BC. BC aging occurs as it is mixed internally with other aerosols. If we assume hydrophilic BC as aged BC in the model and its absorption enhancement by a factor of 1.5 rel-ative to hydrophobic BC, the high bias of simulated SSA is additionally reduced by about 20 % (not shown).
We further compare the model against AERONET AAE as shown in Fig. S1 in the Supplement. We find that the model overestimates the observed AAE after including BrC, in part, because the model underestimates BC emissions as discussed above. However, the simulated AAE will be de-creased if we increase BC emissions as suggested by the top-down estimate (Cohen and Wang, 2014). For example, for regions (North America, Central America, South America, Southeast Asia, and Australia) where the difference between our BC emission and the top-down estimate is within a factor
of 2, we find that the model with BrC shows a better agree-ment with the observed AAE (Fig. S2) and with the observed SSA (Fig. S3).
Considering all these uncertainties, our evaluation above indicates that the model for case 2 results in the best esti-mates of simulated BrC concentrations, which will be used for examining BrC effects on climate and photochemistry below together with two other cases considered as the upper and lower limits of our estimates.
5 Global budgets
5.1 Annual surface concentration
Figure 6 shows our best estimates of annual mean concen-trations of BrC and each source contribution in surface air for 2007. Values are high in regions where biomass burn-ing (Southeast Asia and South America) and biofuel (East Asia and northeast India) sources are dominant. These pri-mary sources account for 77 % of BrC concentrations in sur-face air. On the other hand, secondary sources are relatively minor in the surface, but their contribution increases in the free troposphere, as discussed in Sect. 5.2.
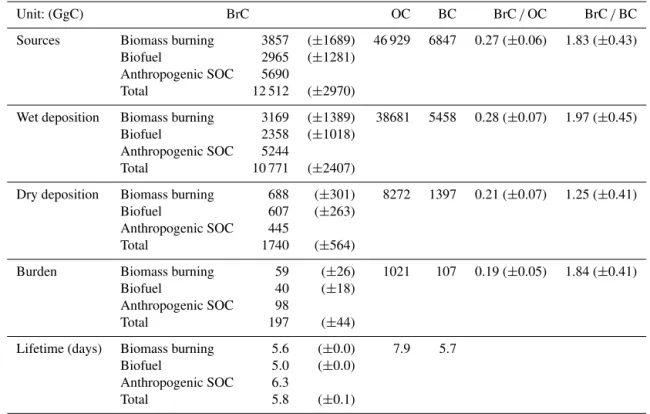
Table 3.Global tropospheric budgets of BrC compared to those of OC and BC. Uncertainties are indicated in the parentheses.
Unit: (GgC) BrC OC BC BrC/OC BrC/BC
Sources Biomass burning 3857 (±1689) 46 929 6847 0.27 (±0.06) 1.83 (±0.43)
Biofuel 2965 (±1281)
Anthropogenic SOC 5690
Total 12 512 (±2970)
Wet deposition Biomass burning 3169 (±1389) 38681 5458 0.28 (±0.07) 1.97 (±0.45)
Biofuel 2358 (±1018)
Anthropogenic SOC 5244
Total 10 771 (±2407)
Dry deposition Biomass burning 688 (±301) 8272 1397 0.21 (±0.07) 1.25 (±0.41)
Biofuel 607 (±263)
Anthropogenic SOC 445
Total 1740 (±564)
Burden Biomass burning 59 (±26) 1021 107 0.19 (±0.05) 1.84 (±0.41)
Biofuel 40 (±18)
Anthropogenic SOC 98
Total 197 (±44)
Lifetime (days) Biomass burning 5.6 (±0.0) 7.9 5.7
Biofuel 5.0 (±0.0)
Anthropogenic SOC 6.3
Total 5.8 (±0.1)
Figure 7.Annual mean ratios of BrC to BC (left) and OC (right) in surface air. Global mean values are presented in the upper right corner of each panel.
(South America and Africa) than in industrialised regions (East Asia, Europe, and the eastern United States) because more BrC than BC is emitted from biomass burning.
Similarly, the BrC to OC ratio is also high over the oceans because of secondary BrC, the concentrations of which in-crease with atmospheric aging. Over the continents, the ratio is smaller reflecting relatively fresh emissions of OC from anthropogenic sources that do not directly contribute to BrC. We find that the BrC to OC ratio is relatively high in regions with large biofuel use (northern India and central Asia). Al-though China is one of the largest emission source regions for BrC (Fig. 6), both BrC to BC and BrC to OC ratios are relatively low because of high concentrations of BC and OC.
Our global mean BrC to BC and BrC to OC ratios at the sur-face are 1.24 and 0.21, respectively, and are lower than the ratio (3.4 of BrC to BC ratio and 0.43 of BrC to OC ratio in terms of burden) of Feng et al. (2013), but higher than the ratio (1.0 of BrC to BC ratio) used in Park et al. (2010). 5.2 Tropospheric budget of BrC
Table 3 summarises our best estimates of the global tro-pospheric budgets of BrC, along with BC and OC. The global BrC source is 12.5±3.0 TgC yr−1, which accounts for 27 % of OC sources. Although the biofuel emission (6.5 TgC yr−1) is 3 times lower than the biomass
burn-ing emission (22.7 TgC yr−1)for OC, the biofuel emission
(3.0±1.3 TgC yr−1)becomes significant for BrC, contribut-ing about 43 % of primary sources. The secondary source of BrC is 5.7 TgC yr−1, and is comparable to the primary
sources (6.8±3.0 TgC yr−1).
Wet deposition is the main removal process for BrC, and accounts for 86 % of total removal processes. The remaining loss is due to dry deposition. The contribution of wet deposi-tion to total deposideposi-tion of BrC is similar to that of OC (82 %), because we treat BrC scavenging similarly to that of OC. Be-cause secondary BrC is produced all over the troposphere (not only at the surface) and is hydrophilic, most secondary BrC is removed through wet deposition processes (92 %).
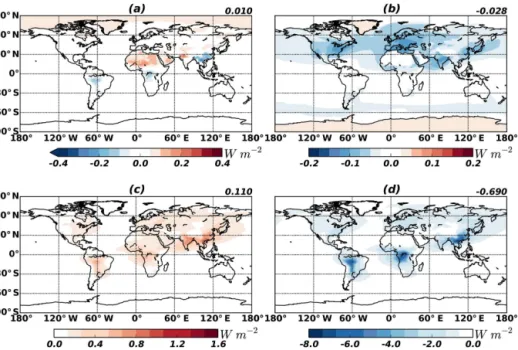
Figure 8.DRE of BrC at the top of the atmosphere. Upper panels are for radiative effect of BrC from primary sources(a)and from secondary sources(b). The DRE increase of OC owing to the absorption of BrC is shown in(c)(i.e. the DRE of OC with absorbing BrC minus the DRE of OC including BrC as scattering OC, which is typically assumed in previous studies). Radiative effect of total OC (BrC is assumed to be scattering OC) is represented in(d). The 70◦S–70◦N averages are shown in the upper right corner of each panel.
result is opposite to the source contributions in surface air shown in Fig. 6. The contribution of secondary BrC to the at-mospheric burden is twice as high as the contribution of sec-ondary BrC to the surface concentration (23 %), reflecting a relatively large production of BrC in the free troposphere as well as limited export of primary BrC from the surface to the free troposphere.
Our BrC lifetime is 5.8 days, which is lower than that of OC (7.9 days) because of different contributions of the sec-ondary sources for BrC and OC. The latter species includes a larger fraction of secondary species (52 %), the lifetime of which is usually longer than that of POC especially for not aged biogenic SOC (Jo et al., 2013). No significant differ-ence between the lifetimes of BrC and BC exists because BrC, which is more hydrophilic than BC, is more prone to wet scavenging than BC.
6 Direct radiative effect of BrC
We use imaginary refractive indices of BrC as a func-tion of wavelength for radiative transfer calculafunc-tions to ac-count for the wavelength dependency of the BrC absorp-tion. Imaginary refractive indices in the literature have a wide range of values, even from the same sources, such as wood burning (Chakrabarty et al., 2010; Kirchstetter et al., 2004; McMeeking, 2008). In order to maintain the consis-tency with BrC emission estimates from primary sources, we use the imaginary refractive indices reported by McMeek-ing (2008), which are 0.18, 0.14, and 0.10 at 370, 405,
and 532 nm, respectively. The values are interpolated with the AAE at every 50 nm wavelength interval for the radia-tive transfer calculations. For secondary BrC, values from Nakayama et al. (2010) are used with 0.047 and 0.007 at 355 and 532 nm, respectively, based on the measurements for SOC from toluene.
We calculate AOD, SSA, and asymmetry parameter us-ing FlexAOD, which is described in Sect. 4.2. Note that we calculate DRE rather than DRF. DRE is the instantaneous radiative impact of all atmospheric particles on the Earth’s energy balance, and DRF is the change in DRE from pre-industrial to present day (Heald et al., 2014). We use the rapid radiative transfer model for GCMs (general circulation mod-els) (RRTMGs) (Iacono et al., 2008) for DRE calculations. Wavelengths used for the calculation are 300, 304, 393, 533, 702, 1010, 1270, 1462, 1784, 2046, 2325, 2788, 3462, and 8021 nm. MERRA reanalysis data are used for albedo and other meteorological variables.
Figure 8a and b show the clear-sky DRE values of primary and secondary BrC concentrations. Because the imaginary refractive indices of BrC are between those of strongly ab-sorbing BC and scattering OC, the global mean DRE of BrC is close to zero, as shown in a and b.
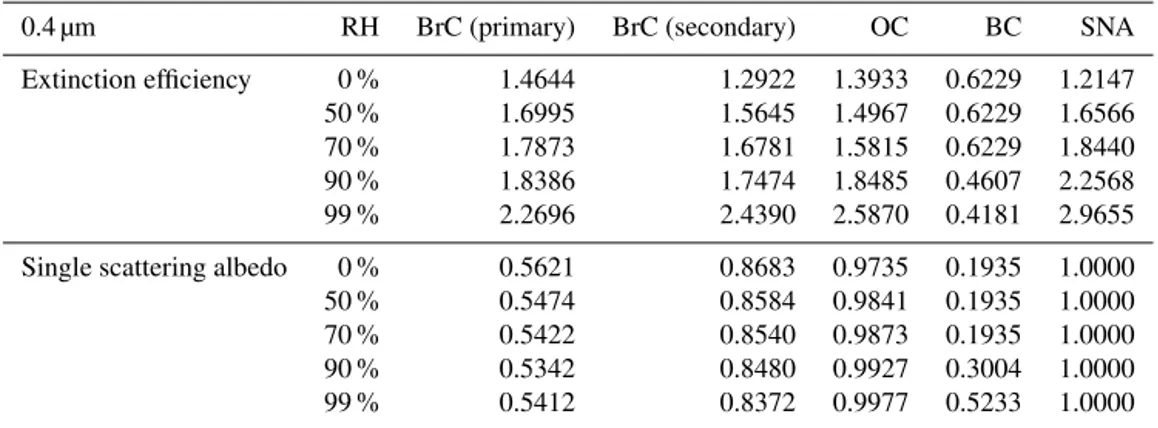
Table 4.Extinction efficiencies and SSAs of selected aerosols at 0.4 µm used for calculating photolysis rates in GEOS-Chem. SNA indicates inorganic salt comprised of sulfate, nitrate and ammonium aerosols.
0.4 µm RH BrC (primary) BrC (secondary) OC BC SNA
Extinction efficiency 0 % 1.4644 1.2922 1.3933 0.6229 1.2147
50 % 1.6995 1.5645 1.4967 0.6229 1.6566
70 % 1.7873 1.6781 1.5815 0.6229 1.8440
90 % 1.8386 1.7474 1.8485 0.4607 2.2568
99 % 2.2696 2.4390 2.5870 0.4181 2.9655
Single scattering albedo 0 % 0.5621 0.8683 0.9735 0.1935 1.0000
50 % 0.5474 0.8584 0.9841 0.1935 1.0000
70 % 0.5422 0.8540 0.9873 0.1935 1.0000
90 % 0.5342 0.8480 0.9927 0.3004 1.0000
99 % 0.5412 0.8372 0.9977 0.5233 1.0000
increased to−0.58 W m−2after considering BrC absorption.
Consequently, the cooling effect of OC is reduced by 16 %. Despite the negligible effect of BrC on DRE or DRF, its significance manifests for OC DRF estimates, which have been conducted based on the assumption of scattering OC. For example, AeroCom phase II simulations calculated −0.03 W m−2as the global mean DRF of POC from fossil fuel and biofuel, and−0.06 W m−2for that of SOC (Myhre et al., 2013). Because the biofuel emission is about twice as large as the fossil fuel emission (Bond et al., 2007), and one-half of OC from biofuel is BrC, one-third of the POC from fossil fuel and biofuel is BrC. Therefore, one-third of DRF (−0.01 W m−2)of POC in AeroCom is related to BrC, whose
DRF is close to zero. For SOC, because the pre-industrial biogenic SOC concentration is similar to present-day condi-tions, almost all DRF of SOC is from anthropogenic SOC. Based on previous SOC studies (Henze et al., 2008; Jo et al., 2013; Murphy and Pandis, 2010), approximately one-third of anthropogenic SOC is highly aged, and can thus be assumed to be BrC in this simple estimation. As a result, one-third of DRF (−0.02 W m−2)of SOC in AeroCom is related to BrC. The total DRF of BrC that was assumed to be scat-tering OC in the AeroCom study is−0.03 W m−2. Because DRF of BrC is almost negligible, the negative DRF of OC (−0.09 W m−2)in AeroCom could likely be overestimated
by 50 %. We think, however, the warming effect of BrC on the negative DRF or DRE of OC would be a low-end value because our best model likely underestimates BrC concen-trations especially from the secondary source.
7 Effect on ozone photochemistry
BrC absorption, particularly at UV wavelengths, has an im-portant implication for ozone photochemistry. Here we ex-amine the effect of BrC absorption on photochemistry by up-dating photolysis rate calculations in GEOS-Chem following Martin et al. (2003). Table 4 shows the calculated extinction efficiency and SSA of important aerosols at 0.4 µm, which
affect UV extinction, and thus photolysis rate calculations, in the model. Values of OC, BC, and inorganic aerosols are from GEOS-Chem, in which we update aerosol optical prop-erties by adding those of BrC. We include optical propprop-erties of primary and secondary BrC separately because they differ substantially. For example, SSA values of primary BrC are smaller than those of secondary BrC, and thus have a greater impact on UV radiation. Compared with other aerosols, SSA values of BrC are generally lower than those of OC and inor-ganic aerosols, but higher than those of BC.
Martin et al. (2003) showed that the effects of aerosols on photolysis rates increased CO by 5–15 ppbv in the re-mote Northern Hemisphere (annual mean concentrations less than 140 ppbv). This increase resulted in an improved model agreement with observations, but there was a still gap be-tween the model and the observations. In our simulation with BrC, CO concentration is further increased by 0.2–1.9 ppbv in remote Northern Hemisphere regions (annual mean con-centrations less than 140 ppbv in the model). On the other hand, OH concentrations are decreased by 0–10 % in the boundary layer over the Northern Hemisphere (maximum decreases occur in regions with high BrC concentrations, shown in Fig. 6). The change of OH owing to BrC is about one-third of the OH change according to the overall aerosol effects from Martin et al. (2003). Therefore, the inclusion of BrC significantly affects tropospheric chemistry, especially for regions with heavy biomass burning and biofuel emis-sions.
Figure 9.Changes in annual NO2photolysis rate(a, b)and O3concentration(c, d)at the surface due to BrC absorption.
the resulting reduction of O3concentration is up to−2 ppbv (6 % of annual mean surface O3concentration). We also find that the BrC effect has a strong seasonal variation such that it is maximised in the spring when surface O3concentration is decreased up to−13 % in Asia because of high BrC concen-tration (55 µgC m−3). This maximum O
3 decrease by BrC (−13 %) is similar to the O3decrease (15 %) by fire aerosols in Jiang et al. (2012).
8 Conclusion
OC has been considered to be a scattering aerosol, but emerg-ing evidence has shown that some OC can efficiently absorb solar radiation. This absorbing OC is called BrC. With in-creasing recognition of its importance, especially for solar absorption at UV and short visible wavelengths, quantifica-tion of its spatial and temporal distribuquantifica-tion is much needed for the study of climate and air quality issues. Here we con-ducted an explicit global BrC simulation for the full year of 2007 using a global 3-D chemical transport model (GEOS-Chem), and examined its implication for climate and O3 pho-tochemistry.
We first estimated primary BrC emissions from biomass burning and biofuel use based on the relationship between AAE and MCE. Our estimates of primary BrC emissions are 3.9±1.7 and 3.0±1.3 TgC yr−1from biomass burning and biofuel use, respectively. The secondary BrC source is esti-mated to be 5.7 TgC yr−1from the aromatic oxidation.
With explicit BrC emissions, a coupled oxidant–aerosol simulation was conducted for 2007 to obtain the spatial and temporal distributions of BrC concentrations. We first evalu-ated the model by comparing the simulevalu-ated versus observed BrC absorption in the United States and found that the model successfully reproduced the observed seasonal variation of light absorption by WSOC in the southeastern United States, whereas the model significantly underestimated secondary BrC over the Los Angeles basin.
Our budget analysis showed that BrC from primary sources are dominant (77 %) in surface air, but BrC from sec-ondary sources becomes important with increasing altitudes. For example, BrC from secondary sources accounts for the 50 % of the tropospheric BrC burden, which is higher than its 23 % contribution to surface BrC concentrations. Our global mean value of the BrC to BC ratio is 1.83 for the whole atmo-sphere, and 1.24 for the surface, which significantly differs from the values used in previous studies.
Finally, we included BrC absorption in photolysis rate cal-culations in the model. We found that the NO2 photolysis rate is decreased up to 8 %, especially for Asia, where BrC concentration is high. Resulting annual surface O3 concen-trations are decreased up to −2 ppbv (6 %). This effect is more important in the spring, when a typical O3maximum occurs in Asia, where the effect of BrC decreases the surface O3concentration by up to−13 %.
Many chemical transport models and air quality models have included the effect of aerosols on photolysis rate
Appendix A
A1 Relationship between BrC/BC absorption ratio and AAE
In this section we describe a procedure for obtaining the re-lationship between the BrC/BC absorption ratio and AAE. Assuming no internal mixing and dust influence, total ab-sorption at a certain wavelength (λ)can be expressed as
αλ,CA=αλ,BrC+αλ,BC. (A1)
Rewriting Eq. (A1) using AAE,
αλ0,CA λ
λ0 −ÅCA
=αλ0,BrC λ
λ0 −ÅBrC
+αλ0,BC λ
λ0 −ÅBC
. (A2)
Dividing each side of Eq. (A2) byαλ0,BC:
(1+F ) λ
λ0 −ÅCA
=F λ
λ0 −ÅBrC
+ λ
λ0 −ÅBC
, (A3) whereF is the BrC/BC absorption ratio atλ0.
We can solve Eq. (A3) analytically, and the procedure is described in Appendix A2. We do not use the analyti-cal relationship because it uses only three wavelengths for the calculations. The Ångström relationship is based on em-pirical fitting. AAE varies in different wavelength regions, even if we use the same samples. For example, Chung et al. (2012) showed that CA AAE is about 1.2 when the first four wavelengths (370, 470, 520, 590 nm) are used, while the CA AAE is 1.35 with the last four wavelengths (590, 660, 880, 950 nm). This discrepancy is much increased in the case of BrC AAE. Liu et al. (2014) showed that BrC AAE varies by approximately 20 %, depending on wavelength pairs. Fur-thermore, if we calculate AAE of BrC using the MAE of Kirchstetter et al. (2004), AAE of BrC in all wavelengths (from 350 to 650 nm, 7 values) is fitted to 5.9 with aR2of 0.96. However, the AAE of BrC using just two wavelengths is 4.1 for the 350–440 nm and 8.0 for the 550–600 nm.
Therefore, we calculate the relationship between MCE and F by regression using multiple wavelengths: [300, 350, 400, 450, 500, 550, 600, 650, 700, 750, 800, 850, 900 nm]. If we rewrite Eq. (A3) for the regression form,
ÅCAlog(λ)+C=
−log
F λ
λ0 −ÅBrC
+ λ
λ0
−ÅBC
, (A4)
where the residual termCis
A2 Analytical derivation of Eq. (A3)
Here we describe the procedure to obtain the analytical rela-tionship between MCE andF. First, substitutingλ1andλ2 in Eq. (A3),
(1+F ) λ
1 λ0
−ÅCA
=F λ
1 λ0
−ÅBrC
+ λ
1 λ0
−ÅBC
, (A6)
(1+F ) λ
2 λ0
−ÅCA
=F λ
2 λ0
−ÅBrC
+ λ
2 λ0
−ÅBC
. (A7) Assuming AAE betweenλ0andλ1is equal to AAE between λ0andλ2, divide Eq. (A6) by Eq. (A7), and rearrange terms:
λ1 λ2
−ÅCA
= Fλλ1
0
−ÅBrC
+λλ1
0
−ÅBC
Fλλ2 0
−ÅBrC
+ λ
2 λ0
−ÅBC
. (A8)
Taking the logarithm of both sides: ÅCA=
−log
Fλλ1 0
−ÅBrC
+λλ1
0
−ÅBC
Fλλ2 0
−ÅBrC
+λλ2
0
−ÅBC
/log λ
1 λ2
. (A9)
Substituting Eq. (2) into Eq. (A9) gives MCE=
18.2+log
Fλλ1 0
−ÅBrC
+λλ1
0
−ÅBC
Fλλ2 0
−ÅBrC
+λλ2
0
−ÅBC
log λ
1
λ2 17.34. (A10)
The Supplement related to this article is available online at doi:10.5194/acp-16-3413-2016-supplement.
Acknowledgements. We thank anonymous reviewers for their
helpful comments on the manuscript. We thank the principal investigators and their staff for establishing and maintaining the AERONET sites used in this study. This study was supported by the Eco Innovation Program of KEITI (ARQ201204015) and by Korea Ministry of Environment as the “Climate Change Correspondence Program”.
Edited by: K. Tsigaridis
References
Aiken, A. C., DeCarlo, P. F., Kroll, J. H., Worsnop, D. R., Huff-man, J. A., Docherty, K. S., Ulbrich, I. M., Mohr, C., Kimmel, J. R., and Sueper, D.: O/C and OM/OC ratios of primary,
sec-ondary, and ambient organic aerosols with high-resolution time-of-flight aerosol mass spectrometry, Environ. Sci. Technol., 42, 4478–4485, 2008.
Akagi, S. K., Yokelson, R. J., Wiedinmyer, C., Alvarado, M. J., Reid, J. S., Karl, T., Crounse, J. D., and Wennberg, P. O.: Emis-sion factors for open and domestic biomass burning for use in atmospheric models, Atmos. Chem. Phys., 11, 4039–4072, doi:10.5194/acp-11-4039-2011, 2011.
Alexander, D. T. L., Crozier, P. A., and Anderson, J. R.: Brown carbon spheres in East Asian outflow and their optical properties, Science, 321, 833–836, doi:10.1126/science.1155296, 2008. Andreae, M. O. and Gelencsér, A.: Black carbon or brown
car-bon? The nature of light-absorbing carbonaceous aerosols, At-mos. Chem. Phys., 6, 3131–3148, doi:10.5194/acp-6-3131-2006, 2006.
Andreae, M. O. and Merlet, P.: Emission of trace gases and aerosols from biomass burning, Global Biogeochem. Cy., 15, 955–966, 2001.
Bahadur, R., Praveen, P. S., Xu, Y., and Ramanathan, V.: Solar ab-sorption by elemental and brown carbon determined from spec-tral observations, P. Natl. Acad. Sci., 109, 17366–17371, 2012. Bey, I., Jacob, D. J., Yantosca, R. M., and Logan, J. A.: Global
mod-eling of tropospheric chemistry with assimilated meteorology – Model description and evaluation, J. Geophys. Res., 106, 23073– 23095, 2001.
Bond, T. C. and Bergstrom, R. W.: Light absorption by carbona-ceous particles: An investigative review, Aerosol Sci. Tech., 40, 27–67, 2006.
Bond, T. C., Streets, D. G., Yarber, K. F., Nelson, S. M., Woo, J. H., and Klimont, Z.: A technology-based global inventory of black and organic carbon emissions from combustion, J. Geo-phys. Res., 109, D14203, doi:10.1029/2003JD003697, 2004. Bond, T. C., Habib, G., and Bergstrom, R. W.: Limitations in the
enhancement of visible light absorption due to mixing state, J. Geophys. Res, 111, D20211, doi:10.1029/2006JD007315, 2006. Bond, T. C., Bhardwaj, E., Dong, R., Jogani, R., Jung, S., Ro-den, C., Streets, D. G., and Trautmann, N. M.: Historical emis-sions of black and organic carbon aerosol from energy-related
combustion, 1850–2000, Global Biogeochem. Cy., 21, GB2018, doi:10.1029/2006GB002840, 2007.
Bond, T. C., Doherty, S. J., Fahey, D. W., Forster, P. M., Berntsen, T., DeAngelo, B. J., Flanner, M. G., Ghan, S., Kärcher, B., Koch, D., Kinne, S., Kondo, Y., Quinn, P. K., Sarofim, M. C., Schultz, M. G., Schulz, M., Venkataraman, C., Zhang, H., Zhang, S., Bellouin, N., Guttikunda, S. K., Hopke, P. K., Jacob-son, M. Z., Kaiser, J. W., Klimont, Z., Lohmann, U., Schwarz, J. P., Shindell, D., Storelvmo, T., Warren, S. G., and Zender, C. S.: Bounding the role of black carbon in the climate sys-tem: A scientific assessment, J. Geophys. Res., 118, 5380–5552, doi:10.1002/jgrd.50171, 2013.
Bones, D. L., Henricksen, D. K., Mang, S. A., Gonsior, M., Bate-man, A. P., Nguyen, T. B., Cooper, W. J., and Nizkorodov, S. A.: Appearance of strong absorbers and fluorophores in limonene-O3 secondary organic aerosol due to NH+
4-mediated chemical
aging over long time scales, J. Geophys. Res., 115, D05203, doi:10.1029/2009JD012864, 2010.
Chakrabarty, R. K., Moosmüller, H., Chen, L.-W. A., Lewis, K., Arnott, W. P., Mazzoleni, C., Dubey, M. K., Wold, C. E., Hao, W. M., and Kreidenweis, S. M.: Brown carbon in tar balls from smoldering biomass combustion, Atmos. Chem. Phys., 10, 6363– 6370, doi:10.5194/acp-10-6363-2010, 2010.
Chakrabarty, R. K., Pervez, S., Chow, J. C., Watson, J. G., Dewan-gan, S., Robles, J., and Tian, G.: Funeral pyres in South Asia: Brown carbon aerosol emissions and climate impacts, Environ. Sci. Tech. Lett., 1, 44–48, 2014.
Cheng, Y., He, K.-B., Zheng, M., Duan, F.-K., Du, Z.-Y., Ma, Y.-L., Tan, J.-H., Yang, F.-M., Liu, J.-M., Zhang, X.-Y.-L., Weber, R. J., Bergin, M. H., and Russell, A. G.: Mass absorption efficiency of elemental carbon and water-soluble organic carbon in Beijing, China, Atmos. Chem. Phys., 11, 11497–11510, doi:10.5194/acp-11-11497-2011, 2011.
Chin, M., Diehl, T., Dubovik, O., Eck, T. F., Holben, B. N., Sinyuk, A., and Streets, D. G.: Light absorption by pollution, dust, and biomass burning aerosols: a global model study and evaluation with AERONET measurements, Ann. Geophys., 27, 3439–3464, doi:10.5194/angeo-27-3439-2009, 2009.
Chung, C. E., Kim, S.-W., Lee, M., Yoon, S.-C., and Lee, S.: Carbonaceous aerosol AAE inferred from in-situ aerosol mea-surements at the Gosan ABC super site, and the implications for brown carbon aerosol, Atmos. Chem. Phys., 12, 6173–6184, doi:10.5194/acp-12-6173-2012, 2012.
Chung, S. and Seinfeld, J.: Global distribution and climate forc-ing of carbonaceous aerosols, J. Geophys. Res., 107, 4407, doi:10.1029/2001JD001397, 2002.
Clarke, A., McNaughton, C., Kapustin, V., Shinozuka, Y., How-ell, S., Dibb, J., Zhou, J., Anderson, B., Brekhovskikh, V., and Turner, H.: Biomass burning and pollution aerosol over North America: Organic components and their influence on spectral op-tical properties and humidification response, J. Geophys. Res., 112, D12S18, doi:10.1029/2006JD007777, 2007.
Cohen, J. B. and Wang, C.: Estimating global black carbon emis-sions using a top-down Kalman Filter approach, J. Geophys. Res.-Atmos., 119, 307–323, 2014.
Curci, G., Hogrefe, C., Bianconi, R., Im, U., Balzarini, A., Baró, R., Brunner, D., Forkel, R., Giordano, L., Hirtl, M., Honzak, L., Jiménez-Guerrero, P., Knote, C., Langer, M., Makar, P. A., Pirovano, G., Pérez, J. L., San José, R., Syrakov, D., Tuccella, P., Werhahn, J., Wolke, R., Žabkar, R., Zhang, J., and Galmarini, S.: Uncertainties of simulated aerosol optical properties induced by assumptions on aerosol physical and chemical properties: An AQMEII-2 perspective, Atmos. Environ., 115, 541–552, 2015. Diehl, T., Heil, A., Chin, M., Pan, X., Streets, D., Schultz, M.,
and Kinne, S.: Anthropogenic, biomass burning, and volcanic emissions of black carbon, organic carbon, and SO2from 1980
to 2010 for hindcast model experiments, Atmos. Chem. Phys. Discuss., 12, 24895–24954, doi:10.5194/acpd-12-24895-2012, 2012.
Favez, O., Alfaro, S. C., Sciare, J., Cachier, H., and Abdelwahab, M. M.: Ambient measurements of light-absorption by agricul-tural waste burning organic aerosols, J. Aerosol Sci., 40, 613– 620, 2009.
Feng, Y., Ramanathan, V., and Kotamarthi, V. R.: Brown carbon: a significant atmospheric absorber of solar radiation?, Atmos. Chem. Phys., 13, 8607–8621, doi:10.5194/acp-13-8607-2013, 2013.
Fernandes, S. D., Trautmann, N. M., Streets, D. G., Roden, C. A., and Bond, T. C.: Global biofuel use, 1850–2000, Global Bio-geochem. Cy., 21, GB2019, 2007.
Flores, J. M., Washenfelder, R., Adler, G., Lee, H., Segev, L., Laskin, J., Laskin, A., Nizkorodov, S., Brown, S., and Rudich, Y.: Complex refractive indices in the near-ultraviolet spectral re-gion of biogenic secondary organic aerosol aged with ammonia, Phys. Chem. Chem. Phys., 16, 10629–10642, 2014.
Forster, P. V., Ramaswamy, P., Artaxo, T., Berntsen, R., Betts, D. W., Fahey, J., Haywood, J., Lean, D. C., Lowe, G., Myhre, J., Nganga, R., Prinn, G., Raga, M. S., and Dorland, R. V.: Changes in Atmospheric Constituents and in Radiative Forcing., Cam-bridge University Press, United Kingdom and New York, NY, USA, 2007.
Goldstein, A. H. and Galbally, I. E.: Known and unexplored organic constituents in the earth’s atmosphere, Environ. Sci. Technol., 41, 1514–1521, 2007.
Graber, E. R. and Rudich, Y.: Atmospheric HULIS: How humic-like are they? A comprehensive and critical review, Atmos. Chem. Phys., 6, 729–753, doi:10.5194/acp-6-729-2006, 2006.
Granier, C., Bessagnet, B., Bond, T., D’Angiola, A., Denier van der Gon, H., Frost, G. J., Heil, A., Kaiser, J. W., Kinne, S., and Klimont, Z.: Evolution of anthropogenic and biomass burning emissions of air pollutants at global and regional scales during the 1980–2010 period, Climatic Change, 109, 163–190, 2011. Hawkins, L. N., Baril, M. J., Sedehi, N., Galloway, M. M., De Haan,
D. O., Schill, G. P., and Tolbert, M. A.: Formation of Semisolid, Oligomerized Aqueous SOA: Lab Simulations of Cloud Process-ing, Environ. Sci. Technol., 48, 2273–2280, 2014.
Heald, C. L., Ridley, D. A., Kroll, J. H., Barrett, S. R. H., Cady-Pereira, K. E., Alvarado, M. J., and Holmes, C. D.: Contrasting the direct radiative effect and direct radiative forcing of aerosols, Atmos. Chem. Phys., 14, 5513–5527, doi:10.5194/acp-14-5513-2014, 2014.
Hecobian, A., Zhang, X., Zheng, M., Frank, N., Edgerton, E. S., and Weber, R. J.: Water-Soluble Organic Aerosol material and the light-absorption characteristics of aqueous extracts measured
over the Southeastern United States, Atmos. Chem. Phys., 10, 5965–5977, doi:10.5194/acp-10-5965-2010, 2010.
Henze, D. K. and Seinfeld, J. H.: Global secondary organic aerosol from isoprene oxidation, Geophys. Res. Lett., 33, L09812, doi:10.1029/2006GL025976, 2006.
Henze, D. K., Seinfeld, J. H., Ng, N. L., Kroll, J. H., Fu, T.-M., Jacob, D. J., and Heald, C. L.: Global modeling of secondary organic aerosol formation from aromatic hydrocarbons: high-vs. low-yield pathways, Atmos. Chem. Phys., 8, 2405–2420, doi:10.5194/acp-8-2405-2008, 2008.
Hoffer, A., Gelencsér, A., Guyon, P., Kiss, G., Schmid, O., Frank, G. P., Artaxo, P., and Andreae, M. O.: Optical properties of humic-like substances (HULIS) in biomass-burning aerosols, At-mos. Chem. Phys., 6, 3563–3570, doi:10.5194/acp-6-3563-2006, 2006.
Huang, Y., Wu, S., Dubey, M. K., and French, N. H. F.: Impact of aging mechanism on model simulated carbonaceous aerosols, Atmos. Chem. Phys., 13, 6329–6343, doi:10.5194/acp-13-6329-2013, 2013.
Iacono, M. J., Delamere, J. S., Mlawer, E. J., Shephard, M. W., Clough, S. A., and Collins, W. D.: Radiative forcing by long-lived greenhouse gases: Calculations with the AER radiative transfer models, J. Geophys. Res., 113, D13103, doi:10.1029/2008JD009944, 2008.
Jacobson, M. Z.: Isolating nitrated and aromatic aerosols and ni-trated aromatic gases as sources of ultraviolet light absorption, J. Geophys. Res., 104, 3527–3542, 1999.
Jacobson, M. Z.: Global direct radiative forcing due to multicompo-nent anthropogenic and natural aerosols, J. Geophys. Res., 106, 1551–1568, 2001.
Jaoui, M., Edney, E. O., Kleindienst, T. E., Lewandowski, M., Offenberg, J. H., Surratt, J. D., and Seinfeld, J. H.: Formation of secondary organic aerosol from irradiated alpha-pinene/toluene/NOx mixtures and the effect of
iso-prene and sulfur dioxide, J. Geophys. Res., 113, D09303, doi:10.1029/2007JD009426, 2008.
Jiang, X., Wiedinmyer, C., and Carlton, A. G.: Aerosols from fires: An examination of the effects on ozone photochemistry in the Western United States, Environ. Sci. Technol., 46, 11878–11886, 2012.
Jo, D., Park, R., Kim, M., and Spracklen, D.: Effects of chemical aging on global secondary organic aerosol using the volatility basis set approach, Atmos. Environ., 81, 230–244, 2013. Kaufman, Y. J., Justice, C. O., Flynn, L. P., Kendall, J. D., Prins,
E. M., Giglio, L., Ward, D. E., Menzel, W. P., and Setzer, A. W.: Potential global fire monitoring from EOS-MODIS, J. Geophys. Res., 103, 32215–32238, 1998.
Kim, H. and Paulson, S. E.: Real refractive indices and volatility of secondary organic aerosol generated from photooxidation and ozonolysis of limonene,α-pinene and toluene, Atmos. Chem.
Phys., 13, 7711–7723, doi:10.5194/acp-13-7711-2013, 2013. Kirchstetter, T. W. and Thatcher, T. L.: Contribution of organic
car-bon to wood smoke particulate matter absorption of solar radia-tion, Atmos. Chem. Phys., 12, 6067–6072, doi:10.5194/acp-12-6067-2012, 2012.