AUTOMATIC BUILDING EXTRACTION USING LiDAR AND
AERIAL PHOTOGRAPHS
Extração automática de edificações usando LiDAR e fotografias aéreas
MELIS UZAR1 NACI YASTIKLI1
1
Yildiz Technical University Faculty of Civil Engineering Department of Geomatic Engineering
Davutpasa Campus, TR- 34220 Esenler-Istanbul, Turkey E-mail: (auzar, ynaci)@yildiz.edu.tr
ABSTRACT
This paper presents an automatic building extraction approach using LiDAR data and aerial photographs from a multi-sensor system positioned at the same platform. The automatic building extraction approach consists of segmentation, analysis and classification steps based on object-based image analysis. The chessboard, contrast split and multi-resolution segmentation methods were used in the segmentation step. The determined object primitives in segmentation, such as scale parameter, shape, completeness, brightness, and statistical parameters, were used to determine threshold values for classification in the analysis step. The rule-based classification was carried out with defined decision rules based on determined object primitives and fuzzy rules. In this study, hierarchical classification was preferred. First, the
vegetation and ground classes were generated; the building class was then extracted. The NDVI, slope and Hough images were generated and used to avoid confusing the building class with other classes. The intensity images generated from the LiDAR data and morphological operations were utilized to improve the accuracy of the building class. The proposed approach achieved an overall accuracy of approximately 93% for the target class in a suburban neighborhood, which was the study area. Moreover, completeness (96.73%) and correctness (95.02%) analyses were performed by comparing the automatically extracted buildings and reference data.
RESUMO
Este artigo apresenta uma abordagem para a extração automática de edificações usando dados LiDAR e fotografias aéreas de um sistema com múltiplos sensores posicionados na mesma plataforma. A abordagem de extração automática de edificações é composta por etapas de segmentação, análise e classificação, baseadas em análise de imagens com base em objetos. Na etapa de segmentação foram usados os métodos Chessboard, fatiamento do constraste e multirresolução. As primitivas de segmentação, como escala, forma, integridade, brilho e parâmetros estatísticos, foram usadas para determinar os valores-limite para a classificação na etapa de análise. A classificação baseada em regras foi realizada com regras de decisão definidos com base nas primitivas de determinado objeto e regras fuzzy. Neste estudo, preferiu-se a classificação hierárquica. Primeiramente, foram geradas as classes de vegetação e solo e então foi extraída a classe de edifícações. O NDVI, declividade, e as imagens Hough foram gerados e usados para evitar confundir a classe edificações com outras classes. As imagens de intensidade geradas a partir dos dados LiDAR e operações morfológicas foram utilizados para melhorar a precisão da classe de edifícações. A abordagem proposta alcançou uma exatidão de aproximadamente 93% para a classe alvo em um bairro suburbano, que era a área de estudo. Além disso, as análises de integralidade (96,73%) e correção (95,02%) foram realizadas através da comparação dos edifícios automaticamente extraídos e dados de referência.
Palavras-chave: LiDAR; Extração de Edificações; Hough; NDVI; Segmentação; Classificação.
1. INTRODUCTION
Healthy and sustainable urban development is an important factor in human life. Therefore, current spatial data are needed to improve urban management and quality of life. The acquisition of information regarding man-made objects in a fast and accurate manner plays an important role in making critical decisions for city planning and urban development. The automatic extraction of buildings is useful for many applications, such as project planning in various infrastructures, analyzing population mobility and tracking and preventing illegal housing in urban areas. Particularly in cities located in seismic belts, the regular tracking of buildings is critical for emergency disaster planning after earthquakes and for guiding rescue operations.
shadow and contrast features of aerial photographs directly affect the quality of object extraction. In the pixel-based classification method, which is the traditional approach, only the spectral value of the pixel is used. However, the success of this approach is limited to objects that have similar spectral information (GAO, 2003). This situation has a negative effect on the accuracy of the classification process. The extraction of objects such as buildings, roads and vegetation is a highly complex classification problem. In the object-based classification method, other parameters are used in addition to spectral information, such as textures, shapes and neighboring relationships regarding the object.
The most common problem encountered in building extraction in pixel-based and object-based classification is confusion of the building class with other classes. Different approaches and methods have been proposed to solve this problem. The Hough transform (HOUGH, 1962; TARSHA-KURDI et.al., 2007), slope analysis (ZEVENBERGEN and THORNE, 1987), and Normalized Difference Vegetation Index (NDVI) (ROTTENSTEINER et al. 2007; DEMIR et al., 2009; AWRANGJEB et al., 2010) are examples of such methods. In addition, different classification methods, such as ISO data classification (RICHARDS, 1999; HAALA and BRENNER, 1999), have been used to improve classification results for building extraction. A short summary of the recent state of the art in building extraction methods can be found in Yong and Huayi (2008), Matikainen (2009), Kabolizade et al. (2010), Blaschke (2010) and Pakzad et al. (2011).
Digital Surface Model (nDSM) with subtraction of the Digital Terrain Model (DTM) from the Digital Surface Model (DSM) to detect non-ground objects.
The data fusion method has certain advantages over the single method, but it also poses problems when the data are obtained at different times and resolutions. To resolve these problems, LiDAR point cloud and intensity data can be used along with aerial photographs obtained from LiDAR, GPS/IMU and a digital camera on the same platform for automatic building extraction.
Building extraction is not only a research topic but also a requirement in urban management, control and decision-making processes, which require accurate spatial and spectral data on buildings. Automatic building extraction methods should be fast, accurate, and easy to implement in a large study area for applications in urban areas. To solve the above-mentioned problems in automatic building extraction methods, we aimed to create new rule sets with our proposed approach for contributing to complex building extraction problems. In this research, an efficient
workflow is proposed for automatic building extraction with LiDAR data and aerial
images based on object-based image analysis with a multi-sensor system. Rule sets were developed for each target vegetation ground class and building using the proposed approach, and automatic building extraction was performed.
The organization of this paper is as follows. In section 2, the technical approach is explained in detail, including the workflow, segmentation and classification steps. In section 3, the properties of the study area, the data set obtained by the multi-sensor system and the results of the experiment are given. Finally, concluding remarks are given in Section 4.
2. METHODOLOGY
The proposed technique for automatic building extraction includes segmentation, analysis and classification steps using the data set from a multi-sensor system. To solve the misclassification problem, the object-oriented image analysis method was utilized for the extraction of building as well as vegetation and ground classes. The proposed method was performed using defined rules that were organized to improve the building class.
2.1 Overview
The object-oriented image analysis method used in this research has two major steps: segmentation and classification. The segmentation procedure starts with a one-pixel object and merges similar neighboring objects together. Then, the image is separated into its homogenous object clusters according to certain features, including scale parameter, shape, completeness, brightness, contrast difference, and statistical parameter values (BENZ et al., 2004; NAVULUR, 2007); the segments in different levels were performed using these features (DASH et al., 2004). In this research, the chessboard, contrast split and multi-resolution segmentation methods were utilized in the segmentation steps of the automatic extraction of building, vegetation and ground classes with the proposed approach.
The chessboard segmentation algorithm splits the image into square image objects, and each object is cut along these gridlines for more detailed analyses. The size of the square grid in a pixel defines the object size. The contrast split segmentation splits the images into dark and bright regions based on a threshold that maximizes the contrast between the resulting bright objects and dark objects. The optimal threshold is evaluated separately by an algorithm for each image object in the image object domain. The contrast split segmentation algorithm first executes chessboard segmentation and then performs the split for each square if the pixel level is selected in the image object domain (TRIMBLE DEFINIENS, 2010). The multi-resolution segmentation algorithm locally minimizes the average heterogeneity of image objects. The algorithm consecutively merges pixels or existing image objects and can be defined as a bottom-up segmentation algorithm based on a pairwise region merging technique. This segmentation method is an optimization procedure that minimizes the average heterogeneity and maximizes the respective homogeneity of the segments. The segmentation procedure begins with single-image objects of one pixel and repeatedly merges them as long as an upper threshold of homogeneity is not exceeded locally. This homogeneity criterion is defined as a combination of both spectral and shape homogeneity, which are influenced by the scale parameter. Higher scale parameter values result in larger image objects and smaller values in smaller image objects. Image layers can be weighted to determine their importance or suitability for the segmentation result. The compactness criterion is used to optimize the compactness of image objects (TRIMBLE DEFINIENS, 2010; BEGER et al., 2011). The different image layers, such as the Hough and intensity layers, can be included with multi-resolution segmentation, which we adopted in our approach to improve the segmentation quality and more accurately represent the newly created image object. Detailed information about the used parameter for different segmentation methods is given in the following section for vegetation, ground classes and buildings using the proposed approach.
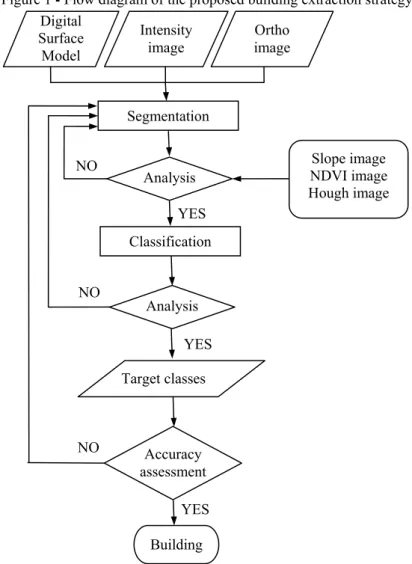
the object primitives were used to distinguish objects into different types by classification. The segmentation, analysis and classification steps of the proposed object-oriented image analysis method included subsequent steps allowing the refinement or improvement of the segmentation locally for a specific class, such as building, ground or vegetation. Thus, the entire proposed building extraction strategy, as shown in Figure 1, alternates iteratively between local segmentation modifications on the one hand and local object analysis and classification on the other hand
Figure 1 - Flow diagram of the proposed building extraction strategy.
YES Analysis
Accuracy assessment Segmentation
Building Classification
Ortho image Intensity
image Digital
Surface Model
Slope image NDVI image Hough image NO
Analysis NO
Target classes
YES YES
The rule-based classification was carried out because it offers the possibility to automate the entire classification process with decision rules based on determined object primitives combined with fuzzy logic operators at different levels of analysis. The fuzzy rules (membership functions) were defined to include information about the overall reliability, stability and class combination of all of the potential classes. In fuzzy classification, a complete fuzzy system was defined, including the
fuzzification of object primitives that will form fuzzy sets, fuzzy logic combinations
of these fuzzy sets for defining a class, and defuzzification of the fuzzy classification
results to obtain the common crisp classification for thematic classification (BENZ
et al., 2004). The entire object-oriented image analysis for automatic building extraction was performed in Definiens eCognition Developer 8.64 with defined rule
sets.
2.1 Generation of classes
The hierarchical classification method was developed for the proposed
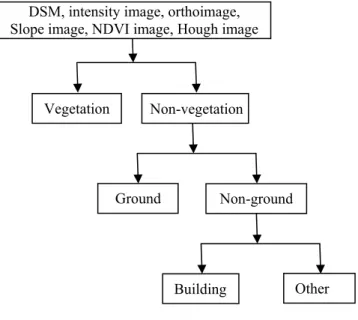
automatic building extraction. Instead of focusing on building extraction at an early stage of the classification steps, a classification of the data in the following vegetation, ground and building classes was first performed. Building regions were then derived from the classification results. Figure 2 shows the applied hierarchical classification scheme for automatic building extraction.
Figure 2 - Hierarchical classification scheme for automatic building extraction.
DSM, intensity image, orthoimage, Slope image, NDVI image, Hough image
Non-vegetation Vegetation
Building
Ground Non-ground
The Normalized Difference Vegetation Index (NDVI) was employed to classify vegetation and is computed as follows:
NDVI = (NIR – Red)/(NIR + Red) (1)
Before classification, the contrast split segmentation was performed with determined NDVI threshold values after histogram analyses of the NDVI image for vegetation extraction. The classification was performed with defined fuzzy rules, and the results were improved with morphological operations such as opening and closing to represent the vegetation class accurately.
The ground and non-ground classes were differentiated using the DSM of the study area, which contained the height information of the buildings and other objects elevated from the bare ground. The generated slope image using the DSM (ZEVENBERGEN and THORNE 1987; ROTTENSTEINER et al., 2005a; BEGER et.al., 2011) was used to identify these objects. Object contours having the same slope value in the slope image were used in contrast to split segmentation, and the non-ground class was obtained with fuzzy classification using the determined threshold values. Because the first and last returns of the LiDAR pulse were unavailable, quantile statistical analyses of the DSM were performed. Then, the ground class was generated using the threshold value from quantile statistical analysis.
The proposed technique for building class extraction has five major steps. First, an nDSM was created to exclude the influence of topography using the difference between the DSM of the non-ground class and the average point heights in the ground class. Before nDSM generation, ground and vegetation masks were generated using classification results and DSM. The ground mask and vegetation mask were extracted from the DSM, and then the DSM of the non-ground class was generated. Second, objects in the nDSM with heights above 1 m were classified as initial building 1. Third, the multi-resolution segmentation was performed using the initial building 1 class, the orthoimage and the generated Hough image (HOUGH, 1962). The parameters of scale, shape, compactness, smoothness and color were taken into consideration in multi-resolution segmentation. The initial building 2 and non-building class were generated as a result of the classification with a determined threshold value for the building and non-building classes. Fourth, the contrast split segmentation was utilized using the intensity image generated from the LiDAR data, and the initial building 3 class was generated as a result of the classification with the determined building intensity threshold. Finally, the building class was acquired after morphological operations (opening and closing), and the non-building class was renamed as the other class.
2.3 Accuracy assessment
building extraction approach. The Error Matrix method is a preferred method for statistical analyses because it provides not only the overall accuracy but also the opportunity to evaluate the producer accuracy, user accuracy and Kappa analysis results (CONGALTON and GREEN, 2009). The second approach used in the accuracy assessment was completeness and correctness analyses. The main approach in this method is as follows (ROTTENSTEINER et al., 2007):
Completeness = (TP)⁄(TP+FN) (2)
Correctness = (TP)⁄(TP+FP) (3)
In this formula, TP represents true positives, and FP and FN are the false positives and false negatives, respectively. In this method, TP is the number of true positive entities classified as buildings in both data sets (a result of the automatic classification and reference data set), FN is the number of false negative entities identified as buildings in the reference data that were not classified in the automatic classification, and FP is the number of false positive entities that were classified as buildings in the automatic classification but were not classified as buildings in the reference data (RUTZINGER et al., 2009).
3. EXPERIMENT AND RESULTS
3. 1. Study area and data
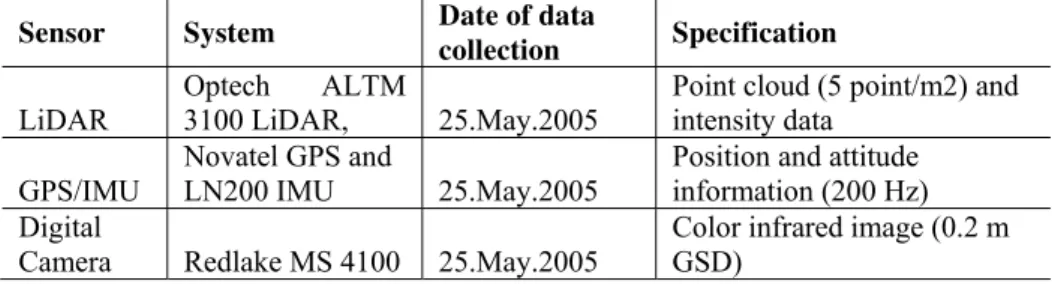
The study area, used for testing the proposed approach for automatic building extraction, is a suburban neighborhood located in the northwest of the city of San Bernardino, California, United States of America. The data set from a project named “B4”, conducted through the cooperation of Ohio State University and the U.S. Geological Survey, was used (CSANYI and TOTH 2006; TOTH et al., 2007). The data set was obtained simultaneously with the multi-sensor system, which included LiDAR, GPS/IMU and a digital camera (color infrared) positioned at the same platform. Detailed information about the multi-sensor system and collected data are given in Table 1.
Table 1 - Multi-sensor system and data specifications.
Sensor System Date of data
collection Specification
LiDAR
Optech ALTM
3100 LiDAR, 25.May.2005
Point cloud (5 point/m2) and intensity data
GPS/IMU
Novatel GPS and
LN200 IMU 25.May.2005
Position and attitude information (200 Hz) Digital
Camera Redlake MS 4100 25.May.2005
The study area was chosen because the data set was collected simultaneously with the multi-sensor system onboard the same airplane and contained different types of land cover within a small area, including buildings, roads, vegetation, shadows, trees, grass and one of America’s largest amphitheaters (the Hyundai Pavilion in Glen Helen), with a capacity of more than 65,000 people. The relatively small size of the study area allowed reference digitizing for an accuracy assessment of the extracted objects.
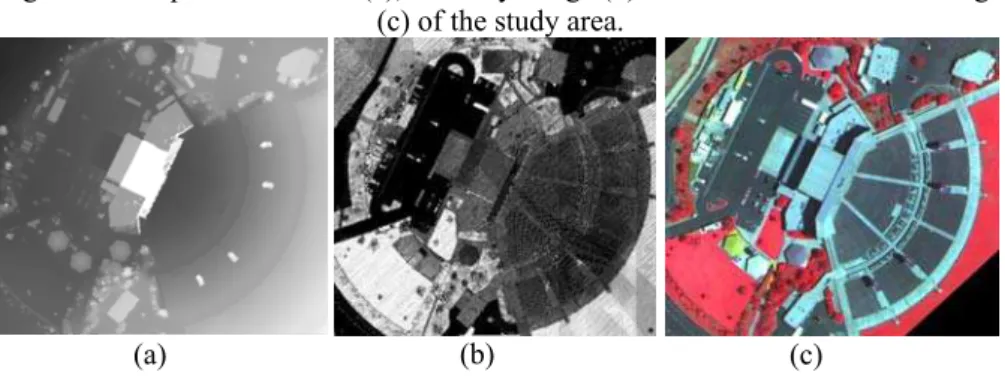
A gridded DSM with a 0.2-m-resolution intensity image with a ground sampling distance (GSD) of 0.2 m and an orthoimage with a GSD of 0.2 m was produced using the data set from the multi-sensor system (Figure 3). The NDVI image was generated using the NDVI method described in Section 2.1. A slope image with slope analyses of the DSM and Hough image with the Hough transformation of the orthoimage was generated.
Figure 3- The produced DSM (a), intensity image (b) and color infrared orthoimage (c) of the study area.
3. 2. Results
The first step of the proposed automatic building extraction approach is segmentation, which can be seen in Figure 1. Because we proposed the hierarchical classification method in the classification step, different segmentation methods were
utilized for each target class. The contrast split segmentation was performed using the NDVI image to generate the vegetation class as a first step of the hierarchical classification scheme for automatic building extraction (Figure 2). Contrast split segmentation was applied to generate the ground class using the slope image generated with the DSM of the study area (ZEVENBERGEN and THORNE, 1987). The multi-resolution segmentation was carried out for the automatic extraction of buildings using the orthoimage, the Hough image and the other classes generated from the previous step of the hierarchical classification method. Figure 4 shows the
generated NDVI, slope and Hough images of the study area that were used in the segmentation steps. The contrast split segmentation was repeated again with the intensity image (Figure 3b) to improve the building class.
Figure 4 - The NDVI image (a), slope image (b) and Hough image (c) of the study area.
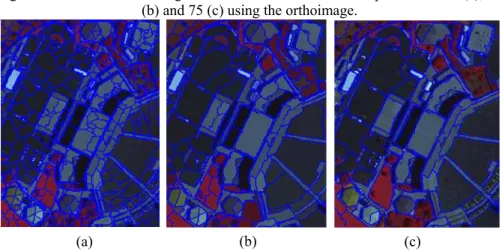
The segmentation step is the first and most important step of the proposed automatic building extraction based on the object-oriented image analysis technique. The determined object primitives in segmentation were used to distinguish objects into different types by classification. Therefore, analyses of the parameter used in segmentation are of vital importance to the success of the proposed building extraction strategy. The scale parameter used in segmentation defines the maximum segment or object size. To determine the most appropriate scale parameter for multi-resolution segmentation, the parameters for shape and compactness were both set to 0.5, and then segmentation was performed for scale parameters 25, 50 and 75, respectively. Figure 5 shows the results of the multi-resolution segmentation using the orthoimage of the study area with scale factors of 25, 50 and 75.
Figure 5 - Multi-resolution segmentation results with the scale parameters 25 (a), 50 (b) and 75 (c) using the orthoimage.
As expected, the scale parameter of 75 produced the maximum segment size and fewer objects in multi-resolution segmentation. Therefore, we preferred the
(a) (b) (c)
scale parameter of 25 for multi-resolution segmentation to include the maximum number of objects in classification steps for the rest of the segmentation process. A similar analysis was performed for shape and compactness. As a result of these analyses, the scale, shape and compactness parameters were set to 25, 0.4 and 0.6, respectively, for multi-resolution segmentation. Similar analyses were conducted for the other segmentation methods to create the most appropriate segments before classification.
The analysis steps were continued before classification to determine the threshold value for classification in our proposed approach. The classification was performed with the fuzzy rules (membership functions) for different classes. As mentioned in the previous section, the proposed approach in this study is based on hierarchical classification (Figure 2). First, the vegetation and ground classes were
generated, and then the building class was obtained. The determined parameters for the segmentation and threshold values for classification were refined iteratively until the target class was obtained correctly.
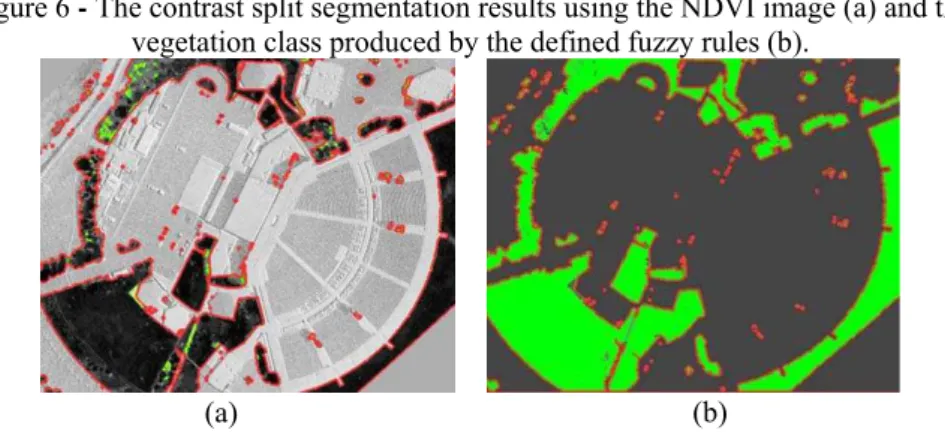
A histogram analysis of the NDVI image (Figure 4a) was utilized to determine a threshold value for the vegetation and non-vegetation classes. In the classification steps, the thresholds were defined as NDVI values less than or equal to 0.55 and greater than or equal to 0.35. The vegetation class was generated using the fuzzy rules with defined threshold values and morphological operations. The result of the contrast split segmentation on the NDVI image and fuzzy classification for the generation of the vegetation class is given in Figure 6.
Figure 6 - The contrast split segmentation results using the NDVI image (a) and the vegetation class produced by the defined fuzzy rules (b).
Contrast split segmentation was utilized using the slope image to identify elevated objects from bare ground (Figure 7a). The thresholds were defined as a slope value less than or equal to 200 and greater than or equal to 120. The ground and non-ground classes were extracted using fuzzy classification with the threshold value from the slope value (slope value less than or equal to 90) and the quantile statistical analysis (height in the DSM less than the quantile threshold).
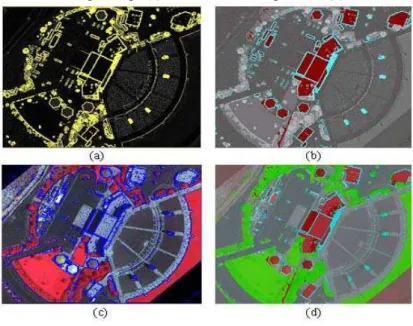
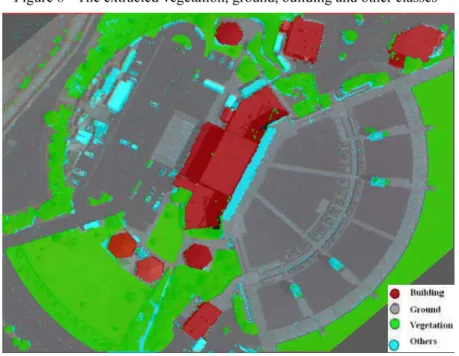
Building class generation was performed at the end of the five major steps, as mentioned in previous section. To avoid confusing the building class with the other classes, three initial building classes were generated. The initial building class 1 was created with a defined threshold value greater than 1 m with fuzzy classification using the generated nDSM (Figure 7b). Then, multi-resolution segmentation was performed using orthoimage and the Hough image. Different weights were applied in multi-resolution segmentation. To improve building edge detection, the orthoimage was weighted as 0.3, but the Hough image was weighted as 1 (Figure 7c). The initial building class 2 was created using the result of the multi-resolution segmentation and building class 1 (Figure 7d). To eliminate non-building objects classified as buildings, contrast split segmentation was utilized using the intensity image. Then, initial building class 3 was generated as a result of the classification with the determined building intensity threshold value. The thresholds for building intensity were defined as an intensity value less than or equal to 127 and greater than or equal to 44. Man-made objects in the study area that were not buildings (e.g., removable containers and security shelters in small lots) were eliminated with defined rules such as the area threshold value and were classified as ‘other’. The final building class was obtained after improvements with morphological operations such as opening and closing. Figure 8 shows the extracted vegetation, ground, building and other classes performed by defined rules with the proposed approach.
Figure 7 - The results of the contrast split segmentation using slope images (a), initial building class 1 (b), multi-resolution segmentation using an orthoimage and a
Figure 8 - The extracted vegetation, ground, building and other classes
3. 3. Performance evaluation
The performance evaluation of the proposed building extraction strategy based on object-oriented image analysis techniques was carried out using two different methods.
The “Error Matrix based on a TTA (training or test area) Mask” method was used first. In this method, the overall accuracy, producer accuracy, user accuracy and Kappa analysis results were computed by comparing the reference segments from each class and the results of the automatic extracted class with the proposed approach. The obtained performance evaluation results with the Error Matrix based on a TTA Mask are given in Table 2. As seen, an overall accuracy of 93% and a Kappa value of 88% were obtained as a result of the performance evaluation.
Table 2 - Accuracy assessment of the classification results using LiDAR data and aerial photographs.
Error Matrix based on the TTA (Training or Test Areas) Mask User/
Reference Building Vegetation Ground Other Total
Building 82046 80 452 0 82578
Vegetation 1164 249836 4648 447 256095
Ground 2262 31212 388152 4189 425815
Other 408 6915 5631 16210 29164
Unclassified 549 0 30 0 579
Total 86429 288043 398913 20846
Accuracy %
Producer 95 87 97 78
User 99 98 91 56 KIA 94 80 94 77
Overall classification accuracy = 0.93 Kappa coefficient = 0.88
4. CONCLUSIONS
This paper presented an efficient workflow for automatic building extraction
using LiDAR data and aerial photographs. The proposed method in this study, based on object-based image analysis, includes segmentation, analysis and classification steps using the data set from a multi-sensor system positioned at the same platform. The chessboard, contrast split and multi-resolution segmentation methods were utilized in segmentation steps of the automatic extraction of building, vegetation and ground classes with the proposed approach. Rule-based classification was carried out because it offers the ability to automate entire classification processes with defined decision rules based on determined object primitives and fuzzy rules (membership functions). To avoid confusing the building class with other classes, the NDVI, slope and Hough images were generated using the data set from a multi-sensor system and were used for segmentation analysis and classification steps in the proposed method. The intensity image generated from the LiDAR data and morphological operations (opening and closing) was used to improve the accuracy of the building class.
over the relatively small size of a suburban neighborhood as a study area, modifications can easily be made for dense urban areas. The proposed automatic building extraction method can be applied for urban development, tracking and prevention of illegal housing, emergency disaster planning after earthquakes and the guidance of rescue operations.
ACKNOWLEDGEMENTS
The authors would like to thank Charles Toth and Dorota Grejner Brzezinska from Ohio State University for providing the data sets.
REFERENCES
AWRANGJEB, M.; RAVANBAKHSH, M.; FRASER, C. Automatic detection of residential buildings using LIDAR data and multispectral imagery. ISPRS Journal of Photogrammetry and Remote Sensing, 65, 457-467, 2010
BEGER, R.; GEDRANGE, C.; HECHT. R.; NEUBERT, M. Data fusion of extremely high resolution aerial imagery and LiDAR data for automated railroad centre line reconstruction. ISPRS Journal of Photogrammetry and Remote Sensing 66, 40–51, 2011
BENZ, U.C., HOFMANN, P., WILLHAUCK, G., LINGENFELDER, I., HEYNEN, M., Multiresolution, object-oriented fuzzy analysis of remote sensing data for GIS- ready information. ISPRS Journal of Photogrammetry and Remote Sensing 58 (3), 239–258, 2004.
BLASCHKE, T. Object Based Image Analysis for Remote Sensing. ISPRS Journal of Photogrammetry & Remote Sensing, 65, 2–16, 2010
CONGALTON, R. G.; GREEN K. Assessing the Accuracy of Remotely Sensed Data: Principles and Practices. CRC Press, Taylor & Francis Group, Boca Raton, Florida, 183pp, 2009.
CSANYI, N.; TOTH, C. Improvement of LiDAR data accuracy using LiDAR specific ground targets. Photogrammetric Engineering & Remote Sensing, 73 (5), 385-396, 2006.
DASH, J.; STEINLE, E.; SINGH, R. P.; BÄHR, H. P. Automatic building extraction from laser scanning data: An input tool for disaster management.
Advances in Space Research, 33, 317-322, 2004.
DEMIR, N.; POLI, D.; BALTSAVIAS, E. Detection of buildings at airport sites using images & lidar data and a combination of various methods. IAPRS, Paris, France, p. 71-77, 2009.
EL-ASHMAWY, N.; SHAKER, A.; YAN, W. Pixel vs object-based image classification techniques for LiDAR intensity data. ISPRS Workshop Laser Scanning 2011, Eds: D.D. Lichti and A.F. Habib, International Archives of Photogrammetry, Remote Sensing and Spatial Information Sciences Volume
XXXVIII-5/W12, Full waveform and radiometric modeling, 2011.
Thesis, University of Twente, Faculty of Geo-Information and Earth Observation ITC, Enscheda, The Netherlands, 2010.
ELBERINK, O; VOSSELMAN, G. Quality analysis on 3D building models reconstructed from airborne laser scanning data. ISPRS Journal of Photogrammetry and Remote Sensing, 66, 157–165, 2011
GAO, Y. Pixel based and object oriented image analysis for coal fire research. MSc. Thesis. ITC,The Netherlands, 2003.
HAALA, N.; BRENNER, C. Extraction of buildings and trees in urban environments. ISPRS Journal of Photogrammetry and Remote Sensing, 54, 130-137, 1999.
HOUGH, P. Methods and means for recognizing complex patterns. U.S. Patent, 3,069,654, 1962.
KABOLIZADE, M.; EBADI, H.; AHMADI, S. An improved snake model for automatic extraction of buildings from urban aerial images and lidar data.
Computers, Environment and Urban Systems, 34, 435-441, 2010.
KHOSHELHAMA, K.; NARDINOCCHI, C.; FRONTONI, E.; MANCINI, A.; ZINGARETTI, P. Performance evaluation of automated approaches to building detection in multi-source aerial data. ISPRS Journal of Photogrammetry and Remote Sensing, 65, 123-133, 2010.
MAAS, H.; VOSSELMAN G. Two algorithms for extracting building models from raw laser altimetry data. ISPRS J. Photogrammetry Remote Sensing, 54, 153-163, 1999.
MAO, J.; LIU, X.; ZENG, Q. Building Extraction by Fusion of LIDAR Data and Aerial Images. IEEE 2009 Urban Remote Sensing Joint Event, 969-974, 2009. MATIKAINEN, L.; HYYPPÄ, J.; AHOKAS, E; MARKELIN, L.; KAARTINEN.
H.; An improved approach for automatic detection of changes in buildings.
Proceedings of the ISPRS Workshop Laser scanning 2009, Eds: F. Bretar, M. Pierrot-Deseiligny, G. Vosselman, September 1-2, Paris, France, International Archives of Photogrammetry, Remote Sensing and Spatial Information Sciences Vol. XXXVIII (3/W8), 61-67, 2009.
NAVULUR, K. Multispectral image analysis using the object-oriented paradigm, CRC Press, Taylor & Francis Group, Boca Raton, 205pp, 2007.
PAKZAD, K.; KLINK, A.; MÜTERTHIES, A.; GRÖGER, G.; STROH, V.; PLÜMER, L. Hybrid automatic building interpretation system. ISPRS Hannover Workshop, High-Resolution Earth Imaging for Geospatial Information, Commission III, WG III/4, 2011.
RICHARDS, J.A. Remote sensing and digital image analysis. Springer, Verlag, Berlin, p. 240, 1999
ROTTENSTEINER, F.; CLODE, S. Building and road extraction by LiDAR and imagery. Topographic Laser Ranging and Scanning Principles and Processing. Taylor &Francis Group, p. 445-478, 2009
building detection. Proceedings of the ISPRS Workshop CMRT 2005: Object Extraction for 3D City Models, Road Databases and Traffic Monitoring Concepts, Algorithms and Evaluation. Vienna, Austria, p. 15-20, 2005a.
ROTTENSTEINER, F.; TRINDER, J.; CLODE, S.; KUBIK, K. Building detection by fusion of airborne laser scanner data and multi spectral images: performance evaluation and sensitivity analysis. ISPRS Journal of Photogrammetry and Remote Sensing, 135-149, 2007.
ROTTENSTEINER, F.; TRINDER, J.; CLODE, S.; KUBIK, K. Using the Dempster-Shafer method for the fusion of LiDAR data and multi-spectral images for building detection. Information Fusion, 6 (4), 283-300, 2005b.
RUTZINGER, M.; ROTTENSTEINER, F.; PFEIFER, N. A comparison of evaluation techniques for building extraction from airborne laser scanning. IEEE Journal of Selected Topics in Applied Earth Observations and Remote Sensing, 1, 11-20, 2009.
SAMPATH, A.; SHAN J. Segmentation and Reconstruction of Polyhedral Building Roofs From Aerial Lidar Point Clouds. IEEE Transactions on Geoscience and Remote Sensing, 48(3),1554-1567, 2010
SITHOLE, G. Segmentation and classification of airborne laser scanner data. Ph.D. Thesis. University of Delft, Publications on Geodesy, The Netherlands, 2005. TARSHA-KURDI, F.; LANDES, T.; GRUSSENMEYER, P. Hough transform and
extended Ransac algorithms for automatic detection of 3D building roof planes from lidar data. ISPRS, 36, 407-412, 2007.
TOTH, C.; BRZEZİNSKA, D., CSANYI, N., PASKA, E., YASTIKLI, N. LiDAR Mapping Supporting Earthquake Research of The San Andreas Fault. ASPRS 2007 Annual Conference Tampa, Florida May 7-11, 2007
TRIMBLE Definiens, A.G. (Ed.), 2010. E-Cognition 8.64 Reference Book. Trimble, Munich.
VOSSELMAN, G. Slope Based Filtering of Laser Altimetry Data, IAPRS, Vol. XXXIII, Part B3, Amsterdam, The Netherlands, 935-942, 2000.
VOSSELMAN, G.; SESTER, M.; MAYER, H. Basic computer vision techniques. Manual of Photogrammetry. In: Manual of photogrammetry ed. by J.C. McClone, E.M. Mikhail, J.S. Bethel. Fifth edition. Bethesda: American Society for Photogrammetry and Remote Sensing (ASPRS), p. 455-504, 2004.
YONG. L.; HUAYI, W. Adaptive building edge detection by combining LiDAR data and aerial images. In: The International Archives of the Photogrammetry, Remote Sensing and Spatial Information Sciences. Vol. XXXVII. Part B1, p.197-202,. Beijing, 2008.
ZENG. Q, Data filtering and feature extraction of urban typical objects from airborne lidar point cloud. In: The International Archives of the Photogrammetry, Remote Sensing and Spatial Information Sciences. Vol. XXXVII. Part B3b. Beijing, p. 153-156, 2008.
ZHANG K.; CHEN S.; WHITMAN D. A progressive morphological filter for removing nonground measurements from airborne LIDAR data. IEEE Transaction on Geoscience and Remote Sensing, 41, (4), 872-882, 2003.