Bol. Ciênc. Geod., sec. Artigos, Curitiba, v. 19, no 2, p.172-190, abr-jun, 2013.
DESIGN AND IMPLEMENTATION OF A WEB
INTERACTIVE THEMATIC CARTOGRAPHY METHOD
BASED ON A WEB SERVICE CHAIN
Projeto e implementação de mapas temáticos interativos para Web baseado em uma cadeia de WEB service
XINGGUO ZENG1 QINGYUN DU1
FU REN1 FEI ZHAO2
1
School of Resource and Environmental Science, Wuhan University,
Luoyu Road 129, Wuhan 430079, China
e-mail: [email protected]; [email protected]; [email protected]; 2
National Geospatial Information Center, Lianhuachi West Road 28, Beijing 100830, China
e-mail: [email protected]; [email protected] Tel: +86-27-87664557; Fax: +86-27-87664557
ABSTRACT
RESUMO
Há uma tendência em direção à criação dos mapas temáticos na Web. Entretanto, a geração automática de mapas e a geração de web maps interativos são dois desafios associados com este campo de pesquisa. Para resolver estes problemas, apresenta-se mapas tematicos na web criados por uma cadeia de serviços. A cartografia automatizada é realizada por meio de um serviços cartoraficos baseados em conhecimento, que interagem com os serviços quando possivel. O método foi implementado na construção de um atlas urbano de Shenzhen - China, dedicado a dar suporte à tomada de decisão para o planejamento urbano participação popular na geração de mapas temáticos na Web.
Palavras-Chave: Cartografia Temática na WEB; Dados Espaciais; Cadeia de Serviço WEB; Arquitetura Orientada a Serviços.
1. INTRODUCTION
Thematic maps are used to represent spatial thematic information. With thematic maps, the spatial distribution of thematic information is intuitive; thus, such maps can provide assistance in visual thinking to the map user and are widely used in many research areas to facilitate decision making. However, creating thematic maps on a desktop is time consuming, and the map is not widely disseminated; thus, it is very difficult for the user to access the map. With the development of Web 2.0 technology, it is possible to create thematic maps on the web; thus, users in distributed environments will have greater access to maps to facilitate their research or daily work. The research of some experts in related fields has mainly focused on spatial thematic data visualization and web thematic cartography methods.
Some representative findings from the existing literature on spatial thematic data visualization are available. In interactive visualization, when designing visualization methods, according to Bertin’s theory of symbolization, which includes six visual variables – shape, size, density, color, brightness, and orientation (BERTIN, 1967) – several visual variables, such as shape, size, and color, can be transformed into unique parameters such that the symbol can be interactively manipulated by changing the visual parameters. Experts have also shown interest in the basic rules of intelligent spatial thematic data visualization, which has been investigated by Andrienko (1999a, 1999b and 2002), Dykes (1995, 1997a, 1997b and 2005), Mackinlay (1986), Roth and Mattis (1990), Zhan and Buttenfield (1995), Dobesova and Brus (2011), and Zhang et al. (2008), according to whom these rules can be summarized into data that are based on characteristics, user goals, and visualization knowledge. Their research has laid the foundation for automated thematic data visualization.
Design and implementation of a WEB interactive thematic cartography...
Bol. Ciênc. Geod., sec. Artigos, Curitiba, v. 19, no 2, p.172-190, abr-jun, 2013.
1 7 4
Web Map Service (WMS); Jung and Shih (2005) introduced a web mapping method by operating the Geolinked Data Access Service (GDAS), Geolinking Service (GLS), and WMS, which are provided by the OpenGIS standards. In addition, Rex (2005) discussed preliminary web mapping services composed of a base map service and thematic data service, and Jern (2007) discussed numerous interactive web mapping and graphics visualization techniques, such as dynamic linking and highlighting, and also provided an interesting storytelling mechanism to enrich the information provided by web maps. Recently, Rautenbach et al. ( 2012) introduced a method by orchestrating OGC web services to produce a thematic map. MacEachren (1994) and MacEachren and Kraak (1997) probed into and further elaborated on the paradigm of web cartography, which includes three key elements: private map use (an individual generates a map for his or her own needs), direction toward revealing unknowns rather than presenting known facts, and high human-map interaction (HARDISTY and ANTHONY, 2011).
The above-mentioned research work contributes mainly to automated data visualization, interactive map manipulation, and web mapping services. Developments in this field have been focused on web service-based thematic cartography. However, there are still limitations in the available research. First, there is a concept framework of a “Thematic Map Service” (REX, 2005), which is designed to represent the visualization of spatial thematic data, but the content of the web service is not clearly designed and achievement of the web service is not mentioned. Second, it is possible to create thematic maps with some existing standard OGC services (RAUTENBACH et al., 2012); however, a large number of customized programming schemes must be standardized by wrapping Web Processing Service (WPS) services, and the Styled Layer Descriptor (SLD), which is used to vary map styles, is not open to the user. Thus, such programming capabilities provide very limited functionality for the interactive manipulation and interoperability of thematic maps. To solve these problems, a thematic cartographic method based on a web thematic mapping service chain (WTMSC) was designed that utilizes powerful development web service chain technology. In the next section, the technological and cartographic knowledge base will be discussed, and then, a detailed presentation of the method is provided.
2. METHOD OF WEB SERVICE CHAIN-BASED THEMATIC CARTOGRAPHY
2.1 SOA and Web Service Chain
simple object access protocol (SOAP). WSDL is used to describe the interface, and SOAP allows messages to be sent and received by extended mark-up language (XML) format data files between web services (ZENG et al., 2011). In the GIS community, the OGC has defined several geospatial web services, such as web map services (WMS), web feature services (WFS), and web coverage services (WCS), many of which have become the web service specification in the GIS community (PERCIVALL, 2002). Web service-based GIS is currently very popular in the development of GIS systems (because a web thematic mapping program is a type of WebGIS system). A web service-based GIS typically has a well-defined input and output, which enable operational capabilities, and users do not have to utilize complex data structures and data processing in the web service. In such a system, users can access the GIS functionality freely to their demand, even under distributed circumstances. In some situations, there are many complex applications and a joint effort of several web services is needed to accomplish a task; the composition of web services that form a workflow chain is called a web service chain, or an extended use of web services. The web services in a chain must abide by some general rules. For example, the output of a former web service is supposed to share the same structure as the input of a latter web service (YUE et al., 2007) because once incompatible situations occur, the execution of the chain will be terminated and exceptions should be thrown out. In our approach, a web service chain called a WTMSC is constructed to visualize spatial thematic data.
2.2 Elements of Web Thematic Maps
Design and implementation of a WEB interactive thematic cartography...
Bol. Ciênc. Geod., sec. Artigos, Curitiba, v. 19, no 2, p.172-190, abr-jun, 2013.
1 7 6
2.3 Knowledge Base for Automated Thematic Data Visualization
In this approach, user preferences and the relationship between thematic data characteristics and visualization will be integrated into the knowledge base that is utilized in automatic thematic data visualization. The details are described below.
2.3.1 User preference
User preferences are considered in the interactive visualization of spatial thematic data. In this approach, the following factors related to the user preference are investigated:
• User knowledge background: The user knowledge background refers to the user’s professional knowledge. Because the user may be an expert in cartography, may have certain knowledge in urban planning, or may be simply a layman customer, the user is categorized as either an expert user, domain user, or public user. For the experts, some complex analysis visualization methods are provided. For the domain user, the visualization methods that are related to their domain are provided. For the public user without any foundational understanding, fundamental visualization methods are provided.
• Skilled with computer systems: Because this program is a web-based GIS system, the user’s level of skill with the system is important. For a computer engineer, it is very easy to understand how to access the spatial thematic data and find the correct visualization methods; however, for an ordinary user who may be unfamiliar with systems, it is rather hard to find the correct way to use the program. Thus, there is a wizard available for the user that teaches them how to use the program to make thematic maps. The user only has to make small choices and fill tables, and the visualization will be accomplished automatically.
• Personal information: Because personal information, such as age, gender, and area of interest, plays a crucial role in determining the preference of a person, these pieces of information are collected and stored as auxiliary information in designing the visualization methods. For example, for a young lady, a modern and warmer style is popular, whereas for an aged professional man, a traditional and cooler style is preferable.
2.3.2 Relationship between data characteristics and visualization methods
The thematic data discussed in this paper contain three types of information: location information, such as a specific point or boundary; time information, which takes the form of a time unit, such as a year or month; and indicator information, such as population indicators. Based on the location information, thematic data are classified into point-based, polygon-based and space-series–based datasets.
• Point-based dataset: This type of dataset contains one specific geographical point with an (x, y) coordinate for locating the thematic result, and the thematic value is stored as a z value. This dataset is the basic data type of all datasets.
• Polygon-based dataset: The polygon-based dataset contains a specific geographical polygon with a series coordinates (x, y, x1, y1…) for locating spatial data. The polygon is often used to describe the districts of a city, and this type of dataset is the one used most frequently in urban planning.
• Space-series dataset: The space-series dataset contains a series of points with (x, y) coordinates, and the thematic result is located not on these points but in the polygons generated by these points, such as a Thiessen polygon or triangulated irregular network (TIN).
The relationship between data characteristics and visualization methods is vital for intelligent visualization. An array of symbolizing methods for spatial thematic data is available in traditional thematic cartography. According to the data classification scheme, these methods are also classified, and the proper methods are selected for specific data. The methods used to visualize point-based datasets include pie symbols, bar symbols, pyramid symbols, scatter plots, and several other artist symbols; for polygon-based data, polygon-based thematic symbols and choropleth maps can be easily identified as the proper methods; for space-series datasets, TIN and contours are appropriate. The matches between data and the visualization methods are fetched by the experience of experts and stored as the basic knowledge for automated data processing and visualization, which is shown in Table 1.
Table 1– Relationship between data characteristics and visualizing methods.
Type Thumbnail Name Dataset Time Indicator
10 Pie Point/Polygon Single Single/Multi
11 3D pie Point/Polygon Single Single/Multi
Bol. Ciê 1 7 8
13 14 15 16 17 18 19 20 21 22 23 24 25 26 27 28
ênc. Geod., sec. A
Design a Artigos, Curitiba, 3D ring Multi-ring Double half pie Human-shape Multi-fan shaped Dynamic pie Rectangle Bar 3D bar Cylinder Stacked multi-bar Pyramid Composed bar Multi-human Bamboo Multi-triangles and implementati
v. 19, no 2, p.172 Point/Pol
g Point/Pol
Point/Pol Point/Pol Point/Pol Point/Pol Point/Pol Point/Pol Point/Pol Point/Pol Point/Pol Point/Pol d Point/Pol Point/Pol Point/Pol Point/Pol
on of a WEB inte
2-190, abr-jun, 20 ygon Singl
ygon Singl
ygon Mult
ygon Singl
ygon Singli
ygon Mult
ygon Singli
ygon Singli
ygon Singl i
ygon Singli
ygon Singli
ygon Singl
ygon Singli
ygon Singli
ygon Singl
ygon Singl
eractive thematic
013.
le Sin
le Sin
ti Sin
le Sin
le/Mult Sin
ti Sin
le/Mult Sin
le/Mult Sin
le/Mult Sin
le/Mult Sin
le/Mult Sin
le Mu
le/Mult Sin
le/Mult Mu
le Sin
le Sin
29 Fold Point/Polygon
Single Single/Multi
30 Scatter plot Point Single Single
40 Area Point/Polygon Multi Single/Multi
50
Multi-half-pie Point/Polygon
Single Single/Multi
51 Triangle Point/Polygon Single/Multi Multi
60 Shading Space-Series
Single Single
70 Choropleth Polygon/Space
-Series
Single Single
1220 Ring & bar Point/Polygon Single Multi
1222 Ring &
cylinder Point/Polygon
Single Multi
1322 3D ring &
cylinder Point/Polygon
Single Multi
1414 Double
half-ring Point/Polygon
Single Single/Multi
In Table 1, there are 30 typical thematic cartography symbols. The header of the table is described below.
• Type: the ID of a thematic symbolizing method.
• Thumbnail: a thumbnail to illustrate the method.
• Name: a name for the symbolizing method.
• Dataset: the data classification discussed above, including point, polygon, and space-series datasets
• Time: the time attributes of a spatial thematic data; single refers to a time point, such as the year 2008, whereas multi refers to multi-time points, such as the years 2008, 2009, and 2010.
multi-Design and implementation of a WEB interactive thematic cartography...
Bol. Ciênc. Geod., sec. Artigos, Curitiba, v. 19, no 2, p.172-190, abr-jun, 2013.
1 8 0
indicators, such as “House Area, Commercial Area, Factory Area”.
Using the above paragraph, it is possible to decide which symbol is suitable for the specific thematic data that the user wants to visualize on a thematic map. Which data are visualized is determined based on the user preference and restricted by the characteristic of the thematic data: the type of dataset to which the data belongs, the number of time attributes, and the number of indicator values in the data.
2.4 Web Thematic Mapping Service Chain
Following the above analysis of the technology and cartography knowledge base is the design of the web thematic mapping service chain. The WTMSC is comprised of four sub-services: a Symbolizing Service (SS) used to visualize spatial data to provide a spatial-related thematic symbolizing layer; a Base Map Service (BMS) to provide the geographical layer (base map); a Legend Service (LS) to describe the map and the legend of the symbolizing layer; and an Integrating Mapping Service (IMS) to integrate the symbolizing layer, base map layer, and legend layer to produce a complete map. The process of a WTMSC can be described as follows:
1) Thematic data are fetched from the data base;
2) The data are transformed into visual variables and then processed by the SS, which produces the symbolizing layer;
3) A geographical layer is produced by the BMS according to the boundary of the symbolizing layer;
4) A thematic symbol legend layer is produced by the LS according the thematic data and some metadata.
5) The map elements are integrated by the IMS to produce a complete thematic map.
The entire process is illustrated in Figure 1.
2.4.1 Base Map Service (BMS)
Space elements of spatial data, such as points, polygons, or space series, are described with a series of geographical coordinates. A proximity boundary of a map can be obtained by calculating the coordinates. The proximity boundary helps to alleviate the burden of requesting the base map from an online Geo-Data source, such as a WMS, ARCGIS REST Service, or any other map service. The response to the request is fetched as a base map layer; it is an image map URL. A typical base map service defined by the program could be described as follows:
The parameters are the same as a standard WMS, which includes VERSION, REQUEST, LAYERS, STYLES, CRS, BBOX, WIDTH, HEIGHT, and FORMAT.
The BBOX is the geographical boundary of Shenzhen, China.
BBOX=79099.55629545472,11019.068422182201,182908.07516978457,55784.08027877053
Design and implementation of a WEB interactive thematic cartography...
Bol. Ciênc. Geod., sec. Artigos, Curitiba, v. 19, no 2, p.172-190, abr-jun, 2013.
1 8 2
The services are defined below.
2.4.2 Symbolizing Service (SS)
Spatial data with information of space, time, and indicators can be transformed into visual variables. Bertin’s theory of symbolization includes six visualizing variables – shape, size, density, color, brightness, and orientation (BERTIN, 1967) – some of which (shape, size, and color) are made into unique parameters in visualization methods. These parameters can then be interpreted by a Symbol Engine of the SS to visualize the data as a symbolized layer.
The SS is similar to a WMS in structure, whereas the parameters are defined according to Bertin’s theory. It is not advisable to depict more than one thematic variable on a single map, but in this case, the theory is extended by introducing multi-thematic variables with multi-visual values. For example, if there are two thematic variables, for each thematic variable, the visual variables are defined separately, such as the color parameters, which will contain two red, green, and blue (RGB) values, in accordance with two thematic variables.
To demonstrate how the SS works, a typical SS could be requested as follows:
In this request, http://localhost:7001//szOnlineCarto/WCSServe is the server address in the Internet, followed by 10 parameters in the web service, which can be interpreted in order as follows:
• WC: the geographical boundary of the thematic symbolizing layer, similar to the BBOX of a WMS.
• DC: the size of the output thematic map, similar to the WIDTH and HEIGHT of a WMS.
• Data: the name of the spatial thematic data, typically an XML-based spatial thematic data source.
• Type: the ID of the symbolizing method, typically expressed as an integer number. For example, 10 represents a pie symbol in our system, and the size of the symbol represents the value of the data. For example, a larger pie area stands for a larger data value, and a larger bar height stands for a larger data value. “Type” has a connection with the visual variables “shape” and “size”.
• Time: the specific time point of the data, Time=2008 means that to access the data in the single year of 2008, a series of time is also supported, such as Time=2008,2009,2010
of the symbol; in a map of a larger scale, the size of the symbol also appears larger.
• Field: the indicator name of the spatial thematic data, which points to the data value of the indicator (a single or multi-indicator is supported).
• Color: the RGB color of the indicator, which is used to symbolize the data and is related to the visual variable “Color”. If there are additional variables, the “Color” parameters will contain more values. For example:
Color=102, 255, 51 represents one thematic variable; Color=102, 255, 51; 255, 0, 0 represents two thematic variables.
• Transparency: the transparency of the thematic symbolizing layer, which is useful when the features should not be blocked in a geographical layer.
• Orientation: the orientation of the symbol, which is related to the visual variable “Orientation”.
The request will be interpreted by the SS engine on the server side, and a thematic symbolizing layer will be relayed as the output.
2.4.3 Legend Service (LS)
The LS is used to generate a legend layer to describe the map; it provides some auxiliary information, such as text information (i.e., map title, units of the data) and the thematic symbol legend. A typical legend service could be requested as follows:
The parameters of the LS are the same as those of the SS with the addition of a parameter called “MetaData”, which is used to fetch the XML format description data for the legend metadata information.
2.4.4 Integrating Mapping Service (IMS)
The IMS is an interface used to request the previous three web services, as the geographical layers, symbolizing layers, and legend layers are generated separately. At the end of the mapping, the IMS is used to integrate these layers and produce a complete map. Because the geographical and symbolizing layers are constructed with the same coordinate system, these two layers can be overlaid. The legend can also be added to the layer, with the position of the legend adjusted to the map content.
A typical IMS could be requested as follows:
http://localhost:7001//szOnlineCarto/WLSServer?WC=78480.4969991903,13747.789911237 436,183527.13446604897,53044.15282892762&DC=0,0,1366,511&MetaData=V$FIELDS_DIC &Data=V$JIAN_ZHU_M&Type=10&Time=2008;&Spatial=1&Color=102,255,51;255,0,0;0,0,25 5;&Field=HOUSE_DEN;INDUS_DEN;TRADE_DEN
&Transparency=0.6&Orientation=horizontal
Design and implementation of a WEB interactive thematic cartography...
Bol. Ciênc. Geod., sec. Artigos, Curitiba, v. 19, no 2, p.172-190, abr-jun, 2013.
1 8 4
• BaseMapURL: the URL of a base map service, see the BMS;
• SymbolURL: the URL of a symbolizing service, see the SS;
• LegendURL: the URL of a legend service, see the LS;
• Style: the style to organize the base map layer, symbolizing layer, and legend layer.
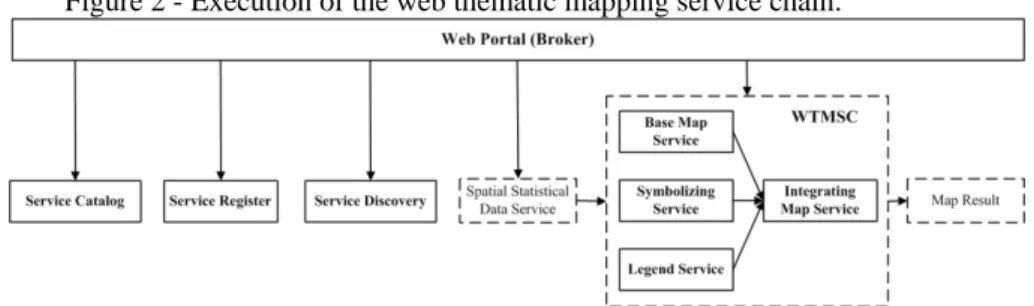
2.4.5 Execution of the WTMSC
The execution of the WTMSC is illustrated in Figure 2.
Figure 2 - Execution of the web thematic mapping service chain.
As shown in Figure 2, there is a web portal for the user to access the WTMSC, and the spatial thematic data are an XML format file with the spatial coordinates, the time value, the indicator value, and some metadata. The user, after selecting a data source, will be able to access the BMS, SS, and LS. Then, the Base Map URL, Thematic Symbolizing Layer URL, and Legend URL will be displayed, and with these URLs, a request will be made for the IMS. Finally, a complete thematic map will be generated. The execution of the WTMSC is driven by the user interaction, but it will work automatically after the thematic data source is assigned. The resulting output map is also an image URL. Furthermore, the parameters of each map service are open to the user, and the service is accessible with a URL simply through a common Internet browser.
3. IMPLEMENTATION
Based on the web cartography method described above, a web thematic mapping program can be developed; some typical applications are provided below.
3.1 Fast map making for decision support in urban planning
Information of Shenzhen. (The website was tested under IE7.0 from the platform website of “szgeoinfo”.) There are 13 themes in the atlas consisting of 113 maps in total, all of which are the outputs of this program. After the thematic data resources are defined, all of the work can be completed in no more than one week, representing a much shorter process than when using traditional map-making methods. The atlas provides overview information of Shenzhen and makes it very convenient for urban managers to fetch the useful information to support decision making. Figure 3 shows the web portal of the online atlas; there are many themes of maps on the web page, and each theme is illustrated with a map with a certain thematic symbol that is automatically generated using this program.
Figure 3 - Website of Shenzhen’s online atlas.
With the program and the online atlas website, urban managers who are from different departments in a distributed environment can conveniently search the mapping results and obtain straightforward information about spatial distributions. If the results available on the website are insufficient, spatial thematic data can be accessed from other resources, new mapping results can be produced using the program, and the outputs can be published on the website. The program and online atlas website have been implemented in daily urban management in Shenzhen and became a subsystem to the Shenzhen geo-information platform. In contrast to traditional map making, the program is a promotion for spatial data visualization that is not only employed by urban managers but also appreciated by citizens as a window to understanding urban development in Shenzhen.
Design and implementation of a WEB interactive thematic cartography...
Bol. Ciênc. Geod., sec. Artigos, Curitiba, v. 19, no 2, p.172-190, abr-jun, 2013.
1 8 6
information for urban planners; when the density of a specific area is too high, there will be heavier traffic and citizen mobility will be restricted. Therefore, urban planners must be able to acquire building density information in real time; when they find the density of a specific urban area is too high, no new buildings should be allowed to be built there. In contrast, when the density of a certain urban area is low, the creation of new buildings could be permitted. Figure 4 is an illustration of the visualization and exploration of the house building density distribution of Shenzhen. As indicated in Figure 4, which shows the distribution of house building density in Shenzhen in the year 2008, when the index of the house building density is higher, the color is darker.
Figure 4 - Map of the housing density distribution.
In Figure 4, there is a legend box on the right (the image in the legend box is the output of the LS); the main map is the overlay of the images from the BMS and SS. An urban planner can easily access the map from a common IE browser. With the map, the urban planner may find that the house building densities of the Luohu District and Futian District are high (index: 0.39-0.58) and that the land area of the districts are small, whereas the densities of the Longgang District (index: 0.06-0.1) and Baoan District (index: 0.1-0.22), which occupy a rather large land area, are still low. Therefore, house building projects may be planned in these two districts.
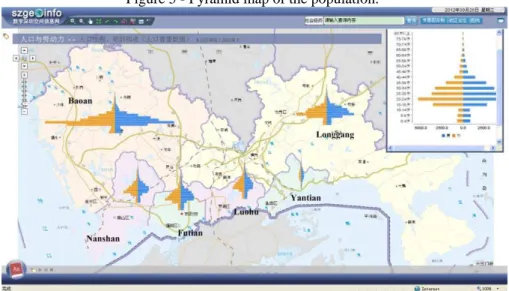
representing females and the color blue representing males. The map is used in the prediction of population growth.
Figure 5 - Pyramid map of the population.
From the map, an urban planner may find that the age groups of 15-44 account for the majority of the entire population and that the percentage of the population over the age of 70 is very low, which implies that Shenzhen is a city with many young people and that its economy will enjoy demographic dividends. The percentage of babies in the population is also not high, which means that the birth rate is very low and thus that in the foreseeable future, the population of young people might decline, potentially affecting the labor force.
3.2 Public participating web thematic mapping
Design and implementation of a WEB interactive thematic cartography...
Bol. Ciênc. Geod., sec. Artigos, Curitiba, v. 19, no 2, p.172-190, abr-jun, 2013.
1 8 8
4. CONCLUSION
In this approach, an online thematic cartography method is introduced for web thematic cartography. Web service chain technology is introduced, and the elements of web thematic maps are investigated, followed by the suggestion of a web thematic mapping program based on the WTMSC. The WTMSC is designed by chaining together with a BMS, SS, LS, and IMS. The correspondent web services could be accessed through standard URLs with defined parameters, which are used to produce the base map layer, thematic symbolizing layer, and legend layer, with all of the URLs integrated to produce a complete thematic map. The parameters of the URL of each web service are open to individual users; thus, the web service can be conveniently manipulated through a common internet browser.
Compared with the other currently available web cartography methods, the advantages of a WTMSC-based method can be summarized as follows: the method is more open to the public, the mapping flow is smooth, the parameters of the mapping services are accessible to the user, and users can conveniently interact with the program and acquire intuitive spatial thematic information. With the WTMSC, the mapping of spatial thematic data can be produced automatically in a distributed environment, which minimizes the time consumed in data visualization and mapping and improves the efficiency of the thematic data mapping. Because urban spatial thematic data continuously change with time and are dynamic, new maps can be regenerated as soon as the data are updated. Furthermore, the WTMSC shares a similar structure as the OGC standards, which are widely used in the application of web maps, thus significantly facilitating the future standardization of web thematic mapping.
There are also some limitations to this method. The first is concerned with the resolution of the output map; because the program is developed in Java and the default output resolution of a Java application is 72 dots per inch (DPI), all of the maps generated by the program are of a 72-DPI resolution. However, users may request a larger map to acquire a map of higher resolution. For example, a map of 2048*1536 pixels has a higher resolution than one of 1024*768 pixels. As spatial analysis-powered mapping is a trend in the development of web thematic mapping, the functionality of spatial thematic data analysis also must be improved, and more data models for spatial thematic data analysis must be added to this program. Fortunately, many of these models are available in MATLAB, GEODA, or ARCGIS, and future efforts are expected in extracting data models from different sources and integrating these models into this program.
ACKNOWLEGEMENTS
express our appreciation and thanks to the engineers at the Geospatial Information Centre in Shenzhen, China.
BIBILIOGRAPHICAL REFERENCES
ANDRIENKO, G.; ANDRIENKO, N. Interactive Maps for Visual Data Exploration. International Journal of Geographical Information Science, 13(4), 355-374, 1999a.
ANDRIENKO, G.; ANDRIENKO, N. Knowledge-based Visualization to Support Spatial Data Mining. In: Advances in intelligent data analysis, Lecture Notes in
Computer Science, Proceedings, 1642, p. 149–160, 1999b.
ANDRIENKO, G.; ANDRIENKO, N. Intelligent support of visual data analysis in descartes. In: 2nd International Symposium on Smart Graphics, Proceedings, p. 21-26, 2002.
ANDREAS, N. Springer Handbook of Geographic Information, Part B, p. 273-287. 2012. doi: 10.1007/978-3-540-72680-7_14, 2012.
BERTIN, J. Semiology of Graphics, University of Wisconsin Press, Madison, p. 456, 1967.
DOBESOVA, Z.; BRUS, J. Coping with cartographical ontology. In: SGEM 2011,
11th International Multidisciplinary Scientific GeoConfrence. Proceedings, p.
377-384, 2011.
DYKES, J. A. Cartographic visualization for spatial analysis. In: International
Cartographic Conference, Barcelona. Proceedings, p. 1365-1370, 1995.
DYKES, J. A. CDV: A flexible approach to ESDA with free software demonstration. In: Proceedings of the British Cartographic Society 34th
Annual Symposium, Leicester, UK. Proceedings, p. 100-107, 1997a
DYKES, J. A. Exploring spatial data representation with dynamic graphics.
Computers & Geosciences, 23(4), 345-370, 1997b. http://www.mimas.ac.uk/
argus/ICA/J.Dykes/.
DYKES, J. A.; MACEACHREN, A. M.; KRAAK, M.J. Exploring
Geovisualization, Pergamon, p. 732, 2005.
GRANELL, G.; DÍAZ, L.; GOULD, M. Service-oriented applications for environmental models: reusable geospatial services. Environmental Modeling
& Software, 25, 182-198, 2010. DOI:10.1016/j.envsoft.2009.08.005.
HARDISTY, F.; ANTHONY, C. R. The Geoviz toolkit: Using component-oriented coordination methods for geographic visualization and analysis. International
Journal of Geographical Information Science 25(2), 191-210, 2011.
JERN, M., et al. The GAV toolkit for multiple linked views. In: the Fifth
International Conference on Coordinated and Multiple Views in Exploratory Visualization, CMV 2007. Proceedings, p. 85-97, 2007.
Design and implementation of a WEB interactive thematic cartography...
Bol. Ciênc. Geod., sec. Artigos, Curitiba, v. 19, no 2, p.172-190, abr-jun, 2013.
1 9 0
MACEACHREN, A. M. Some Truth with Maps: A Primer on Symbolization and Design. Association of American Geographers, Washington, 1994.
MACEACHREN, A. M.; KRAAK, M. J. Exploratory cartographic visualization: Advancing the agenda. Computers & Geosciences, 23, 335- 344, 1997.
MACKINLAY, J. Automating the design of graphical presentation of relational information. ACM Transactions on Graphics 5, 110-141, 1986.
PERCIVALL,G. (Ed.) The OpenGIS abstract specification, topic 12: OpenGIS service architecture. Version 4.3, OGC 02-112. Open Geospatial Consortium, p. 78, 2002.
RAUTENBACH, V. et.al. Orchestrating OGC web services to produce thematic maps in a spatial information Infrastructure. Computers, Environment and
Urban Systems, 37, 107-120, 2012.
REX, G. C. Web mapping services: A Tool for thematic internet maps. In: The
XXIIth International Cartographic Conference. Proceedings, 2005.
ROTH, S.M.; MATTIS, J. Data characterization for intelligent graphics presentation. In: SIGCHI’90: Human Factors in Computing Systems. Proceedings, p. 193-200, 1990.
YUE, P.; DI, L.P.; YANG, W.L.; YU, G.N.; ZHAO P.S. Semantics-based automatic composition of geospatial web service chains. Computers & Geosciences, 33, 649-665, 2007.
ZENG, X.G.; ZHAO, F. Ontology driven automatic web thematic mapping based on web service chain. In: 19th International Conference on Geoinformatics,
Shanghai , Proceedings, p. 1-6, 2011.
ZHAN, F.B.; BUTTENFIELD, B.P., Object-oriented knowledge-based symbol selection for visualizing statistical information. International Journal of
Geographical Information Systems, 9, 293-315, 1995.
ZHANG, L.; GUO, Q.; JIAO, L. Design and implementation of decision-making support system for thematic map cartography. In: The International Archives of
the Photogrammetry, Remote Sensing and Spatial Information Sciences, Beijing.Proceedings, Vol. XXXVII, Part B2, 2008.