Article
J. Braz. Chem. Soc., Vol. 26, No. 4, 642-648, 2015. Printed in Brazil - ©2015 Sociedade Brasileira de Química 0103 - 5053 $6.00+0.00
A
*e-mail: [email protected]
Fast Classification of Different Oils and Routes Used in Biodiesel Production Using
Mid Infrared Spectroscopy and PLS2-DA
Sarmento J. Mazivila,*,a,b Hery Mitsutake,a Felipe B. de Santana,a Lucas C. Gontijo,a,c
Douglas Q. Santosd and Waldomiro Borges Netoa
aInstitute of Chemistry, Federal University of Uberlândia, Campus Santa Mônica,
38408-100 Uberlândia-MG, Brazil
bJosina Machel Secondary School of Belane, Vilankulo-Inhambane, Mozambique
cGoiano Federal Institute of Education, Science and Technology,
Rodovia Geraldo Silva Nascimento, km 2.5, 75790-000 Urutaí-GO, Brazil
dTechnical School of Health, Federal University of Uberlândia, Campus Umuarama,
38400-902 Uberlândia-MG, Brazil
This work aimed at employing partial least square discriminant analysis (PLS2-DA), allied to mid-infrared (MIR) spectroscopy as an analytical method for simultaneous classification of biodiesels from different oils (soybean and used frying oil) and routes (methylic and ethylic). The evaluation of the model was verified through values of sensitivity and specificity for each parameter, in the interest class. PLS2-DA model showed 100% correct classification in the discrimination of types of biodiesels. Therefore, the proposed methodology is fast, because it allows simultaneous classification of different types of biodiesels. Consequently, it can be used in quality control of this type of biofuel.
Keywords: biodiesel, infrared, PLS2-DA classification
Introduction
Biodiesel is a fuel produced by a transesterification reaction in which oils from different oil seeds, animal fats and used frying oil react with alcohol, usually methanol or ethanol, in the presence of a catalyst.1-3
Among the feedstocks used in the production of biodiesel in Brazil, soy is the most commonly used (ca. 80.35%).4 However, it has the disadvantage of being used as food. Thus, just relying on cultivation as a main supplier of feedstocks for biodiesel production can limit the production of fuel for some regions according to climatic conditions and soil quality.5 Consequently, the use of other feedstocks (e.g., used frying oil) is necessary. The use of frying oil has promising potential for biodiesel production,6,7 because it is a disposal product of frying and avoids competition with vegetable oil employed in human consumption,8 once the use of used frying oils reduces the problem of contamination of waste water, that
is, for the reuse of these fatty residues may contribute to decrease the burden on the government in remove these wastes in sewages.9 Furthermore, according to the European commission approved directive 2012/0288/EC,10 from 2020, biofuels produced from oils employed in human food should not be subsidized for the purpose of encouraging the use of feedstocks that do not take additional demand for land and do not enter the human food supply such as used frying oil.
The various feedstocks used to produce biodiesel, have different characteristics due to the chemical composition of fatty acids. Consequently, the final product has different physicochemical properties. Therefore, the quality control of biodiesel is very important,7 so it is necessary to develop methodologies that can identify the feedstock used in the biodiesel production.5,10
method but is slow when compared to vibrational spectroscopy techniques.12 Infrared spectroscopy methods have advantages, such as the use of relatively low cost equipment that allows field analysis; minimal or no sample treatment; expeditious analysis; causing no sample destruction and demanding no reagents.13 Also, these methods allow in situ analysis using portable equipment. In this sense, the use of infrared spectroscopy combined with multivariate analysis has been applied in several areas such as health and food. Yi et al.14 employed near infrared (NIR) spectroscopy combined with PCA and hierarchical cluster analysis (HCA) to discriminate gastric cancer in relation to the type of tissue where 90 samples were classified as cancerous or normal tissues. The study showed the separation of different groups according to the type of tissue with an accuracy of 81.1%. Borras et al.15 developed a methodology to classify 160 samples of almonds in relation to their bitterness by NIR and partial least square discriminant analysis (PLS-DA), with an accuracy of 95.7%. In this case, the PLS-DA model could not only classify the samples according to their similarity but was also able to recognize new samples not used in the development of the model.16
Recent studies indicate that the use of mid-infrared (MIR) spectroscopy and NIR combined with supervised chemometric methods have potential as promising methodologies for classifying fuels. Veras et al.17 used soft independent modeling of class analogy (SIMCA) to classify 108 samples of biodiesel using NIR spectroscopic data, which was able to classify, with an accuracy of 100%, biodiesels in relation to the type of oil used: cotton, sunflower, soybean and rapeseed oil. Balabin et al.18 employed NIR spectroscopic data and support vector machines discriminant analysis (SVM-DA) to classify motor oil according to the feedstock used: synthetic, semi-synthetic and mineral oil. The best result presented an error of 6% for classification. Silva et al.13 classified the common and additivated gasoline with a correct classification of 100% of the test samples using MIR spectroscopic data combined with linear discriminant analysis and variable selection.
Notably, the simultaneous classification using MIR spectroscopy and PLS2-DA was not previously used to classify more than two types of biodiesels. The simultaneous classification using PLS2-DA is advantageous, for analysis of several properties of interest, in single calibration19 that can be used in industry in order to gain time. Thus, this work aims to classify the different types of biodiesels regarding their feedstock and the alcohol used in the transesterification process using MIR spectroscopy coupled with the multivariate technique PLS2-DA.
Experimental
Biodiesel production and characterization
The soybean refined oil used in the synthesis of biodiesel was acquired in the local market, and soybean used frying oil (UFO) were collected from local restaurants. To obtain each batch of biodiesels, 200.0 g of oil and a mixture containing potassium ethoxide or methoxide (60.0 g of ethanol or methanol (PA) and 2.0 g of KOH) were stirred at 400 rpm. After 1 h, the resultant solution was concentrated in a rotary evaporator to remove the excess of alcohol. Then the solution was allowed to stand for 24 h to separate production residues and coproducts. After the two-layer separation, the obtained esters were purified by washing with distilled water at 90 °C and drying using vacuum distillation. In a rotary evaporator with a bath temperature of 90 °C, the flash point was measured hourly until a constant value was reached.
For the production of biodiesel from UFO, esterification was performed before the transesterification process for the purpose of reducing the level of acidity and increasing the efficiency in the conversion of ethyl and methyl esters.
The methods used to characterize the biodiesel were as follows: the moisture content was analyzed using a Karl Fischer colorimetric titrator (model 831 KF) according to standard ASTM D-6304. Acidity was determined according to the official procedures recommended by ABNT NBR 14448. Free and total glycerin fractions were determined according to the methodology described by ABNT NBR 15771 and ABNT NBR 15344, respectively. The range of conversion in biodiesel were determined by ABNT NBR 15764.
Sample preparation
Acquisition of spectral data
The MIR spectra were acquired using a PerkinElmer Spectrum Two spectrometer equipped with an attenuated total reflectance (ATR) sample holder and ZnSe crystal. The spectra were recorded in the range of 4000-600 cm−1 with 4 cm−1 resolution and were acquired using 16 scans for each of the quintuplicates. The average spectra of replicate (n = 5) for construction of the multivariate models were obtained.
Due to fluctuation of the spectral baseline these were submitted to correction by a baseline algorithm.21 For this, the spectral ranges 2500-1850 cm–1 and 4000-3150 cm–1 were selected. In order to minimize the unwanted systematic variation, in this study, before any chemometric analysis was performed, pre-processing of the data was carried out using a mean-centered approach for the variables in the X block and Y block.22
Chemometrics analysis
To execute the multivariate procedures, MATLAB software version 7.5 (Mathworks Inc.) and PLS_Toolbox, version 7.5 (Eigenvector Research) were used.
The PLS2-DA models were developed based on the PLS algorithms.23 PLS2-DA is a version of the PLS-DA method, where the variables in the X block (spectral data) were related to classes contained in the Y matrix, in which each column vector represent the class of interest. The integer values of the class were arranged in each column of Y matrix, where 1 was used for the interest class and 0 for the class without interest.
The threshold value was predicted between 0 and 1 based on Bayes theorem, in order to minimize the errors in the prediction of the class through an appropriate number of latent variables (LV).24 The number of latent variables chosen for the PLS-DA models followed the criterion of the lowest prediction error in leave-one-out cross-validation and evaluation of the explained variance in the X and Y blocks. The outlier detection parameter was based on the identification of samples with high leverage values and Q residuals at 95% confidence.25
Performance analysis
The criteria used to evaluate the quality of the PLS2-DA model were sensitivity (Sens) and specificity (Spec) in the test sample set. Sensitivity is number of samples predicted to be in the class divided by number actually in the class and specificity is number of samples predicted not to be in the class divided by actual number not in the class.26 These parameters were related to the concepts of statistical inference as false positive (FP) and false negative (FN) errors.27-29 Sens and Spec were calculated according to equations 1 and 2, respectively.30
TP Sens =
TP + FN (1)
TN Spec =
TN + FP (2)
where TP and TN denote the numbers of true positives and true negatives, respectively. For example, in the classification of UFEE from the others type of biodiesels, UFEE was considered as “positive” and others types of biodiesels was considered as “negative”.
Results and Discussion
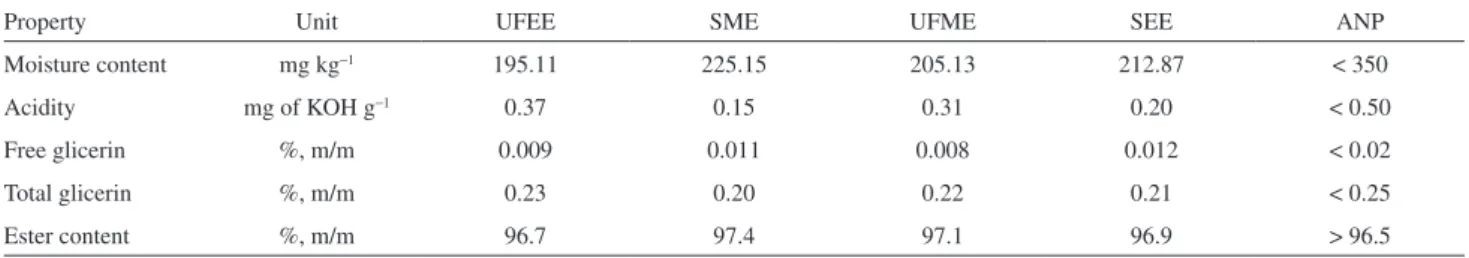
Table 1 presents the physicochemical properties of the UFEE, SME, UFME and SEE. The parameters are found to be within the established by National Petroleum Agency for Natural Gas and Biofuels of Brazil (ANP).31
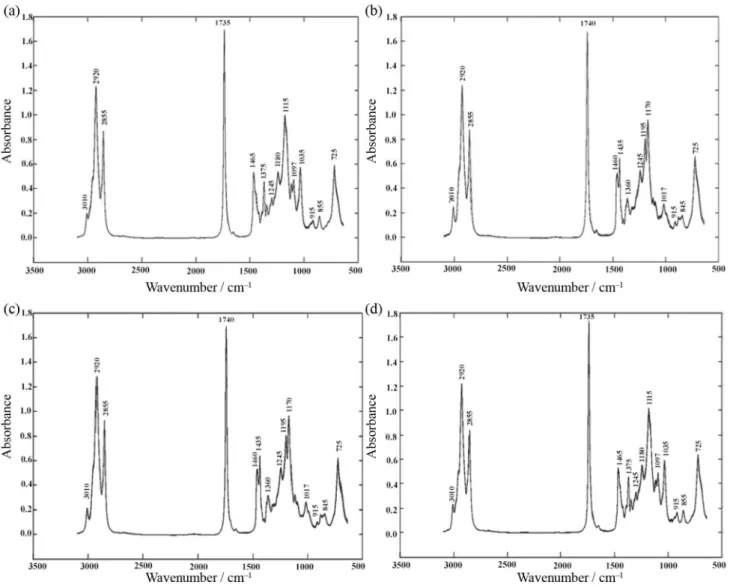
The MIR spectra of the samples of biodiesel are shown in Figure 1. According to Almeida et al.,32 the 3000-2850 cm−1 is characteristic of the symmetric and asymmetric CH stretching vibrations of the methylene and terminal methyl groups. Thus, the prominent band at 2920 cm−1 is attributed to symmetric vibration of CH3 bond, near 2855 and 3010 cm−1 are attributed to methylene symmetric and asymmetric stretching vibrations, respectively; at 1740 cm−1 is observed an intense band assigned to the stretching of the C=O bond of an ester.
The region of 1500-900 cm−1 is known as the fingerprint region of complex spectra that include many coupled
Table 1. Physicochemical properties of the UFEE, SME, UFME, SEE
Property Unit UFEE SME UFME SEE ANP
Moisture content mg kg−1 195.11 225.15 205.13 212.87 < 350
Acidity mg of KOH g−1 0.37 0.15 0.31 0.20 < 0.50
Free glicerin %, m/m 0.009 0.011 0.008 0.012 < 0.02
Total glicerin %, m/m 0.23 0.20 0.22 0.21 < 0.25
vibrational bands, that is, particular bands in this region can hardly be attributed to a single chemical bond or group.33 In this perspective, peaks around 1460 cm−1 are due to bending vibration of the CH2 and CH3; near 1435 cm
−1 is assigned to
rocking vibration of CH bonds of cis-disubstituted olefins;34 near 1245 cm−1 may be attributed to antisymmetric axial stretching vibrations of CC(=O)−O bonds of the ester, while peaks near of 1195 cm−1 may be assigned to asymmetric axial stretching vibrations of O−C−C bonds.35
In the region of low frequency from 900-700 cm−1, the significant vibrations were attributed to out of the plane deformation of the groups C=CH-τ (olefinic CH) and ω (olefinic CH) to the unsaturated derivatives.32 Therefore, as shown in Figure 1, it was observed that there is great similarity between the profiles of the different biodiesels due to the high degree of similarity between the spectral profiles of the biodiesels, and that the use of chemometric techniques is needed to discriminate between these biodiesels.
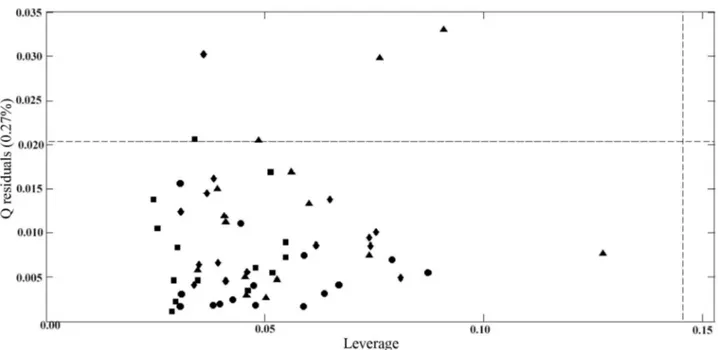
To verify the presence of outliers in the PLS2-DA model, the leverage versus graphic Q residual was used (Figure 2). We noted that none of the samples were considered an outlier.
During the analysis, it was found that the PLS1-DA models for each class showed 100% correct classification, in other words, the sensitivity and specificity equal to 1. The PLS2-DA model developed also obtained values of sensitivity and specificity equal to 1, which shows 100% correct classification. Nevertheless, when the dependent variables are strongly correlated, PLS2 provides models with predictive abilities similar to that of PLS1.36 Thus, the PLS2-DA model was used, once it is able to classify or predict multiple classes in the single calibration.37
The 2461 variables from the 88 samples in the PLS2-DA model to classify each type of biodiesel (UFEE, SME, UFME and SEE) were reduced to three latent variables with 99.72% of the variance explained. The first latent variable (LV1) is the main variable responsible for the separation
routes (methylic and ethylic), explaining 93.71% of the original variance (Figure 3).
Figure 3 demonstrates a separation for the discriminated classes, showing that the MIR spectra present chemical information that makes it possible for PLS2-DA to discriminate between the four types of biodiesel. This result shows that the PLS2-DA model is able to differentiate samples of biodiesel obtained from soybean oil refined, as the frying oil used, from different routes (methylic and ethylic). However, if a sample of biodiesel of the same route was prepared from a mixture of soybean oil and used frying oil, the PLS2-DA model predicts in the class to which the
sample presents greater similarity according to content of each of the types of oils in the mixture.
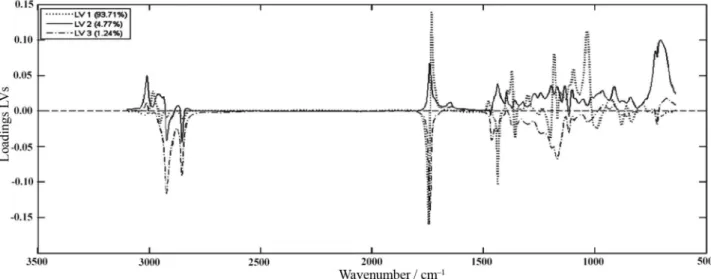
The loadings (Figure 4) show the wavenumbers responsible for this separation. Analyzing the graph of the loadings, the separation of the ethylic route (UFEE and SEE) in relation to the methylic route (SME and UFME) by LV1 was mainly determined by spectral vibration at 1740 and 1195 cm–1, these vibration bonds can be assigned to C=O and O−C−C, respectively. The variables that have the greatest contribution to LV2 correspond to regions of low frequency from 900-700 cm–1, which correspond to deformation out of the plane of the groups C=CH-τ (olefinic CH) and ω (olefinic CH) to the unsaturated derivatives. Finally, LV3 loadings indicate the contribution of the band at 2920 cm−1 attributed to symmetric vibration of CH3.
The class assignment of result is expressed in a value from 0 to 1. Thus, these values are normally distributed around 0, when the prevision is not the class of interest and near 1, when the prevision is the class of interest. For this reason is possible to obtain prevision value below 0 (negative value) and also values above 1.38 Therefore, it is necessary to calculate a threshold value to assume that a sample belongs or not to a determinate class of biodiesel.39 Its calculus is done by Bayes theorem, minimizing the number of false positives and false negatives for future prediction of model.38
Table 2 shows the results of the classification parameters obtained for PLS2-DA model, where all types of biodiesel were separated between the estimated class value,
Figure 2.Plot of the spectral residuals versus the leverage at a significance level of 5% for PLS2-DA model, where ( training set) UFEE, ( training
set) SME, ( training set) UFME, ( training set) SEE. The graph of model was generated using 3 LVs.
Figure 3. Scores plot of PLS2-DA analysis of type of biodiesels, where
Table 2. Classification parameters obtained for PLS2-DA model
Class No. of LV Threshold
value Sensitivity Specificity
UFEE 3 0.57 1.00 1.00
SME 3 0.60 1.00 1.00
UFME 3 0.62 1.00 1.00
SEE 3 0.61 1.00 1.00
Table 3. Result of prediction sample set of PLS2-DA model
Class N right/N total TP FP TN FN
UFEE 7/7 1.00 0.00 1.00 0.00
SME 7/7 1.00 0.00 1.00 0.00
UFME 7/7 1.00 0.00 1.00 0.00
SEE 7/7 1.00 0.00 1.00 0.00
Figure 4. Loadings plot of LV1 × LV2 × LV3 of PLS2-DA analysis of type of biodiesels.
according the values of sensitivity and specificity, equal to 1 (maximum classification).
The threshold value was used to discriminate between classes and was calculated based on the distribution of samples in the training prediction obtained using the PLS model. If the samples of the class of interest are above the threshold value, these are classified as belonging to the class of interest, and if below, they are classified as not belonging to the class.40
The PLS2-DA showed excellent levels of sensitivity and specificity, which correctly classified 100% of the samples in the test set. According to Table 3, we can observe that in the PLS2-DA models, we have developed the samples in the test set could be classified as belonging to their respective classes.
Conclusions
The use of mid-infrared spectroscopy in combination with multivariate technique using PLS2-DA classified with 100% efficiency samples of biodiesel in relation to the type of oil and the alcohol used in their production. Thus, this methodology is a viable alternative for the quality control of biodiesel, which offers fast analysis, non-destructive technique and potential in situ analysis using portable equipment to classify more than two types of biodiesels simultaneously.
Acknowledgements
The authors thank the Covenant CNPq/MCT-Mz, process No. 190802/2012-0, for financial support.
References
1. Ruwwe, J.; Chem. Today2008, 26, 26.
2. Martyn, J.; Earle, M. J.; Plechkova, N. V.; Seddon, K. R.; Pure Appl. Chem. 2009, 81, 2045.
3. Bournay, L.; Casanave, D.; Delfort, B.; Hillion, G.; Chodorge, J. A.; Catal. Today2005, 106, 190.
4. http://www.anp.gov.br/?dw=71842 accessed in January 2015. 5. Mueller, D.; Ferrão, M. F.; Marder, L.; Costa, A. B.; Schneider,
R. C. S.; Sensors 2013, 13, 4258.
6. Cvengroš, J.; Cvengrošová, Z.; Biomass Bioenergy2004, 27, 173.
7. Baptista, P.; Felizardo, P.; Menezes, J. C.; Correia, M. J. N.; Talanta2008, 77, 144.
9. Encinar, J. M.; González, J. F.; Rodríguez-Reinares, A.; Fuel Process. Technol. 2007,88, 513.
10. http://www.europarl.europa.eu/meetdocs/2009_2014/ documents/com/com_com%282012%290595_/com_ com%282012%290595_pt.pdf accessed in January 2015. 11. Wang, R.; Song, B.; Zhou, W.; Zhang, Y.; Hu, D.; Bhadury,
P. S.; Yang, S.; Appl. Energy 2011, 88, 2064.
12. Balabin, R. M.; Safieva, R. Z.; Anal. Chim. Acta2011, 689, 190.
13. Silva, M. P. F.; Brito, L. R.; Honorato, F. A.; Paim, A. P. S.; Pasquini, C.; Pimentel, M. F.; Fuel2014, 116, 151.
14. Yi, W.; Cui, D.; Li, Z.; Wu, L.; Shen, A.; Hu, J.; Spectrochim. Acta, Part A 2013, 101, 127.
15. Borras, E.; Amigo, J. M.; Berg, F.; Boque, R.; Busto, O.; Food Chem. 2014, 153, 15.
16. Brereton, R. G.; Chemometrics for Pattern Recognition, 1st ed.;
Wiley: Chichester, 2009.
17. Veras, G.; Gomes, A. A.; Silva, A. C.; Brito, A. L. B.; Almeida, P. B. A.; Medeiros, E. P.; Talanta2010, 83, 565.
18. Balabin, R. M.; Safieva, R. Z.; Lomakina, E. I.; Microchem. J.
2011, 98, 121.
19. Galtier, O.; Abbas, O.; Dréau, Y. L.; Rebufa, C.; Kister, J.; Artaud, J.; Dupuy, N.; Vib. Spectrosc.2011, 55, 132. 20. Almeida, M. R.; Fidelis, C. H. V.; Barata, L. E. S.; Poppi, R. J.;
Talanta2013, 117, 305.
21. Lasch, P.; Chemom. Intell. Lab. Syst. 2012, 117, 100. 22. Ferreira, M. M. C.; Antunes, A. M.; Melgo, M. S.; Volpe,
P. L. O.; Quim. Nova 1999, 22, 724.
23. Wold, S.; Sjöström, M.; Eriksson, L.; Chemom. Intell. Lab. Syst.
2001, 58, 109.
24. Roggo, Y.; Chalus, P.; Maurer, L.; Lema-Martinez, C.; Edmond, A.; Jent, N.; J. Pharmaceut. Biomed. 2007, 44, 683. 25. Walczak, B.; Massart, D. L.; Chemom. Intell. Lab. Syst. 1998,
41, 1.
26. http://212.51.214.51/jsurmacki/pliki/zajecia/LMDiT/cw3/ PLS_Manual_4.pdf accessed in January 2015.
27. Langeron, Y.; Doussot, M.; Hewson, D. J.; Duchene, J.; Eng. Appl. Artif. Intel. 2007, 20, 415.
28. Dingari, N. C.; Barman, I.; Myakalwar, A. K.; Tewari, S. P.; Gundawar, M. K.; Anal. Chem.2012, 84, 2686.
29. Ortiz, M. C.; Sarabia, L. A.; Sanchez, M. S.; Anal. Chim. Acta
2010, 674, 123.
30. Xu, L.; Cai, C. B.; Cui, H. F.; Ye, Z. H.; Yu, X. P.; Meat Sci.
2012, 92, 506.
31. http://nxt.anp.gov.br/nxt/gateway.dll/leg/resolucoes_anp/2014/ agosto/ranp%2045%20-%202014.xml accessed in January 2015.
32. Castilho-Almeida, E. W.; dos Santos, H. F.; de Miranda, A. M.; Jorio, A.; Ferreira, E. H. M.; Achete, C. A.; Armond, R. A. S. Z.; Anconi, C. P. A.; de Almeida, W. B.; Quim. Nova2012, 35, 1752.
33. Gauglitz, G.; Vo-Dinh, T.; Handbook of Spectroscopy, 1st ed.;
Wiley-VCH: Weinheim, 2003.
34. Sánchez-Alonso, I.; Carmona, P.; Careche, M.; Food Chem.
2012, 132, 160.
35. Soares, I. P.; Rezende, T. F.; Silva, R. C.; Castro, E. V. R.; Fortes, I. C. P.; Energy Fuels 2008,22, 2079.
36. Vandeginste, D. G. M.; Massart, D. L.; Buydens, L. M. C.; de Jung, S.; Lewi, P. J.; Smeyers-Verbeke, J.; Handbook of Chemometrics and Qualimetrics, Part B, 1st ed.; Elsevier:
Amsterdam, 1998.
37. Anderson, R. B.; Morris, R. V.; Clegg, S. M.; Bell III, J. F.; Wiens, R. C.; Humphries, S. D.; Mertzman, S. A.; Graff, T. G.; McInroy, R.; Icarus 2011,215,608.
38. Ramos, P. M.; Ruisánchez, I.; Anal. Chim. Acta2006, 558, 274. 39. Massart, D. L.; Vandeginste, B. G. M.; Buydens, L. M. C.;
de Jong, S.; Lewi, P. J.; Smeyers-Verbeke, J.; Handbook of Chemometrics and Qualimetrics: Part A, 1st ed.; Elsevier:
Amsterdam, 1997.
40. Barker, M.; Rayens, W.; J. Chemom. 2003, 17, 166.
Submitted: August 26, 2014