Article
J. Braz. Chem. Soc., Vol. 26, No. 4, 667-675, 2015. Printed in Brazil - ©2015 Sociedade Brasileira de Química 0103 - 5053 $6.00+0.00
A
*e-mail: [email protected]
Visualisation of the Galvanic Effects at Welds on Carbon Steel
Josias F. Pagotto,a,b Maria F. Montemor,c Francisco J. Recio,b,d Artur J. Motheo,a
Alda M. Simõesc and Pilar Herrasti*,b
aInstituto de Química de São Carlos, Av. Trabalhador Sancarlense 400,
13560-970 São Carlos-SP, Brazil
bFacultad de Ciencias, Universidad Autónoma de Madrid, c/ Francisco Tomás y Valiente, 7,
Ciudad Universitaria de Cantoblanco, 28049 Madrid, Spain
cICEMS and DEQ/Instituto Superior Técnico, Universidade Técnica de Lisboa,
Av. Rovisco Pais, 1049-001 Lisboa, Portugal
dFacultad de Química y Biología, Universidad Santiago de Chile,
Av. Libertador Bernardo O´Higgins 3117, 9170022 Santiago de Chile, Chile
Non-destructive classical techniques, such as electrochemical impedance spectroscopy (EIS) and open circuit potential (OCP) measurement, were complemented with advanced techniques, including the scanning vibrating electrode technique (SVET) and localised electrochemical impedance spectroscopy (LEIS) to examine galvanic effects at welds on carbon steel. The classical techniques indicated that corrosion processes are accelerated in the weld. The advanced techniques revealed admittance values related to more severe corrosion along the weld than in the base metal and higher corrosion currents in the weld. When the weld and base metal are electrically connected, the weld serves as a cathodic protector for the base metal.
Keywords: carbon steel, galvanic couple, corrosion, welding
Introduction
The corrosion of carbon steel and its welded zones is a relevant problem that causes substantial economic loss. Ruptures attributed to corroded pipe walls frequently
cause failures in pipelines.1 These breakages are followed
by large product losses, environmental pollution and ecological hazards. Extensive research on the phenomena observed near weld metals, such as corrosion, residual stress and microstructural changes, has been performed,
and corrosion prevention strategies have been formulated.2-4
Welding is a reliable and efficient metal-joining process commonly used in industry. During the weld thermal cycle, a relatively narrow region of the target material is subjected to a wide range of peak temperatures and cooling rates, generating various microstructures and changes in properties of the affected area due to residual stresses and metallurgical changes. Moreover, these changes increase the dissimilarities between the base and weld metals,
causing galvanic corrosion.5 During tungsten inert gas
welding (TIG), or gas tungsten arc welding (GTAW), an arc is maintained between a non-consumable tungsten electrode and the work-piece under an inert gas; this arc is used as a heat source. The carbon content is essential to toughness, weldability, corrosion resistance and low susceptibility to cold cracking in the heat-affected zone. In spite of the homogeneous composition of the weld and the base material, the changes caused by melting in the welded region affect the crystalline structure of the metal, possibly inducing an electrochemical potential difference
and, consequently, a galvanic corrosion process.6,7
There are several techniques used to estimate the corrosion rate of an individual alloy (not in a galvanic
scenario), such as potentiodynamic polarisation,8-11
the weight loss method12-14 or hydrogen evolution
measurements.15 Previous studies have described the
corrosion in welded metals using classical electrochemical
techniques.16,17 Better information is obtained when several
electrochemical impedance spectroscopy (EIS), scanning vibrating electrode technique (SVET) and localised electrochemical impedance spectroscopy (LEIS), may be
used in the same sample.18-20
Localised measurement techniques enable researchers to assess the signal of a sample and obtain information about
the differences within the sample. In 1938, Thornhill et al.21
used a device to measure the corrosion of a sample of zinc partially immersed in a chloride solution. These types of measurements are performed in solution, and the sample is
not affected by the analysis. In 1975, Isaacs et al.22 studied
diffusional effects in localised corrosion on nickel and stainless steel. The SVET was used in steel coated with vapour-deposited aluminium, and the author concluded that the measured defects were related to inclusions; in this work, defects measuring less than 30 µm in diameter
could be detected on the coating.23 The SVET was also
used to assess galvanic corrosion on soldered copper in a chloride/sulphate solution. Two types of solder were used: antimony-tin and lead-tin solders. The location of the defects could be detected; the antimony-tin solder was susceptible to corrosion processes, whereas the lead-tin
solder remained passive.24 Corrosion and pitting have been
studied on steel and nickel using the SVET25 in inorganic
media, and the study of corrosion in organic media has
also been reported.26 The SVET is an indirect measurement
technique because data are obtained from the field line over the solution, whereas the probe is above the surface. The distance between probe and the surface, as well as the size of the area analysed, are notably important because of the
field lines.27 Bayet et al.28 also have reported a set-up for
LEIS measurements.
Electrochemical impedance spectroscopy is a well-established technique for evaluating high-impedance coatings on metal substrates, such as steel, and their degradation. The rates and mechanisms of degradation can often be determined. EIS is a global technique, and therefore, no information can be obtained regarding the site with electrochemical activity. The scanning vibrating electrochemical technique can provide the locations where a coating is degraded and determine both the anodic and
cathodic currents.17,29,30 However, information other than the
current, such as the formation of blisters or the distinction between diffusion and pore resistance, cannot be obtained. Because neither technique perturbs the sample, both techniques could be applied to the same sample. Previous studies have described corrosion in weld metals using
classical electrochemical techniques.16,31
In the present work, we describe a systematic corrosion study on carbon steel weld metal comparing advanced techniques, including SVET and LEIS, in parallel with
classical techniques, such as EIS and open circuit potential (OCP) measurements.
Experimental
All experiments were conducted at room temperature
(ca. 20 °C) using ultrapure water (18 MΩ cm) from a
Millipore purification system and analytical grade NaCl (Merck).
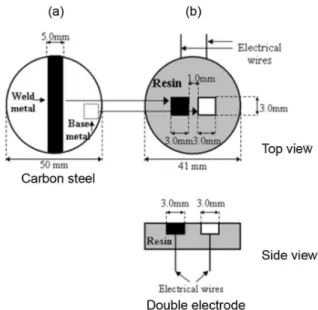
The working electrode was a double electrode composed of 1020 carbon steel, (composition: 0.20% C, 0.45% Mn, 0.25% Si, 0.04% P and 0.05% S) with a weld and base metals. A carbon steel disc was cut and the parts reunited (without a filler material) using TIG with a 100-A DC power source by manual welding. Two pieces were cut from the welded disc: one in the fused metal region and the other in
the base material region, as described in the literature.20 This
arrangement allows to compare the differences between the bulk properties of the two main phases. The samples were
cut with a disc-cutting machine (3 × 3 mm2 of area, and
5 mm of thickness). The cut samples were manually sanded to remove the edges in the corners. Electrical wire contacts (a copper wire, thickness of approximately 0.7 mm) were connected to each piece using solder, and these electrodes were mounted in epoxy resin, forming a double electrode
(Figures 1a and 1b).32 The weld and base metal connected
separately should give an idea to the behavior of the two areas independently and connected. The double electrode was ground using 2400 grit emery paper, degreased in ethanol, rinsed with water and dried with nitrogen before each experiment.
Metallographic analysis
A welded 1020 carbon steel disc was etched with Nital 2% to expose the different crystalline phases. The changes in the crystalline phases between the two regions were inspected via optical microscopy using a Leica DM ILM inverted microscope with a Leica DFC295 digital colour camera. Scanning electron microscope (SEM) micrographs were obtained using a Hitachi S-3000N scanning electron microscope.
EIS measurements
EIS measurements were obtained using a
three-electrode cell with a 1.0 mmol L−1 NaCl solution. The
double electrode was used as the working electrode, a spiral of platinum wire as the counter electrode and a saturated calomel electrode (SCE) as the reference electrode. An AUTOLAB PGSTAT 302N potentiostat was used, and data were acquired using the NOVA 1.7 software program. The frequency ranged from 10 mHz to 100 kHz, and a 10 mV (rms) perturbation amplitude was applied.
LEIS measurements
The LEIS measurements were collected using a Uniscan 370 scanning electrochemical workstation coupled to a scanning control unit and a 1287A Solartron potentiostat 1250 frequency response analyser. The double electrode (working electrodes, WE) was fixed in the experimental compartment, and the support (working electrode) was carefully leveled before starting the measurements to ensure that the probe-electrode distance was constant during the measurements. The microprobe consisted of a dual electrode composed of a 10 µm disc and a concentric ring positioned at ca. 2 mm
above the sample surface.33 The distance between the
microprobe and the electrode was optimized, and it was observed that it has great influence on the response of
the electrode, in accordance with Isaacs.27 A 10 mV
(rms) AC disturbance signal was applied to the working electrode. A SCE reference electrode was used (far from the electrode surface), and two platinum grids placed away
from the WE were used as counter-electrodes.34,35 The
measured impedance consisted of the ratio between the sinusoidal voltage applied to the WE and the sinusoidal current signal measured at the microprobe. Two types of measurements were performed: a punctual spectral impedance measurement and a line scan over the sample at a fixed height, fixed frequency and spontaneous potential starting from the resin and going across the two samples.
SVET measurements
SVET analyses were performed in a 0.05 mol L−1 NaCl
considering that the best visualization of the results was obtained at this salt concentration. A commercial SVET system from Applicable Electronics (PA, USA) was used and controlled by the ASET software program (Science Wares, Inc.). The working electrode for the SVET analysis was the double electrode. However, in this case, the electrodes (weld and base steels) were separated by 0.1 mm and coated with a thin layer of wax to limit the size of the
analysed area, generating 1.0 × 1.0 mm2 of exposed area.
The vibrating electrode was made of platinum-iridium and covered with polymer; the tip was 40 to 50 µm in diameter. The probe tip and counter electrode were coated
with platinum black to decrease their impedance.36 The tip
was held 100 µm above the surface, and although the probe vibrated both parallel and perpendicular to the surface, only the vertical (perpendicular) component of the current is presented. The current density of the mapped area is presented in both 2D and 3D plots; the density is plotted as the z-axis (anodic current plotted as positive) over the x-y area. During the experiments, video-microscope images were acquired at the end of each SVET mapping.
Results and Discussion
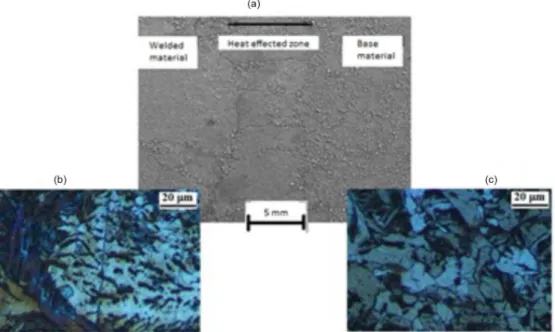
Figure 2a presents an SEM micrograph showing two regions: weld and the base metal. An intermediate zone was also observed, heat affected zone, which is not considered in this work. The image reveals a change in the microstructure caused by the fusion of the material in the weld region. The initial phases of the carbon steel were ferrite and cementite. The base metal shows a structure with better defined grains and larger medium diameters (Figure 2a). In the weld region close to the base metal, a region with partially refined grains can be observed, and grain refining is more distinct near the fusion zone; the predominant phase in this region is acicular ferrite. The lighter layers in the optical microscope (OM) micrographs are the ferrite phase, and the darker layers are cementite. In general, the cementite phase has a higher carbon content than does the ferrite one (Figures 2b and 2c). This change in microstructure has been previously reported: the change depends on the alloys present, as well
as the time and temperature of the weld process.37,38
OCP and EIS results
The OCP variations were observed to decrease for every electrode during the initial 24 h of immersion in a
figure, the weld metal always has a lower open circuit potential. The major potential drop for the weld metal reveals that it is a more active electrode than the base metal. This potential drop can be related to the dissolution of the native oxides and thus to the activation of the metal, but also to other phenomena such as a raise in pH or some depletion of oxygen at the metal surface, both due to the cathodic reaction. For the couple, the OCP potential is an intermediate value between the potentials of the two electrodes, indicating a galvanic effect. The OCP decreases slowly during the first 4 h; after 24 h, the gaps between the two electrodes and the couple are nearly the same because they always follow the same trends. Therefore, the potential drop and corrosion are higher in the
weld, probably due to two factors: the microstructure and corrosion occurring at the grain borders.
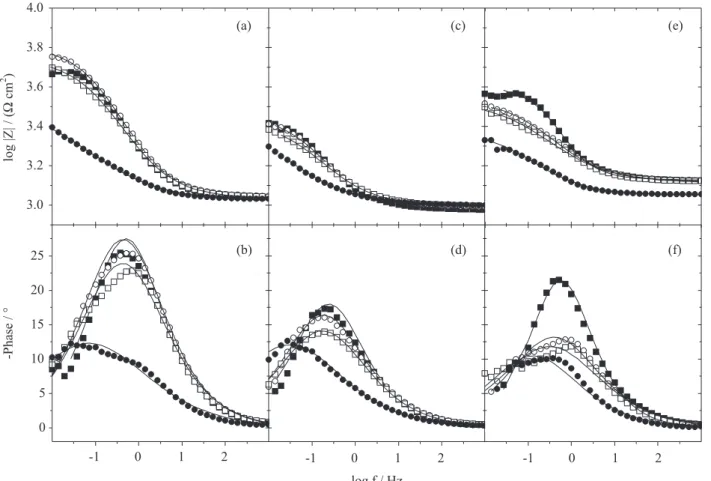
The global (or conventional) EIS spectra for the electrodes and the couple are shown as Bode diagrams in Figures 4 and 5, which exhibit the characteristics of the charge transfer process. Using a Randles circuit (Figure 6)
with an electrolyte resistance (Rs), a charge transfer
resistance (Rct) and a constant-phase element (double-layer
capacitance, CPE), a fit was performed for each curve using the ZVIEW 2.9 software program. A CPE is added to an electric circuit analogue to the interface under study when the capacitive component presents non-trivial frequency dependence. The impedance of the CPE is described as:
( )
1 0
n
CPE
Z
=
Y
−i
ω
− (1)where ω = 2πf is the angular frequency, the exponent n is
a parameter related to the dispersive behavior with values
between 0 and 1.0 and Y0 is defined as a pre-exponential
factor proportional to the interfacial capacitance.39 For
n = 1, the CPE corresponds to an ideal capacitor and for n = 0.5, it corresponds to a Warburg impedance with diffusional characteristics. For 0.5 < n < 1, the CPE describes a distribution of dielectric relaxation times in
frequency space.40 It is important to point out that the fitting
procedure was limited to frequency values up to 5 kHz because the phase-shift increasing observed, which could be interpreted as an artifact given by the equipment limits in the work conditions. The electrochemical parameters calculated using the circuit in Figure 6 are presented in Table 1.
Figure 2. Metallographic characteristics of a welded carbon steel sample etched in 2% Nital solution. (a) Micrographic images obtained by SEM. Optical microscopy images of two regions corresponding to (b) weld and (c) base metal.
0 1 2 3 4 23 24 -0.55
-0.50 -0.45 -0.40 -0.35
E /
V
. SCE
vs
time / h
Figure 3. Dependence of open circuit potential on the immersion time for the () weld and () base metal and () the couple in 1.0 mmol L−1
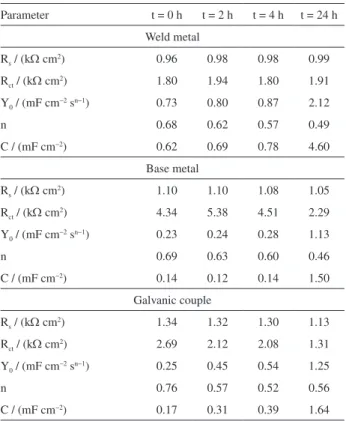
Unusually small nvalues are obtained in all cases; these small values are the consequence of a distribution of dielectric relaxation times. In this study, a simple circuit approach has been used to compare the three cases studied. Probably, the inclusion of a second CPE in the circuit could give more information, but to simplify the simulation, the simple circuit has been used. The EIS analysis reveals
-1 0 1 2
log f / Hz 3.0
3.2 3.4 3.6 3.8 4.0
(e)
(f) (d)
(c)
(b)
log |Z| / (
cm
)
Ω
2
(a)
-1 0 1 2
0 5 10 15 20 25
-Phase / °
-1 0 1 2
Figure 4. EIS measurements for the (a, b) base and (c, d) weld metals and (e, f) the couple in a 1.0 mmol L−1 NaCl solution at different times (performed
in a conventional three-electrode cell): () 0, () 2, () 4 and () 24 h.
-2 0 2 4
3.0 3.2 3.4 3.6 3.8
-2 0 2 4
0 10 20 30
log f / Hz
-Phase / °
log |Z| / (
cm
)
Ω
2
Figure 5. EIS measurements for the () weld and () base metals and () the couple, for t = 2 h, in a 1.0 mmol L−1 NaCl solution (performed in a
conventional three-electrode cell).
capacitive-resistive behavior for every electrode. Within
2 h in the chloride solution, Rct increases for the weld and
base steels due to the formation of an oxide layer on the metal. However, the oxide layer is porous and non-adherent;
consequently, the value of Rct does not continue to increase.
After 4 h in the NaCl solution, the Rct parameter begins to
decrease, and after 24 h, this parameter reaches the lowest
value for the base steel. For the welded steel, the Rct values
fluctuate over time. This behavior is not observed in the base steel, validating the higher corrosion susceptibility because the oxide layer formed on the steel briefly protects
the weld (decreasing the Rct value).
41 However, because this
layer is non-adherent, the steel is exposed to the solution until another oxide layer is formed; at this point, a decrease
in the Rct value is observed. For the coupled electrodes, a
decrease also in the Rct values is observed. Because the
couple data are the sums of the data for the two electrodes, which exhibit different behaviour (weld and base metals), this result is plausible; after 24 h, this value also decreases, similarly to the values of the separate electrodes. Previous research has also reported corrosion in the weld and the
heat-affected zone where pitting forms.29
To calculate the capacitance values, the equation
used by Mouanga et al.,42 for a similar system with the
consideration that the capacitance has a distribution along
the surface and that the resistance is uniform but not distributed, was applied:
(1 )/ 1/ 0
n n n
S
C
=
R
−Y
(2)The capacitance values present in Table 1 increase with time, which can be related to the growing presence of pores in the surface associated with the increasing degree of
heterogeneity of the surface, among other effects.43 Also,
the capacitance of the weld is always larger than that of the base metal and this difference increases after longer immersion times.
LEIS and SVET results
To choose the frequency for the LEIS line scan, spectra for the punctual impedance were collected for the base metal at a steady electrode potential (using LEIS equipment but obtained similarly to a conventional EIS spectrum) to determine the capacitive region. The value of 1 Hz was choosen, due to at this frequency a capacitive region was observed in the impedance spectra of the base metal at t = 0 in a chloride solution. The line scan analysis revealed higher admittance values for the welded steel alone (Figure 7a). Therefore, welded steel is more susceptible to corrosion not only in global EIS but also in localised EIS. When the same analysis was performed with the couple, the welded steel also presented more corrosion than the base steel (Figure 7b). There was also a larger variation in the admittance values between the first measurement (t = 0) and the others. For the electrically disconnected electrodes, no variation in the admittance values between the different times was observed. Therefore, the weld region is more susceptible to the corrosion processes in general and in localized areas.
The LEIS spectra report the corrosion behavior of the electrodes in admittance units but cannot differentiate between cathodic and anodic areas. The SVET reveals the corrosion current alongside the cathodic and anodic areas.
Based on the analyses discussed up to this point, we can conclude that the welded steel has a higher susceptibility to corrosion than the base material in a chloride solution. However, the behaviour of these two electrodes when they are coupled is the key to understanding the anodic and cathodic behavior. In this respect, SVET analysis is able to provide an answer. A mixed figure showing 2D SVET maps and microscopic images (from galvanic couple) obtained after different immersion times in a chloride solution (Figure 8) reveals anodic (the weld metal) and cathodic sides (the base metal). The maps also reveal higher anodic corrosion currents (in the weld steel electrode) when the
Table 1. Fitting parameters using the Randles circuit for the impedance measurements and calculated values of capacitance performed over different immersion periods in 1.0 mmol L−1 NaCl solution
Parameter t = 0 h t = 2 h t = 4 h t = 24 h
Weld metal
Rs / (kΩ cm2) 0.96 0.98 0.98 0.99
Rct / (kΩ cm2) 1.80 1.94 1.80 1.91
Y0 / (mF cm−2 sn−1) 0.73 0.80 0.87 2.12
n 0.68 0.62 0.57 0.49
C / (mF cm−2) 0.62 0.69 0.78 4.60
Base metal
Rs / (kΩ cm2) 1.10 1.10 1.08 1.05
Rct / (kΩ cm2) 4.34 5.38 4.51 2.29
Y0 / (mF cm
−2 sn−1) 0.23 0.24 0.28 1.13
n 0.69 0.63 0.60 0.46
C / (mF cm−2) 0.14 0.12 0.14 1.50
Galvanic couple
Rs / (kΩ cm2) 1.34 1.32 1.30 1.13
Rct / (kΩ cm2) 2.69 2.12 2.08 1.31
Y0 / (mF cm−2 sn−1) 0.25 0.45 0.54 1.25
n 0.76 0.57 0.52 0.56
measurement begins (Figure 8a) because carbon steel is very susceptible to corrosion in chloride media as it does not form a passive layer. The microscopy images reveal an orange film composed of iron hydroxides that are poorly protective on iron because this material is non-adherent.
1.0 × 10⁻⁴ 2.0 × 10⁻⁴ 3.0 × 10⁻⁴ 4.0 × 10⁻⁴
Y
/ (
cm
)
Ω
-1
-2
2 4 6 8 10 12 14
0.0
2 4 6 8 10 12 14
Base metal Resin
(a) (b)
d / mm
Weld metal
Resin Weld metal Base metal
Figure 7. Admittance lines scan be obtained at a frequency of 1.0 Hz from LEIS analysis in 1.0 mmol L−1 NaCl solution for (a) weld and base metals
individually and (b) the galvanic couple. Immersion times: (___) 0, (_ _ _) 2 and (···) 4 h.
Figure 8. Mixed figure with 2D ionic current density maps (SVET), optical microscopy images and experimental set-up of weld and base metals (galvanic couple) for different inmersion times in 0.05 mol L−1
NaCl solution (a) 0, (b) 2 and (c) 8 h.
In contrast to the weld metal, the presence of oxidation products from iron in the base metal is not observed. After 2 h in the chloride solution (Figure 8b), the anodic and cathodic currents increase, indicating the progression of corrosion (anodic reaction) in the weld metal and its complement in the base metal (cathodic reaction):
Fe(s)→ Fe
2+ (aq)+ 2e
−
(anodic reaction) O2(aq) + H2O + 4e
−→ 4OH−
(aq) (cathodic reaction)
After 8 h of immersion (Figure 8c), the corrosion product covers a larger area (in the anodic electrode); the anodic current decreases, and also the cathodic one. Therefore, the corrosion process is not complete, but the non-adherent oxide derivative of the corroded steel hinders corrosion current measurements. However, this corrosion process can be estimated from the cathodic electrode (base metal). Consequently, the thermal change in the carbon steel not only makes the weld metal more susceptible to corrosion but also makes the weld and base metals form a galvanic couple (with the weld metal as the anode and base metal as the cathode).
To analyse the anodic and cathodic currents, a graph of the corrosion current density along one line of the SVET map was plotted as shown in Figure 9, for different immersion times. The line indicates that after 2 h of immersion, the anodic current density peak reaches ca.
100 µA cm−2 and the cathodic current is approximately
−50 µA cm−2. After 4 h, the anodic current decreases to
approximately 65 µA cm−2, whereas the cathodic current
is still ca. −50 µA cm−2.
After 8 h, the anodic current reaches ca. 45 µA cm−2
and the cathodic current is ca. −34 µA cm−2, indicating that
however, the corrosion process remains incomplete because the oxide layer is no adherent.
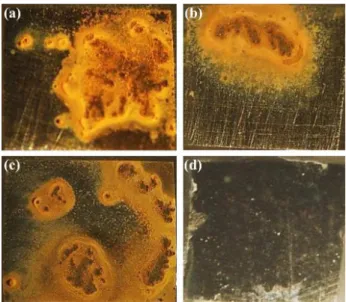
An analysis of the results obtained from the three techniques reveals that all of the findings corroborate with one another. The base metal does not present corrosion products (oxides) when the weld and base metal are electrically connected, forming a galvanic couple. If the electrodes are electrically disconnected, an oxide layer is visible on both electrodes (Figure 10).
Therefore, the obtained results indicate that the welded carbon steel is more susceptible to corrosion than the base metal. To prevent this type of corrosion, strategies may be adopted to improve the corrosion resistance and thus prevent accidents.
Conclusions
The electrochemical behaviour of welded carbon steel was studied in a chloride solution using both conventional and advanced electrochemical techniques. In the experimental setup, the weld and base metals form a galvanic couple in which the weld metal is the anode and the base metal is the cathode. Classical corrosion measurements, such as OCP and EIS, revealed that the weld metal is less noble than the base metal. The weld exhibits a lower polarisation resistance and a more cathodic potential than the base metal. The advanced corrosion measurements were performed on localised sites on the electrode. The results were presented as a map or line scan of the electrode surface, corroborating the results obtained from the classical techniques. The line scan in the LEIS indicated significant corrosion admittance in the weld metal for each electrode separately and when the electrodes were coupled. SVET data were acquired using optical microscopy simultaneously, revealing that a galvanic couple formed between the weld and base metals in which the weld functioned as the anode and the base metal as the cathode. Corrosion products in the weld metal are only observed when the weld and base metal are electrically connected.
Acknowledgments
J. F. Pagotto acknowledges the Brazilian Federal Agency for Support and Evaluation of Graduate Education (CAPES), Brazil, for providing a scholarship grant (proc. No. 6832-10-5), and F. J. Recio acknowledges the National Fund for Scientific and Technological Development (FONDECYT), Chile, for funding a postdoctoral position project (3130538).
References
1. Ul-Hamid, A.; Tawancy, H. M.; Abbas, N. M.; Eng. Failure Anal.2005, 12, 181.
2. Zhang, C.; van der Vyver, S.; Hu, X.; Lu, P.; Eng. Fract. Mech.
2011, 78, 1862.
3. Bhambri, Y.; Sikka, V. K.; Walker, L. R.; Santella, M. L.; Muralidharan, G.; Hales, J. W.; Mater. Sci. Eng., A2005, 394, 249.
4. Ramana, P. V.; Reddy, G. M.; Mohandas, T.; Gupta, A.; Mater. Design 2010, 31, 749.
5. Welding Handbook: Engineering, Costs, Quality, and Safety; Weisman, C., ed.; American Welding Society: Miami, 1984. 6. Khan, I.; Welding Science and Technology, 1st ed.; New Age
International: New Delhi, 2009.
-0.8 -0.4 0.0 0.4 0.8 1.2
-80 -40 0 40 80 120
j / (
A
cm
)
µ
-2
d / mm
Base metal
Weld metal
Figure 9. Current density values along one line in 2D SVET map for different immersion times: (___) 0, (_ _ _) 2, () 4 and () 8 h.
Figure 10. Optical microscopy images of carbon steel after 24 h in 1.0 mmol L−1 NaCl solution: (a) weld and (b) base metal electrically
7. Zhang, W.; Elmer, J. W.; DebRoy, T.; Mater. Sci. Eng., A2002, 333, 320.
8. Santos Jr, J. R.; Mattoso, L. H. C.; Motheo, A. J.; Electrochim. Acta 1998, 43, 309.
9. Moraes, S. R.; Huerta-Vilca, D.; Motheo, A. J.; Prog. Org. Coat.
2003, 48, 28.
10. Herrasti, P.; Ocón, P.; Appl. Surf. Sci. 2001, 172, 276. 11. Shi, Z.; Jia, J. X.; Atrens, A.; Corros. Sci.2012, 60, 296. 12. Pardo, A.; Merino, M. C.; Coy, A. E.; Arrabal, R.; Viejo, F.;
Matykina, E.; Corros. Sci. 2008, 50, 823.
13. Ashassi-Sorkhabi, H.; Shaabani, B.; Seifzadeh, D.; Appl. Surf. Sci. 2005, 239, 154.
14. Ebenso, E. E.; Ekpe, U. J.; Ita, B. I.; Offiong, O. E.; Ibok, U. J.; Mater. Chem. Phys. 1999, 60, 79.
15. Döner, A.; Kardaş, G.; Corros. Sci.2011, 53, 4223.
16. Hemmingsen, T.; Hovdan, H.; Sanni, P.; Aagotnes, N. O.; Electrochim. Acta 2002, 47, 3949.
17. Kallip, S.; Bastos, A. C.; Zheludkevich, M. L.; Ferreira, M. G. S.; Corros. Sci. 2010, 52, 3146.
18. de Vooys, A.; van der Weijde, H.; Prog. Org. Coat. 2011, 71, 250.
19. Local Probe Techniques for Corrosion Research; Oltra, R.; Maurece, V.; Akid, R.; Marcus, P., ed.; CRC press: Boca Raton, 2014.
20. Leiva-García, R.; Sánchez-Tovar, C. In Nano, Surface and Corrosion Science; Aliofkhazraei, M., ed.; InTech Ltd.: Janeza
Trdine, 2014, ch. 9.
21. Thornhill, R. S.; Evans, U. R.; J. Chem. Soc. 1938, 614. 22. Tester, J. W.; Isaacs, H. S.; J. Electrochem. Soc. 1975, 122,
1438.
23. Isaacs, H. S.; Corrosion 1987, 43, 594. 24. Isaacs, H. S.; Corros. Sci. 1988, 28, 547. 25. Isaacs, H. S.; Corros. Sci. 1989, 29, 313.
26. Franklin, M. J.; White, D. C.; Isaacs, H. S.; Corros. Sci. 1991, 32, 945.
27. Isaacs, H. S.; J. Electrochem. Soc. 1991, 138, 722.
28. Bayet, E.; Huet, F.; Keddam, M.; Ogle, K.; Takenouti, H.; J. Electrochem. Soc. 1997, 144, L87.
29. Zou, F.; Isaacs, H. S.; Thierry, D.; Corros. Sci. 2000, 42, 1149. 30. Battocchi, D.; He, J.; Bierwagen, G. P.; Tallman, D. E.; Corros.
Sci. 2005, 47, 1165.
31. Chaves, I. A.; Melchers, R. E.; Corros. Sci. 2011, 53, 4026. 32. Lillard, R. S.; Moran, P. J.; Isaacs, H. S.; J. Electrochem. Soc.
1992, 139, 1007.
33. Dong, C. F.; Fu, A. Q.; Li, X. G.; Cheng, Y. F.; Electrochim. Acta 2008, 54, 628.
34. Frateur, I.; Huang, V. M. W.; Orazem, M. E.; Pébère, N.; Tribollet, B.; Vivier, V.; Electrochim. Acta 2008, 53, 7386. 35. Frateur, I.; Huang, V. M. W.; Orazem, M. E.; Tribollet, B.;
Vivier, V.; J. Electrochem. Soc. 2007, 154, C719.
36. Montemor, M. F.; Ferreira, M. G. S.; Electrochim. Acta 2007, 52, 7486.
37. Díaz-Fuentes, M.; Iza-Mendia, A.; Gutiérrez, I.; Metall. Mater. Trans. A 2003, 34, 2505.
38. Frank Cheng, Y. F.; Stress Corrosion Cracking of Pipelines; Revie, R. W., ed.; John Wiley & Sons: Hoboken, 2013. 39. Neves, R. S.; Robertis, E. D.; Motheo, A. J.; Electrochim. Acta
2006, 51, 1215.
40. Martini, E. M. A.; Muller, I. I.; Corros. Sci. 2008, 42, 443. 41. Grosser, F. N.; Gonçalves, R. S.; Anti-Corros. Methods Mater.
2005, 52, 78.
42. Mouanga, M.; Puiggali, M.; Devos, O.; Electrochim. Acta2013, 106, 82.
43. Sobral, A. V. C.; Ristow-Jr., W.; Azambuja, D. S.; Costa, I.; Franco, C. V.; Corros. Sci. 2001, 43, 1019.
Submitted: September 25, 2014
Published online: February 6, 2015