M
ASTER OF
S
CIENCE IN
FINANCE
M
ASTER
’
S
F
INAL
W
ORK
PROJECT
EQUITY
RESEARCH
MOTA
ENGIL
SGPS
SA:
ECONOMIC IMPACT OF POLITICAL UNCERTAINTY IN LATAM
B
ENEDIKT
G
RUNDHEBER
M
ASTER OF
S
CIENCE IN
FINANCE
M
ASTER
’
S
F
INAL
W
ORK
PROJECT
EQUITY
RESEARCH
MOTA
ENGIL
SGPS
SA:
ECONOMIC IMPACT OF POLITICAL UNCERTAINTY IN LATAM
B
ENEDIKT
G
RUNDHEBER
S
UPERVISOR
:
VICTOR
MAURÍLIO
SILVA
BARROS
i
Abstract
This project contains a detailed evaluation of Mota-Engil SGPS SA, conducted in
accordabce with the standards of ISEG´s Master in Finance final work project. This
report was written following the guidelines and recommendations of the CFA Institute.
The choice of the company was done by the CFA Society Portugal who selected a
company from the Portuguese PSI20 Index. The characteristics of the Engineering &
Construction and Environment & Services Company Mota-Engil made this project an
interesting and valuable experience due to the company’s vast geographical and
operational diversification. The information used throughout this report was publicly
available information as at February 28, 2017. Any information or event subsequent to
this date has not been considered. The target price was obtained using an absolute
valuation method in the form of a Discounted Cash Flow (DCF) Approach,
complemented by a relative valuation method, more specifically, the method of
Comparable Multiples. The final target p
rice reached amounts to € 2.35
, representing
an upside potential of 42% f
rom the February 3, 2017 closing price of € 1.65. Our final
recommendation for ME stands at a BUY, with a high risk attribute resulting from the
high economic and political uncertainty in its major growth markets Africa and LATAM
that may be reflected in substantial Revenue volatility for the regions in the short to
medium term. With regard to the latter, LATAM, additional sensitivity analysis has been
conducted in this report to determine a possible economic impact for ME from political
and economic deterioration in the region. Such a deterioration is represented and
measured in this report by the exchange rate of the respective country where ME
operates as well as an increase in the WACC for the region through the country risk
premium. For the regional additional analysis of LATAM, emphasis is placed on MEs
main operating regions Brazil and Mexico that is projected to account for 62% of overall
LATAM turnover by 2021.
JEL classification: G10; G32; G34.
ii
Acknowledgements
First and foremost, I would like to thank my thesis and CFA Challenge 2017 advisor
and supervisor Victor Maurilio Silva Barros, professor of Finance at ISEG
–
University
of Lisbon for providing the necessary guidance to lead me through this Master Final
Work and supporting me and my team in winning this years renowned Equity
Challenge of the CFA Society Portugal. He always had his door open for me and
steered me in the right direction when a question arose. For this I am expressing a
great amout of profound gratitude. Likewise, I would like to extend a sincere thank
you to Professora Clara Raposo for putting the trust in me and providing the unique
opportunity to participate in the 2017 CFA Challenge. I have greatly benefitted from
this experience and feel a huge amount of appreciation. Last but not least I would like
thank my mother for providing continuous support and endless encouragement
throughout not only this project, but all of my academic career. Without this support
none of this would habe been possible and I am greatfully indebted to you for the
valuables lessons that you have tought me.
iii
Disclosure
A significant portion of this report was submitted by a group of students at ISEG,
including the candidate, for the CFA Institute Research Challenge 2017, Portuguese
Local final. With the wining of the Local final, the same report was submitted for the
EMEA Regional Final 2017 in Prague, Czech Republic, as a representative of the CFA
Society Portugal.
iv
Index
Abstract ... i
Acknowledgements ... ii
Disclosure ... iii
Index ... iv
List of Figures ... v
List of Tables ... vi
Research Snapshot ... 1
Business Description ... 2
Management and Corporate Governance ... 3
Industry Overview and Competitive Positioning ... 3
Investment Summary ... 7
Valuation ... 7
Financial Analysis ... 9
Investment Risks ... 9
Mota-Engil in LATAM: Political Uncertainty and Economic Impact ... 10
Appendices ... 15
v
List of Figures
Figure 1. Relative Price Performance ... 1
Figure 2. Sales per region ... 2
Figure 3. Sales per region, in €’Bn
... 2
Figure 4. EBITDA per region, in €’Bn
... 2
Figure 5. Net Debt/ EBITDA ... 2
Figure 6. Shareholder’s Structure
... 3
Figure 7. Europe
–
GDP Growth ... 3
Figure 8. Africa
–
GDP Growth ... 3
Figure 9. Africa
–
Government Debt/ Public Surplus ... 3
Figure 10. LATAM
–
GDP vs Exports ... 4
Figure 11. Europe
–
Investment in Construction YoY ... 4
Figure 12. LME Index vs Crude Oil Price ... 4
Figure 13. Africa
–
Investment in Infrastructure ... 4
Figure 14. Africa
–
Investment in Construction YoY ... 5
Figure 15. World Cement... 5
Figure 16. Portuguese Total Waste ... 5
Figure 17. Portuguese Waste Treatment (kg per capita) ... 5
Figure 18. Porter’s Five Forces
... 6
Figure 19. Major Investments in Poland in € Billion (2014
-2020)... 6
Figure 20. Oil Price vs Angola Primary Budget Deficit ... 6
Figure 21. Ranking PPP Infrastructure Landscape ... 6
Figure 22. Mota-Engil Total Enterprise Value ... 7
Figure 23. Interest Coverage Ratio ... 9
Figure 24. EBITDA and Gross Margin ... 9
Figure 25. Risk Matrix ... 9
vi
List of Tables
Table 1. ME market data ... 1
Table 2. ME target price ... 1
Table 3. ME’s WACC
... 7
Table 4. DCF Price Target ... 7
Table 5. Cost of Capital ... 8
Table 6. Multiples ... 8
Table 7. Multiples Price Target ... 8
Table 8. Investment Risks ... 9
Table 9. Sensitivity analysis ... 10
Table 10 LATAM Revenue Contribution ... 11
Table 11 Currency Volatility ... 12
Table 12 Currency Translation Impact ... 12
Mota-Engil S.G.P.S., S.A.
Engineering & Construction
,
Environment & Services
Portuguese Stock Exchange (PSI)
1
42%
Date: 03/02/2017
Current Price: EUR 1.65
Recommendation:
BUY
(42% Upside)
Ticker: MOTA.LS (Reuters)
EUR 1.000: USD 1.076
Target Price:
EUR 2.35
(USD 2.53)
High Risk
Mota-Engil: Unfazed by increased LATAM Volatility
Research Snapshot
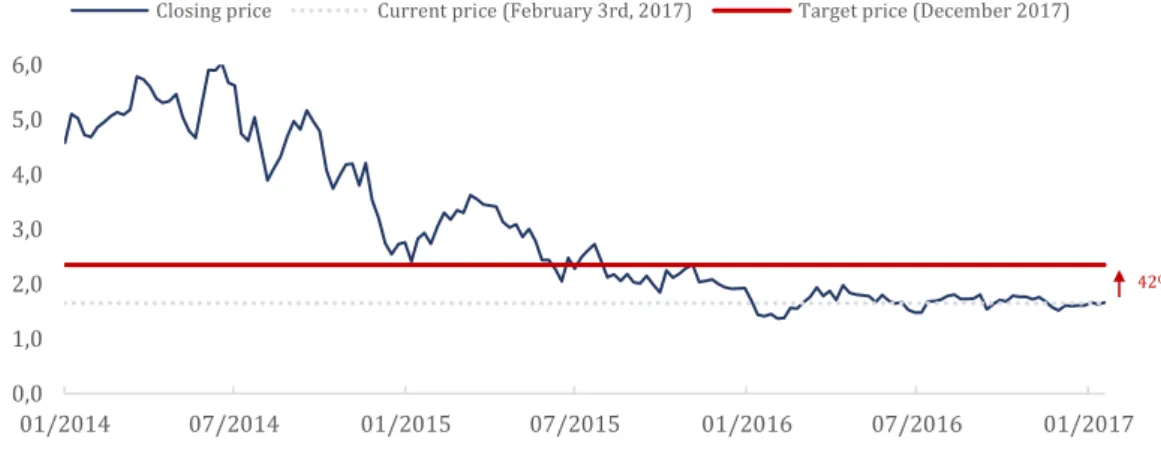
We initiate a BUY recommendation for Mota-Engil S.G.P.S., S.A (ME) with a 2017YE price target of €2.35 using a DCF model, implying a 42% upside potential from the February 3rd 2017 closing price of €1.65, although with
high risk. In a difficult market environment, ME is able to benefit from its overall strong track record and robust 21% EBITDA margins in Africa as well as resilient business performance in LATAM that are main drivers for a continuation of top line growth, increasing consistent free cash flow generation and company deleveraging. Despite increased exchange rate volatility for Mota Engils main LATAM operating markets Brazil and Mexico, where historic volatility measured on a montly average of returns for the period 2013-2017 has hit 3,79% and 2,74%, respectively, the company is on track to continue its outstanding top line growth. Additional sensitivity analysis has determined that in case of an unfavorable 20% annual movement in its main exposures, the Brazilian Real and the Mexican Peso, the recommendation would stand at a BUY, with a YE 2017 target price of €2.17.
Weathering Uncertainty in LATAM
Taking a conservative approach due to political and economic uncertainy in the region and recent exchange rate volatility, we forecast a 2017-2021 Revenue CAGR of 6.7% with a strong current €2.3 billion backlog, (35.6% 5-year CAGR) emphasizing the resistance of the company to recent industry headwinds. Expansionary activity of its waste management business in the region as well as a pending approval to increase capacity in the Mexican Energy Sector that currently contributes €35 million in Revenue and 40% in EBITDA margins provide further upside potential.
Geographical Diversification, Strong Free Cash Flow and Balance Sheet Deleveraging to Drive Stock Price Appreciation
Through 50% equity in a striking $1B deal in Tanzania, Mota-Engil continues its expansionary endeavors in Africa. The companys strong reputation has facilitated its ability to diversify geographically and more than justifies the projected 2,2% 2017-2021 Revenue CAGR. Domestically, ME has placed a major emphasis on the higher margin waste treatment sector where the recent acquisition of EGF is expected to contribute €43 million in FCFF by 2021, representing 23% of MEs total. Furthermore, the company will continue to divest of non core assets leading to a net debt reduction to €625 million by 2021, while doubling its interest coverage ratio to 3.3 through a combined effect of a 7.5% 2016-2021 EBIT CAGR and lower financial expenses.
Paving the Way Despite LATAM Exchage Rate Volatility
With 43% of MEs overall turnover expected to come from LATAM by 2021, the company finds itself vulnerable to unfavorable exchange rate moves. Despite this exposure and a high monthly 5-year SD of returns for the major currencies BRL and MXN of 3,79% and 2,74%, respectively, sensitivity analysis has determined a BUY rating target price €2,17 for an annual 20% drop in both rates. Bolstering my analysis, sensitivity for an increase in LATAM country risk premium by 500 Bps has yielded a target price of €2,14, ceteris paribus.
0,0 1,0 2,0 3,0 4,0 5,0 6,0
01/2014 07/2014 01/2015 07/2015 01/2016 07/2016 01/2017
Closing price Current price (February 3rd, 2017) Target price (December 2017) Table 1. ME market data
Market Profile
Closing Price € 1.65 52-Week Price
Range € 1.30 –€ 2.05 Average Daily
Volume 226,828 Shares
outstanding 233.87M Market Cap 391.65M
P/E (ntm) 4.8 Source: Reuters
Table 2. ME target price
Valuation 2017 Target Price
DCF € 2.35
Multiples
(average) € 2.15 DCF LATAM
VOLATILITY € 2.17
EV/EBITDA € 2.70 EV/SALES € 1.59 Source: Estimates
Figure 1. Relative Price Performance
*ISE – Global Construction index **SXOP – European Construction Index
Source: Reuters, Estimates 0%
50% 100% 150%
2014 2014 2015 2016
ISE Mota
2
Business Description
Mota-Engil SGPS (ME, Reuters: MOTA.LS) is a Portuguese internationally diversified Conglomerate focused on the two core business areas Engineering & Construction (E&C) and Environmental & Services (E&S). Additionally, ME has a presence in the areas of Energy and Mining as well as transport concessions where it operates mainly through strategic partnerships in form of equity participations. The multinational group ME divides its operations into four segments, namely Europe E&C, Europe E&S, Africa and LATAM with predominant presence of the two main segments in all three regions, complemented mainly by Mining and Energy activities in Africa and LATAM. The area of E&S includes the increasingly significant business of waste collection and treatment that showed major 2015 yoy growth in revenues of 110% to €173 million in Europe with total turnover contribution of 17.3% and growth potential through expansion into the African and LATAM markets.
The company was founded in 2000, resulting from the business combination of Mota & Companhia (M&C) and Engil SGPS in late 1999, and later became market leader in the Portuguese construction sector. Prior to the merger, M&C had operations exclusively in Angola before expanding its operations to Sub Saharan Africa in 1974 and Portugal shortly thereafter. Engil originated in Lisbon after its incorporation in Portugal in 1952 and a first entrance into the LATAM market in 1978 before both, M&C and Engil concretized LATAM’s expansion plans through acquisitions in Peru in 1998.
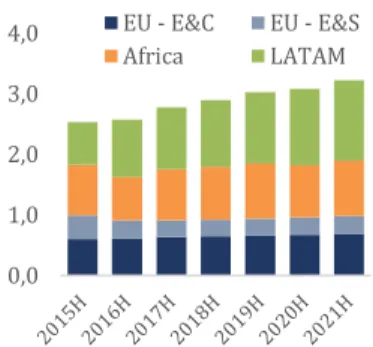
Contemporarily, with substantial businesses in Europe, Africa and LATAM, the group is managing a geographically diversified portfolio with offices in 22 countries and controlling interest in 294 companies. Expected 2016F revenue in each of the three geographies accounted for roughly one-third of overall company turnover of €2.487 billion with expected EBITDA contributions in 2016 of 29.1% for the European Market and 52.7% and 18.2% for Africa and LATAM, respectively.
With respect to the European business, the company has recently made a strategic move with the acquisition of EGF, which has a 68% market share in waste treatment in Portugal and is vertically integrated with SUMA, ME’s waste collection business, where it leads the market with a 53% share of the 37% privatized market. The strategy implementation resulted from European lackluster top line growth in its E&C business with a 2011-2015 CAGR of -12,8% that is partially offset by a turnover CAGR of 18.1% in E&S. It further positively affected profitability with a more than 600bps 2015 yoy EBIT margin increase following the company’s consolidation. ME is highly exposed to government spending on construction in Portugal and Poland for the E&C area, while EU targets for waste management yield a positive outlook for ME’s E&S business.
ME`s presence in the Africa region is predominately shaped by government infrastructure and construction projects with expansion potential through the EGF integration, as well as mining deals with multinational private companies Vale and Rio Tinto. EBITDA margins in the Africa region remain robust at a 22% average for the 2011-2015 period, while uncertainties in the region have caused a 2015 yoy decline in turnover of 21.4% with a further expected decline of 14.6% in 2016. While Angola remains the major turnover contributor in the region, steady expansionary progress is resulting in a more equally diversified distribution to other ME oprating regions in Africa.
LATAM has been ME`s driving force in terms of turnover contribution with a 2011-2015 revenue CAGR of 49% and a substantial relative 3-year backlog CAGR of 11%. While development in the main markets Peru and Brazil confirmed this trend, Mexico is expected to account for 43.8% of overall 2016 turnover of €416.6 million. Despite current geopolitical uncertainties in North and South America, strong demand for E&C and for energy production should provide stability to ME’s yoy growth in the region. The recent entrance in the Energy sector is expected to generate Revenues around €35 million annually and shows a substantial 40% EBITDA margin.
Company Strategies
• Deleveraging – ME intends to decrease its financial leverage that currently contributes to a Net Debt/EBITDA of 3.4x as of 2016 year end as well as an interest coverage ratio of 1.2. In order to relieve financial distress and diversify funding sources, the company has laid out plans to divest non-core assets and increase CF through higher margin projects and Capex and Working Capital optimization.
• Diversified Geographic Exposure– The Group aims at limiting the impact of single volatile economic regions and promote maintainability of current regional balances that account for approximately one-third of 2016F turnover each.
• Europe –ME focuses on maintaining a leadership position in the Portuguese construction sector while increasing the mobility of its resources to facilitate internationalization of its know-how in case of economic downturn in Portugal. Additionally, in the area of E&S, the company plans to explore expansion opportunities for its waste business in and out of Europe through know how and business synergies.
• Africa – In addition to government infrastructure projects, the company aims at further bolstering its established partnerships with large multinational private companies. With decades of experience, ME will maintain their competitive position in the SADC* region, accounting for 54% of 2015 Africa turnover. Figure 2. Sales per region
Source: Estimates 23,9 % 11,6% 27,7 % 36,9 %
Europe - E&C Europe - E&S
Africa Latin America
Figure 3. Sales per region, in €’Bn
Source: Estimates 0,0
1,0 2,0 3,0
4,0 EU - E&C EU - E&S
Africa LATAM
Figure 4. EBITDA per region, in €’Bn
Source: Estimates 0,0 0,1 0,2 0,3 0,4 0,5
0,6 EU - E&C EU - E&S
Africa LATAM
Figure 5. Net Debt/ EBITDA
Source: Estimates
3,3 1,4 0,0 1,0 2,0 3,0 4,0 0 400.000 800.000 1.200.000 1.600.000
3 • LATAM - With focus on the existing markets in Latin America, ME intends to target projects mainly in the businesses of transportation and mining infrastructure, as well as continue its diversification process through the waste business and growth potential in the Energy sector, primarily in Mexico.
Shareholder Structure
ME is a family owned and managed company with total voting rights of 63.14%. ME’s family members have 7.42% directly and through Mota Gestão e Participações, SGPS, S.A., which they fully control, the family owns an adittional 55.84% of the company. Two other major institutional investors are Amber Capital and Invesco with a total control of 3.87% and 1.73%, respectively. 31.14% of the shares outstanding is free float.
Management and Corporate Governance
The company follows a Latin/Classic governance model composed of a Board of Directors, a Statutory Audit Board and a Statutory Auditor that is not a member of the Statutory Audit as it is described below:
• Board of Directors (BoD) - is determined by the annual general meeting and is composed of 17 members (7 executive participants that embody the Executive Committee). In the mandate of 2014-2017, only 3 members are independent. The BoD is responsible for the company’s administrative issues. In addition, the Board formed the Investment, Audit and Risk Committee (see Appendix 15).
• Supervisory Board - is designated by the Statutory Audit Board and composed of four members: one president, two regular members and one substitute member. This board is responsible for ensuring the compliance with laws and regulations as well as the policies adopted by the company statutes.
• Statutory Auditor not a member of the Statutory Audit– This body is directed by António Magalhães & Carlos Santos, SROC, responsible for supervising and monitoring ME’s accounts. Since 2002, the External Auditor is Deloitte & Associados, SROC, S.A.
From the forty recommendations of appropriate corporate governance put forth by the CMVM (The Portuguese Securities Exchange Commission), ME merely fulfills twenty-seven. While the company fails to comply with six of them, the remaining seven are not applicable. The dependence of the BoD and the Remuneration Committee and also the remuneration policy is among the governance risks that ME faces. (see Error! Reference source not found.).
Given the nature of the shareholder structure and a strong family influence on the Board of Directors, minority shareholders’ interests are not fully protected, allowing the family to implement ideas or changes according to their needs without further impediment. The BoD has few independent members, resulting in the possibility of misjudgment and biased decision making.
Social Responsibility
Operating in different business areas and regions around the world, ME contributes to the global environmental landscape and assumes responsibility in making a positive impact on environmental development . In order to implement measures of social responsibility, the Foundation Manuel António da Mota (FMAM) was created in late 2009 as a key mechanism with the purpose of encouraging activities of cultural and social scope. The Foundation is present in a majority of ME’s operating countries, sponsoring events of charity in areas such as health and education with special emphasis on Africa and LATAM regions. The foundation also attributes an honorary gesture called “Manuel António da Mota Award” to associations and personalities that have made a significant impact and difference in their regions or communities.
Industry Overview and Competitive Positioning
Regional Economic Focus
European GDP Stabilization
The EU’s economy has shown steady improvement with CAGR of 1.14% for the period 2013-2015, following the recessionary levels it reached during the financial crisis. For the period 2016F-2021F this trend is expected to continue with a forecasted CAGR of 1.86%. While Portugal is in line with this tendency at a marginally slower pace of 1.21% for the forecasted period, Poland has been outperforming its peers by an annual 160 bps and it is expected to continue to do so with CAGR of 3.52% until 2021 (see Figure 7).
Economic Volatility in Africa
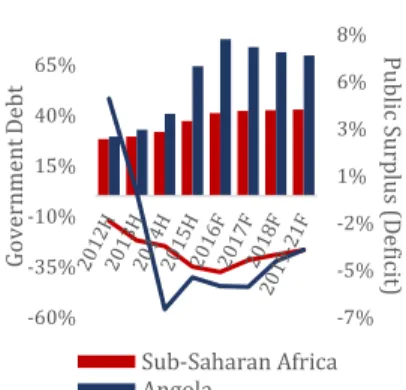
Economic performance in the Sub Saharan region has been declining with expected real GDP growth in 2016 of 1.43%, down more than 3.5 pp from 2014 levels. For Angola and the SADC* economies, both follow this trend with an average annual decrease for the 2014-2016F period of 95 and 227 bps, respectively. According to IMF forecasts, Africa will experience a modest recovery with annual growth rates expected around 3.8% for the 2017-2021 period. Sub Saharan total government expenditures as a percentage of revenue have seen an increasing trend, registering a maximum value of 126% in 2015, up significantly from 105% in 2011. The Figure 7. Europe – GDP Growth
Source: IMF -5% 0% 5% Poland Portugal EU
Figure 8. Africa – GDP Growth
Source: IMF and Estimates 0% 2% 4% 6% 8% Angola Sub-Saharan Africa SADC*
Figure 6. Shareholder’s Structure
Source: Estimates
31,14 % 3,87% 1,73% 55,84 % 7,42% Free Float Amber Capital Invesco Mota G&P
Board Members (family)
Figure 9. Africa – Government Debt/ Public Surplus
Source: IMF
4 reasons for this development is two-fold, with decreasing revenue for export dependent countries in a commodity down cycle as well as governments’ attempt to honor planned infrastructure investment. LATAM GDP recovery
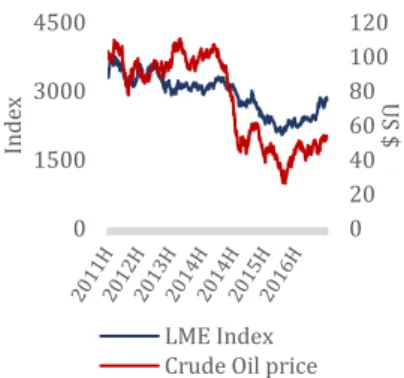
After a global setback caused by the financial crisis and in real GDP contraction of 1.8% in LATAM and the Caribbean, economic conditions in the region quickly regained traction with an average 2010-2013 real GDP growth of 4.2% (IMF). Fueled by a sharp decline in commodity prices in 2014 and a subsequent 180 bps average decline in overall government revenue for the 2014-2016F period compared to the prior three years, real GDP reverted into negative territory in 2015 with a further FMI forecast for 2016 of -0.5%. Spurred by the recent stabilization of oil and major metal prices (see Figure 12) and a consequent forecasted upswing in LATAM overall export volume with a 2016-2021 average growth of 4.5%, real GDP is expected to recover at average levels of 2.3% for the 2017-2021 period (IMF).
With respect to ME’s main markets, Brazil has been suffering economically due to political turmoil and commodity price pressure. Infrastructure construction volume declined by 7.6% in 2015. However, according to IMF, positive growth in real GDP of 0.5% will be reached in 2017 along with a return of growth in the construction sector of 1.2% (BMI). Regarding Mexico, growth prospects remain lackluster with steady 2016-2021 CAGR of 2.6% (IMF) that are subject to volatility given the country’s export dependence on the US (72.7% in 2015 according to OEC), where increasing political and economic uncertainty arose after the US 2016 election. At average rates of 2.9% during the same period, BMI expects Infrastructure construction growth to be in line with overall economic performance.
Regional Construction Industry Overview
Europe - Funding as a Key Determinant to Industry Growth
After the major shrinkage of the global construction industry in 2008, investment in construction in the EU has been recovering. 2015 saw an annual growth of about 2%, which is expected to continue in 2016 and accelerate modestly in 2017 to 3.1% (see Figure 11). Project financing is a key element to consider when looking for this development. The investment plans for Europe together with an increasing popularity of public-private partnership (PPP), that is expected to play a crucial role once current EU funding draws down in 2020, are detrimental components in the shaping of the EU infrastructure landscape.
Europe - EU Funds as a key driver for Polish Infrastructure Construction
The Polish infrastructure construction sector will be reliant on the macroeconomic situation and depend on infrastructure investments financed by EU funds under the new 2014-2020 program, mostly through PPP. Poland is the biggest EU fund beneficiary among all the member states and expects to receive €82.5 billion from the 2014-2020 EU budget plan under the cohesion policy. Nevertheless, the recent decision of the UK to leave the EU may reduce the availability of EU funds, which suggests a more conservative approach.
Europe - Demand for the Portuguese Construction Sector
To alleviate the depression of the country’s infrastructure investment, the Portuguese government introduced the Strategic Plan for Transport and Infrastructure for 2014-2020 (PETI3+). The government intends to invest around €6.7 billion, of which 44% are attributable to the railway sector and a further 15% to roads. As the Portuguese government still faces budgetary restraints, there is a continued need for alternative funding sources that amount to 80%, 60% of which is coming from EU funds and 20% from private investment. Africa - Commodity Down Cycle Affecting Industry Demand
Sub Saharan governments substantial reliance on commodity prices has been instrumental in the countries’ restraints on government budgets and the consequent deterioration of economic activity. Oil price contraction started in mid-2014 with a sharp decline from around 100 US$/barrel, bottoming at $26/barrel in early 2016, while major metals and other commodities also performed poorly (see Figure 12). Lower demand from major commodity importing countries, mainly China, has contributed to this commodity down cycle as well as OPEC’s strategy on oil inventories. The November OPEC agreement to cut daily output by 1.2 million barrels may prove a relieve to some African governments. In 2014, 99% of China’s imports from Angola were of Crude Oil. However, since 2013, China’s imports have been decreasing, registering a significant 49% yoy drop in 2015. As a consequence of the resource dependence, most Sub Saharan governments have been forced to tighten their budgets in order to keep current accounts in check and avoid unsustainable indebtedness.
Africa - Construction Industry Outlook
Africa is a continent under demographic change and is considered one of the fastest-urbanizing regions, heavily relying on the governments’ investments in national infrastructure. With the expected commodity price stabilization, BMI’s prospects for the African Construction Industry seem mildly optimistic at forecasted 2017-2020 annual yoy growth rates between 2-10% for ME’s operating countries with Rwanda, Uganda, Zambia and Mozambique showing above average contribution at average annual rates of 7%. Improvement in forecasted infrastructure investment is mainly due to an increase in export volume with expectation for SSA to post 2017-2021 CAGR of 4.7% compared to 1.6% for the preceding 5 years. For African overall infrastructure spending, projected 2017-2020 CAGR is expected at 6.1%, down 220 Bps from 2012-2016 levels (PWC). With respect to transport infrastructure demand, ME’s main activity, it is expected a slowdown from previous rates to a 2017-2020 CAGR of 5.2% while demand for utility infrastructure is expected to remain stable at a CAGR of 7% and a mining extraction infrastructure rise of 320 bps to a CAGR of 7.8% for the same period.
Figure 10. LATAM – GDP vs Exports
Source: IMF
0% 2% 4% 6% -1% 0% 1% 2% 3% 4%
change in GDP change in Exports
Figure 12. LME Index vs Crude Oil Price
Source: Thomson, Bloomberg 0 20 40 60 80 100 120 0 1500 3000 4500 U S $ In dex LME Index Crude Oil price
Figure 13. Africa – Investment in Infrastructure
Source: PwC
0% 1% 2% 3% 4% 5% 6% 0 50000 100000 Infrastructure Spending % of GDP
Figure 11. Europe – Investment in Construction YoY
5
Africa’s Problems - Mota-Engil’s Opportunities
According to 2010 World Bank projections, for Africa to close its infrastructure gap and keep up with the pace of urbanization, it would need to invest $93 billion annually until 2020. Data estimates of PWC suggest that this value will be reached for the first time in 2019 at annual investment of $95 billion. In 2015, infrastructure investment recorded for ME’s operating regions in East, West and Southern Africa amounted to $193, $152 and $27.6 billion, respectively, increasing from the prior year by an average 50% (ICA). Also, as a result of an increase in PPP, there was a 155% growth in the private sector participation to a total of $7.4billion, in 2016. LATAM - Impact of budget deficits on Government Expenditure
Being one of the major economic and construction infrastructure drivers, public spending can spur economic growth and significantly influence the development of infrastructure gaps. According to the IMF, average expected annual government spending growth adjusted for inflation in Mexico and Brazil for the period 2017-2021 is 1.7% and 1.1%, respectively. The existing tradeoff between Government expenditure and favorable budget deficit development in times of economic distress is at the forefront of policy decision in the LATAM region. Estimates by the World Bank suggest state capital expenditures around 5% of GDP in order to grow sustainably and close infrastructure gaps. In anticipation of lower expenditures, Brazil is looking to reverse its primary deficit to a surplus by 2020 and achieve a 350Bps improvement by 2021 over the deficit of 1.9% in 2015 and an average surplus of 1.3% for the 2016-2021 period. According to IMF data, Mexico incurred primary net borrowing of 1.3% in 2015 with a 240Bps improvement expected by 2021 and an average 2017-2021 budget surplus of 1% of GDP. The quandary that governments find themselves in to increase government spending on infrastructure in times of budgetary limitations calls for increasing reliance on private companies to contribute to infrastructure investment (see Error! Reference source not found.).
LATAM - Attention on China Acceleration for Continuation of Growth
Amidst sharp commodity price contraction in 2014 following weakness in demand from China, major LATAM trading partners suffered a significant setback to their revenues with Brazil, Peru (both 18% exports to China) and Colombia (10%) registering changes of -0.5%, -4.3% and 0.7%, respectively for the year 2015 (OEC, IMF). Stalling development from the world’s economic locomotive has increasingly dampened optimistic growth prospects for LATAM that show a connection to the regions ability to realize proposed infrastructure spending plans. As estimates by PWC reveal, a possible hard landing in China could negatively affect annual infrastructure investment by an average 5% annually for the 2017-2020 period in terms of both transport and overall investment. Monitoring economic development in China will be detrimental for a recovery in commodity prices as well as the ability for LATAM governments to honor budgeted infrastructure investment. A Supply Side Perspective
As construction companies rely heavily on a number of Input Materials, it is important to observe the historical development of these costs and put in perspective the relevance of price volatility with respect to project profitability. Regarding infrastructure focused companies, major raw materials include iron ore which is the main component in the manufacturing of steel as well as heated crude oil residuals that are used to manufacture Bitumen to asphalt roads. In addition to Input Materials, labor costs constitute a substantial part of overall costs with ME Labor Cost/Sales margins stable around 20% for the 2013-2015 period while Input Prices show little variance accounting for approximately 15-17% of Sales during the same period. The reason for this consistency lies in the idea that companies are able to pass on higher input prices to consumers. As a consequence, Building Construction Input and Output variables have been moving in tandem for the 2010-2015 period. A concept referred to as Project Escalation Formula diminishes project volatility by contractually agreeing on compensation methods in case of sudden material Input Cost variation. ME has adopted these practices for medium and large size duration projects to prevent unexpected cost overruns due to external factors. Environment & Services – Benefitting from Increasing Environmental Sustainability
According to Eurostat, each EU citizen currently produces half a ton of Municipal Solid Waste (MSW). In 2013, the Portuguese population produced 4.6 million tones of such waste, representing a decrease of 15.7% from 2010. Starting in 2014, household waste production has reverted, representing an increase of 3.6% from 2013 until 2015.
Even though, in Portugal, landfilling is still the primary option in waste treatment, accounting for almost 60% of all MSW collected until 2010, there has been a decreasing trend in recent years, with a shift in the industry for better, more sustainable, alternatives such as incinerating, composting and recycling (see Figure 17). The targets set forth in European legislation have been key drivers in improving waste management, stimulating recycling innovation, limiting the use of landfill, and creating incentives to change consumer behavior. In 2015, Portugal total 10.4M inhabitants’ MSW was reduced to an average of 440 kg/capita, from 516 kg/capita in 2010, of which 50% was landfilled, 26% composted and recycled and 24% incinerated, compared to 62%, 31% and 19%, respectively, in 2010. Regardless of recent improvements, Portugal has a long “road” ahead to achieve the values of 26% for landfill, 47% for composting and recycling and 28% for incinerating as targeted by the EU-27.
The performance of MSW management in Portugal is still influenced by factors that resulted from the financial crisis, the indebtedness of the Portuguese Government and subsequent cuts in public spending. However, it has been slowly improving in recent years, mainly due to national and international legislation like implemented National Waste Management Plans (PERSU). Through community financing, it is expected an investment of €306M for the 2014-2020 period to help reduce waste production to 409 kg/capita, diminish waste landfill by Figure 17. Portuguese Waste
Treatment (kg per capita)
Source: EuroStat
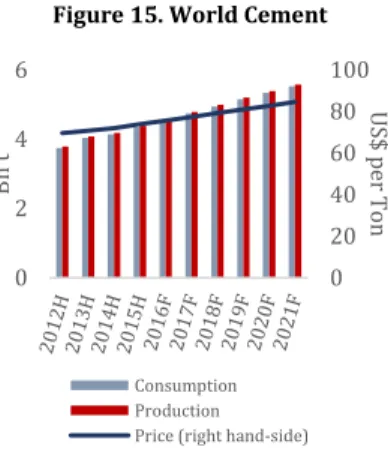
0 100 200 300 400 500 600 Recycled Composting Incinerated Landfill Figure 15. World Cement
Source:CemNet; The Freedonia Group and Team estimates
0 20 40 60 80 100 0 2 4 6 U S $ p e r T o n Bn t Consumption Production Price (right hand-side)
Figure 14. Africa – Investment in Construction YoY
Source: BMI and Estimates 0% 3% 6% 9% Angola Mozambique Uganda
Figure 16. Portuguese Total Waste
Source: EuroStat
4 4,2 4,4 4,6 4,8 5 5,2 5,4 5,6 400 420 440 460 480 500 520 540
Per Capita (kg)
6 20% and facilitate a 53% increase in selective waste collection in order to meet an annual recycling rate of 47 kg/capita by 2020.
Competitive Positioning
Integral Value Chain
Having multiple subsidiaries in the regions it operates in, ME has been successful in vertically integrating some businesses to fully benefit from a complete value chain. On the material input and supply side, the company controls prestressed goods manufacturers (Prefal), steel producers (Martinox) as well as companies operating in the construction equipment rental business (Rentaco). The existence of the subsidiaries gives ME an edge, especially over some foreign competitors, with regard to logistics and infrastructure equipment mobility. Robust Local Partnerships with Strong Track Record
ME faces severe competition in an African and LATAM market that shows strong fragmentation as local companies strive to increase market share and foreign businesses turn to emerging markets for lucrative business expansion. Strong, trustworthy partnerships in both Africa in form of collaborations with Brazilian Vale and Rio Tinto and LATAM through construction sector partnerships like Bonsucesso in Brazil and Prodi in Mexico provide strategic perspective to the company that sets it apart from its competition. With regard to Africa, ME benefits from its vast experience with roots in Angola that have earned it a strong local reputation. With respect to its home market, ME is an Infrastructure flagship leading a stagnating market in terms of market share and profitability, with an average 2012-2015 EBITDA margin of 7.75%.
Europe - Leveraging on Infrastructure Expertise in Poland and Home Market Dominance
Leading the Portuguese market with steady profitability, ME’s competition has seen dwindling margins following the recent economic recession. In addition to Portugal, ME has positioned itself in other European Markets, mainly Poland, where the heavily fragmented construction sector is characterized by fierce competition in tenders, suppressing margins in the short to medium term to around 4.5%, about 190 bps below that of its peers. ME is among the 15 largest infrastructure companies in Poland and is favorably positioned to continue strong execution relating to its main subsectors Road and Railway Infrastructure that account for about 75% of total Central Europe Revenue.
Africa – Strategic Diversification in a Difficult Environment
Although in terms of top line development, ME has suffered a 2015 yoy contraction of 20% compared to its competitors in the region, with an average decline of 2.3% for the same year, it outperformed its peers in terms of profitability with 2012-2015 average EBITDA margins of 20% vs. 7% for its main competitors. With over 7 decades of experience that solidly positioned the company in the African Infrastructure sector, ME may have a good understanding of industry dynamics that will increase awareness to diversify its focus on government collaboration as well as strategic deals with private multinational companies. A regional reputation for quality resulted in a strong track record that saw an increased interest in collaboration from Vale with a project awarded in 2015 totalling $700 million for a duration of 27 months with a further $95 million project in Mozambique that started shortly thereafter. In anticipation of further commodity price stabilization, the company was awarded government road and railway projects amounting to U$420 million in the countries of Angola, Malawi and Mozambique. Bearing in mind increasingly fierce competition from China, that includes a high level of funding availability and excessive price competition, ME’s broad client base and quality standards may provide a competitive edge if market conditions normalize further.
LATAM - International Know-How and Local Partnerships to Prevail
ME is playing an increasingly important role in shaping the LATAM Infrastructure. Above average growth numbers in the region bolster this trend that has seen exceptional average annual revenue growth of 31% for the 2013-2016F period that dwarf overall Infrastructure investment growth for the region of 5% (PWC) with total 2016 investment of $278Bn. Transportation Infrastructure investment for the region showed annual average growth of 15% during the same period. The company’s predominant focus on Transportation Infrastructure will be a beneficiary factor for growth with a total investment of $386Bn in 2020 (PWC), steadily improving from previous 13% in 2012 when total investment amounted to $229Bn. ME’s strategy to focus on its current main markets, namely Mexico, Brazil, Peru and Colombia, that are among the 5 countries with most favorable conditions for PPP’s, is an advantage in times of uncertainty related to governments’ ability to stem infrastructure investments single handedly. On a relative Basis, Mota-Engil is outperforming 8 of its 9 main publicly listed peers in the region in terms of revenue growth that amounts to an average 3-year rate of 12% compared to Mota-Engil’s 29% (see Appendix 17 for list). While advantageous partnerships through equity participations in local companies, such as Bonsucesso in Brazil and Prodi in Mexico, in combination with international know-how have facilitated positive top line trends, ME has shown relative inferior performance with respect to EBITDA margins that, at a 2012-2105 average of 9%, fall short of its regional competitors. As EBITDA margins for the 2 larger players in the industry, ICA and Grana y Montero, show a 240 Bps premium to that of ME, the company is well positioned to benefit from further top line growth in terms of margin improvements.
Environment & Services – Limited Growth Prospect in Home Market
In Portugal, through SUMA, ME is a market leader in the waste collection industry, maintaining 53% of the 35% privatized sector and serving 2.2 million inhabitants. During recent years, with the acquisition and vertical Figure 18. Porter’s Five Forces
Source: Estimates
0 1 2 3 4 Competition within the Industry Threat of new entrants Threat of Substitutes Bargaining Power of Buyers Bargaining Power of Suppliers
Engineering and Construction Environment and Services
Figure 21. Ranking PPP Infrastructure Landscape
Source: World Bank
0 50 100
Colombia Mexico Peru Brazil Chile
Figure 19. Major Investments in Poland
in € Billion (2014-2020)
Source: Deloitte
41,1 16,2 23,1 Road construction Railway construction Energy construction
Figure 20. Oil Price vs Angola Primary Budget Deficit
Source: IMF and World Bank $70 0,4% -6% -4% -2% 0% 2% 0 100 200 Oil Price
7 integration of EGF, ME has further positioned itself as the market leader in the entire value chain of waste management, providing waste treatment for almost 6.4 million inhabitants, representing 66% of the whole market, according to the Portuguese Environmental Agency (APA).
The waste collection market in Portugal has small room to grow. It is fragmented between mucipalities and private companies, where the level of privatization is still low (37%) when compared to countries such as Spain (80%). Also, according to the IMF, the estimation for population growth is only 0.36%, from 2016 to 2021. As a consequence of domestic market saturation, ME will increase its effort to expand its expertise internationally.
Investment Summary
Our recommendation for ME stands at BUY, with a 2017 YE target price of € 2.35, representing a 42% upside potential to the company’s stock price of € 1,65 at Feb 3rd, 2017, but with high risk. We attribute the company’s
undervaluation to excessive investor pessimism regarding its EM exposure and leverage that is fundamentally unjustified with an average forecasted 2017-2021 CAGR of 4.4% for its Emerging Markets business segments and a gross debt reduction of 27% for the 2015-2017 period to € 1.4 Bn.
With respect to Mota-Engil’s core business, the company is market leader in a mostly saturated Portuguese market that is expected to show little revenue and margin variation and a highly fragmented Polish construction sector that is expected to see a 2017-2021 Revenue CAGR of 3.4%. Volatility reduction in Africa as a result of commodity price stabilization will be a major determinant of Revenue development in the region that is expected to grow at a 5 year CAGR of 6.5%. To limit dependence on individual economic regions in Africa, ME looks for geographic diversification that was recently facilitated through an awarded project in Tanzania worth about € 510 million. Business in LATAM is plagued by high political and economic uncertainy that jeopardizes planned infrastructure investments in ME’s main markets Mexico and Brasil, forecasted to see top line CAGR of 4,4% and 11,1%, respectively that will be subject to currency translation.
Through vertical integration of Suma and EGF in the Portuguese Waste Management business, ME is increasing its operational diversification with a modest forecasted CAGR of 1.8% for the following 5 year period with profitability expected to increase 525 Bps as a result of the integration to an average EBITDA Margin of 30%. Due to environmental objectives to reduce less profitable and unsustainable Waste treatment processes, the company might further increase profitability margins in the future. Being well established in its external markets, ME will seek opportunities to expand its expertise in Waste Management and create synergies through its two subsidiaries EGF and SUMA abroad.
Substantial Cash Flow Generation to Calm Creditors and Reward Shareholders
Given Mota’s decreasing level of leverage the company is moving closer to a capital structure that will please both, creditors as well as shareholders as free cash flow over the forecasted period shows robustness and consistency that allows the company to alieviate risk arising from unsustainable debt levels and guarantee a continuation of its dividend payout policy.
Valuation Methods
We obtain our target price using Discounted Cash Flow (DCF) valuation and consider the free cash flow to the firm (FCFF) methodology. To derive ME’s intrinsic value, we valued through a SoP approach the segments Europe E&C, Europe E&S, Africa and LATAM, subtract net debt from the determined Enterprise Value, and make the necessary adjustments to equity to account for items previously not considered. As a complementary method, we value ME’s equity using Multiple Valuation through EV/SALES and EV/EBITDA, obtaining an average price target of € 2.14 € in line with our DCF 2017YE valuation of€2.35.
Investment Risks
Investors must be aware of the impact of commodity prices and an increase in LATAM forex volatility that might indirectly affect ME’s ability to generate cash. Increasing importance and reliance on Revenue generation in LATAM entail the risk of overly negatively impacting profitability as a result of regional misbalances. On the other hand, on the operational and demand side, ME’s unsustainable leverage might limit investors’ desire to invest. Additionally, a sterk dependence on public infrastructure investment in times of severe budgetary constraints highlights Mota-Engil’s reliance on external factors to grow its core business in its external markets.
Valuation
Free Cash Flow to the Firm: A Sum of Parts Approach (SoP)
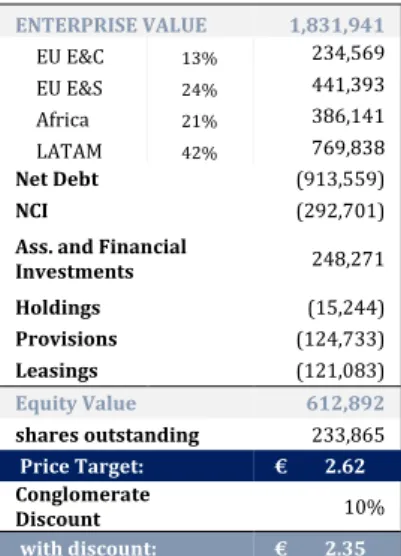
We value ME using a Discounted Cash Flow to the Firm (DCF) approach where we determine the Enterprise Value (EV) of the company and adjust it for Net Debt and other items in order to arrive at a final equity value. The unique characteristics of the company’s four operational segments enabled us to use a SoP approach for valuation, estimating a price target of €2.35 per common share for 2017YE.
We follow the same valuation technique for the respective operational segments, applying a two-stage growth model that considers detailed annual FCFF forecasts for the 2017-2021 period and assumes a constant growth Table 3. ME’s WACC
EU - Engineering and Construction
2017F Terminal
Weight of Equity 44.24% 60.00% Weight of Debt 55.76% 40.00%
WACC 9.2% 10.8%
EU - Environment and Services
2017F Terminal
Weight of Equity 44.24% 60.00% Weight of Debt 55.76% 40.00%
WACC 8.9% 10.4%
Africa
2017F Terminal
Weight of Equity 44.24% 60.00% Weight of Debt 55.76% 40.00%
WACC 13.0% 15.9%
LATAM
2017F Terminal
Weight of Equity 44.24% 60.00% Weight of Debt 55.76% 40.00%
WACC 10.8% 12.9%
Source: Estimates
Table 4. DCF Price Target
ENTERPRISE VALUE 1,831,941
EU E&C 13% 234,569
EU E&S 24% 441,393
Africa 21% 386,141
LATAM 42% 769,838
Net Debt (913,559)
NCI (292,701)
Ass. and Financial
Investments 248,271 Holdings (15,244)
Provisions (124,733)
Leasings (121,083)
Equity Value 612,892
shares outstanding 233,865
Price Target: € 2.62
Conglomerate
Discount 10%
with discount: € 2.35
Source: Estimates
Figure 22. Mota-Engil Total Enterprise Value
Source: Estimates
12,8 % 24,1 % 21,1 % 42,0 %
Europe E&C Europe E&S
8 rate for the perpetual period. Total EV is reached by summing the DCFs of each segment discounted by their respective Weighted Average Cost of Capital (WACC), which is subject to annual variation for each of the operating segments due to changes in Capital Structure. The main assumptions inherent in our FCFF relate to forecasting Revenue for each segment, determine appropriate future EBITDA margins and estimate Changes in NWC and Net CAPEX developments.
Engineering & Construction Business
Top line developments of the European Segment of Engineering and Construction is forecasted showing historic correlation of growth in Infrastructure Spending and GDP in order to justify future growth rate forecasting using IMF’s GDP data for the two countries. Applying this approach, we determine Revenue for Portugal and Poland to show CAGR of 3.39% and 3.49%, respectively, for the forecasted 2017-2021 period. EBITDA margins were based on historical averages that are assumed to remain constant at 7.1% for the forecasted period given the slow pace of revenue growth and limited prospects for efficiency improvement. We estimate Revenue for Africa considering BMI’s weighted-average Construction Industry real growth rate forecasts for the countries where ME operates, adjusted for ME’s competitive positioning, leading to a 2017-2021 Revenue CAGR of 5.2%. EBITDA margin are expected to remain robust throughout this period at 21%, reflecting excess margin requirements due to the inherent risks of large projects in the region, such as the new railway line in Tanzania.
Overall, LATAM Revenue CAGR for the forecasted period is estimated at 6.7%, resulting from individual country forecasts for ME presences in Mexico, Brazil, Peru and Colombia & Others. The valuation for the region is mainly influenced by Mexico where we remain conservative assuming a constant growth rate of 4.4% going forward affected by recent increases in uncertainty. To account for an increase in scale in the Region we apply an annual increase in EBTDA margin of 20 bps, converging to the average of its main peers by 2021F. Waste Management in Portugal
For Europe E&S Revenues, we considered Portuguese MSW production and the market share of SUMA and EGF in their respective markets. The market for MSW is mature, with possibilities to grow dependent on M&As and/or privatization. For waste treatment, we considered the EU and National Directives and objectives until 2020. Based on aforementioned reasons, Revenue developments for EGF show a constant increase over the forecasted period with a CAGR of 2.9%, while Revenue for SUMA shows little variation. From 2013-2015, we calculated SUMA and EGF average EBITDA margins to be 24.75% and 33%, respectively, arriving at a total weighted EBITDA margin of about 30%. Even though it is above the European E&S market, these levels are considered to remain constant due to less competition and more resilient margins in Portugal.
Capex and D&A
Taking into account average historical Investment and limited upside expectation for expansionary investments, beginning in 2021, CAPEX winds down from €188 million to €158 million due to investment stabilization in EGF. D&A rates were computed using 3-year historical rates as they have remained constant leading to projected regional depreciation of equipment between 16% and 27%.
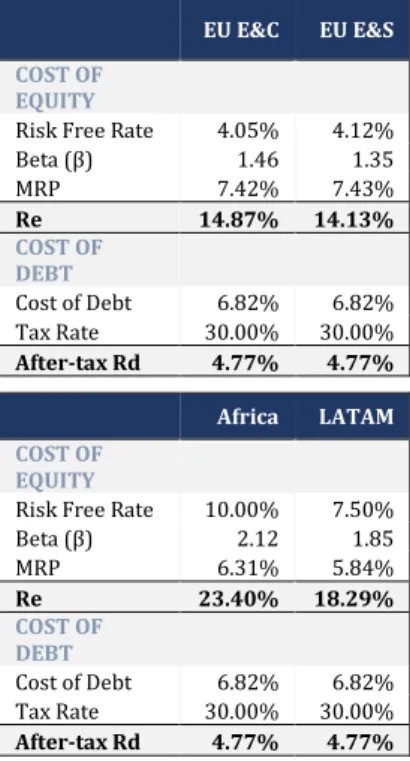
Weighted Average Cost of Capital
To discount FCFF, four different WACCs are used to distinguish between the risks inherent in each of the regions. For the Cost of Equity, we followed the CAPM approach using as the Risk-Free Rate (RFR) the current 10Y Government Bond’s YTM for each region arriving at a RFR of 4.05% for Europe E&C, 4.12% for Europe E&S and 7.5% and 10% for LATAM and Africa, respectively. For the MRP, we considered the respective expected market return net its Rf, weighting it by 2015 Sales of each country. To estimate the Beta for the segments, we compute unlevered Betas for all our regional peers and adjust them for ME’s capital structure and tax rate. Damodoran’s Construction Emerging Markets Unlevered Betas were consulted to complement peer data for Africa and LATAM. To determine ME’s cost of Debt we consider its debt structure, using the average rate of outstanding fix rate notes as well as an average of its spread for outstanding floating rate notes adjusted by a long term historical 6 months Euribor of 2.14% to anticipate expected future interest rate increases. Pretax cost of debt for the company is 6.82% and assumed to remain constant over the forecasted time horizon. Assuming an effective tax rate of 30%, the annual regional fluctuation in WACC only arises from a change in the capital structure as a result of deleveraging and EBITDA improvements.
Terminal Value (TV)
For the terminal value in period 2022, we calculate a perpetuity assuming Capex and Depreciation normalization for each of the segments and link long term growth rates to inflation prospects for the regions with a cap of 2% for Africa and LATAM and Inflation rates forecasted at 1% and 1.5% for Europe E&C and E&S, respectively. As a discount factor, we use the WACC correspondent to our target capital structure.
Peer’s Selection
To select ME’s peer companies, a four-stage process was conducted in which we: (i) gathered companies in the same industry according to GICS and evaluated their business congruency with ME, based on (ii) overall revenue generation, (iii) geographical distribution of revenues, as well as (iii) a detailed breakdown of operating segments of the competitors. Using this approach, we obtained a minimum of 4 peers per region that we considered adequate (see appendix 17).
Table 5. Cost of Capital
EU E&C EU E&S
COST OF
EQUITY
Risk Free Rate 4.05% 4.12%
Beta (β) 1.46 1.35
MRP 7.42% 7.43%
Re 14.87% 14.13% COST OF
DEBT
Cost of Debt 6.82% 6.82%
Tax Rate 30.00% 30.00%
After-tax Rd 4.77% 4.77%
Africa LATAM
COST OF
EQUITY
Risk Free Rate 10.00% 7.50%
Beta (β) 2.12 1.85
MRP 6.31% 5.84%
Re 23.40% 18.29% COST OF
DEBT
Cost of Debt 6.82% 6.82%
Tax Rate 30.00% 30.00%
After-tax Rd 4.77% 4.77%
Source: Estimates
Table 7. Multiples Price Target
EV/EBITDA Multiple EV/SALES Multiple
ENTERPRISE
VALUE 1,919,730 1,633,024
Net Debt (913,559) (913,559)
NCI (292,701) (292,701)
Associates and Financial Investments
248,271 248,271
Holdings (15,244) (15,244)
Provisions (124,733) (124,733)
Fin. Leasing (121,083) (121,083)
700,681 413,976 Shares
Outstanding 233,865 233,865
ME's Price € 3.00 € 1.77
Discount 10% 10%
Price Target € 2.70 € 1.59
Average € 2.14 upside
potential 30.6% current price € 1.65
Source: Estimates
Table 6. Multiples
Europe E&C LATAM
Teixeira Duarte Empresas ICA Conduril
Engenharia Caputo Erbud Grana Y Montero Trakcja PRKiI DYCASA
Unibep INGEVEC
Obrascon Huarte Lain
Empresa Constructora
Moller
Europe E&S Africa
GPE Groupe
Pizzorno Group Five Prazske Sluzby Stefanutti
Lassila &
Tikanoja Raubex Group Shanks Group Julius Berger
Nigeria Seche
Environnement
9 Relative Valuation
As a complementary valuation to the DCF approach, we present a price range for ME using Relative Valuation Multiples considering peers’ historical EV/EBITDA and EV/Sales ratios. To normalize the cyclicality of the industry we take a 2010-2015 annual sample and refrain from using inaccuracy of price multiples caused by great variation in leverage among peers. EV/EBITDA was considered well suited for a capital intense business by removing the impact of depreciation policies. The multiple approach using EBITDA and Sales are also not impacted by capital structures. To improve the multiples’ accuracy, chosen multiples were adjusted for outliers to avoid selection bias. Performing the multiple valuation, we attain a value for ME’s equity of € 1.59 per common share using EV/Sales valuation, with a price of € 2.70 for EV/EBITDA, arriving at an average price target of € 2.14, which complements our DCF approach of € 2.35.
Financial Analysis
Company Objectives weighing on ROE
As a result of the ongoing deleveraging process, Mota-Engil is suffering decreasing return on its equity, dropping to 14%-15% in the final 3 years of our forecasts compared to 15,8% to 18,5% in the first two years. Despite improvements in efficiency, showing an increase in fixed asset turnover from 1,28 in 2016 to 1,64 in 2021, the compay is not able to generate additional return on its equity as its equity multiplier changes disproportionately decreasing 36% by 2021, while profitability in terms of net profit margin moves in a short range averaging around 4,5%.
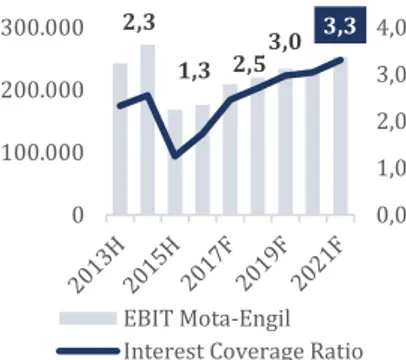
A further drawback appears through a change in WACC that increase RE implying a higher financing cost that
negatively impacts valuation. Offsetting the negative component, lower overall financial expenses and a dwindling impact of financial distress outweigh this component at current levels. The rationale of deleveraging is to to improve the interest coverage ratio by incurring lower interest cost relative to operational income. ME interest coverage ratio has seen positive impact due to both, the interest affect as well as nominal EBIT improvement in the forecasted period. In the forecasted period EBIT/Interest Expense increases significantly from 1.74 to 3.31 due to aforementioned measures.
EBITDA Margin moving in close Range
ME EBITDA margin has been stable overtime with 15.7%, 17.3% and 15.1% between 2013-2015. Considering the four business areas, Europe E&S has been performing in line with its peers while LATAM shows slight inferiority at a 200 Bps discount over its main rivals for the 2013-2015 period. Africa’s EBITDA margin of 21.1% is contributing substantially to overall margins and outperforms all of its peers in term of profitability. Europe E&C has posted the lowest margins and disappoints on a relative basis to its peers. Analyzing the cost structure of the business and nature of historical margins, there is little room for a widening in profitability in terms of EBITDA margin.
Investment Risks
Operational and Demand Side Risk | Decrease in Public Infrastructure Spending (OD1)
ME’s revenue dynamics depend to a large extend on the ability of Governments to finance national construction infrastructure projects. As a consequence of sovereign debt problems in some of the countries that the company operates in, governments may see themselves forced to cut planned investment if economic indicators take an unfavorable path. Being a fairly small player in the markets of Africa and LATAM and taking into account ME’s strong backlog, increasing investment uncertainty can cause substantial volatility in the medium to long term. Operational and Demand Side Risk | Unsustainable Leverage (OD2)
Investors’ unease with respect to the company’sdebt level is a crucial driver of the stock price’s downtrend witnessed over the past years. For the 2011-2015 period, the equity ratio (measured as equity as a percentage of total assets) averaged a mere 13.4% while a decrease in the interest coverage ratio (measured as EBIT over interest expense) from an average 2.4 for the 2013-2014 period to 1.3 in 2015 confirms the inherent risks of distress and the importance of debt reduction in a less favorable business environment.
Operational and Demand Side Risk | Market Saturation and Fierce Competition (OD5)
Disregarding the Portuguese business regions, ME is facing fierce competition. Following the example of the Polish market, where market saturation through a large number of national as well as international players has been negatively impacting margins, a further increase in competitiveness in Africa and LATAM can entail a similar development, forcing the company to match lower tender offers, effecting profitability unfavorably. Taking into account the high 20% margins that ME requires in Africa for larger projects to mitigate potential unforeseeable risks, exposure to fiercer rivalry could lead to significant erosion of that profitability.
Market Risk | Interest Rate Risk (MR1)
In the current low interest environment, ME is exposed to a normalization of rates with an amount of floating rate long and short term liabilities of €388 million in 2015 for debenture above €10 million. Anticipating an increase in Euribor rates, the company’s main refinancing benchmark with respect to its floating rate debt, ME Table 8. Investment Risks
Risks Mitigating Factors
Operational and Demand Side Risk Decrease in Public Infrastructure Spending Geographical Diversification/ Private Collaborations Unsustainable Leverage Non-Core Asset Divestiture Market Saturation and Fierce Competition Efficiecy Improvements/ Expansion Market Risk Interest Rate Risk Hedging/longer duration fixed rate loans Exchange Rate Risk Hedging (Forward/SWAP) Commodity Price Risk Geographical Diversification Source: Estimates
Figure 25. Risk Matrix
Source: Estimates
Figure 23. Interest Coverage Ratio
Source: Estimates
2,3 1,3 2,5 3,0 3,3 0 100.000 200.000 300.000 0,0 1,0 2,0 3,0 4,0 EBIT Mota-Engil Interest Coverage Ratio
Figure 24. EBITDA and Gross Margin
Source: Estimates
0% 20% 40% 60% 80% 100% 0 100.000 200.000 300.000 400.000 500.000 Latin America Africa Europe - E&S Europe - E&C
10 will experience a tick up in financing costs from these debt instruments in the case of further economic stabilization and a subsequent increase in major refinancing rates. On the contrary, with a fixed rate debt exposeure of €419 million, ME is expected to decrease the present value of its fixed rate debt as interest rates normalize but will incur higher financing costs for newly issued fixed rates bonds. The company’s overall large expose to interest rates through a debt burden of €1.9 billion creates a risk for ME in a rising rate environment that might put further downward pressure on the company’s interest coverage ratio of 1.3% in 2015 if operating profits were to deteriorate. The company does not enter into IRS derivative to limit its exposure to floating rate notes.
Market Risk | Exchange Rate Risk (MR2)
Main exchange rate exposure for ME arises predominately from equity translation exposure in LATAM and Africa. The majority of business transactions in Africa is denominated in USD that, while strengthening substantially in recent years, has seen moderate fluctuations with a EUR/USD standard deviation of annual returns of 7% for the 2011-2016 period. In terms of currency risks LATAM has experienced greater fluctuation with an annual standard deviation of returns of 8% for Mexico and Peru and 21% for the Brazilian Real during the same period. Going forward, based on political tension with the US, the Mexican Peso is expected to show increasing volatility in the coming years, decreasing the certainty of revenue expectation in the region. This expectation has already affected the currency in 2016 with a devaluation over the Euro of 17%, that affects in full the consolidated revenue for the group as ME is not hedged with respect to its currency exposure. Market Risk | Commodity Price Risk (MR3)
With respect to ME’s exposure to commodity prices, the company incurs indirect risks from the LATAM and especially African countries where it operates. Effected by the commodity down cycle in recent years, resource dependent national governments in Africa and LATAM have generated lower revenue, resulting in increasing caution with respect to investment in national infrastructure –one of ME’s main revenue drivers. Recent bottoming of commodity prices has led to a more optimistic outlook for government revenues, but fears remain that a hard landing in China may further deteriorate demand for commodities. The indirect exposure to commodity prices has been a major factor of ME’s current depressed stock price and the remaining uncertainty will continue to pose a substantial risk to the company going forward.
Other minor risks are detailed in Appendix 23 Risks to Price Target
A sensitivity analysis was performed to assess the impact of some risks on ME’s price target. We study a possible change in the cost of debt for ME, growth rates for Africa and LATAM as well as country risk premia for those regions.
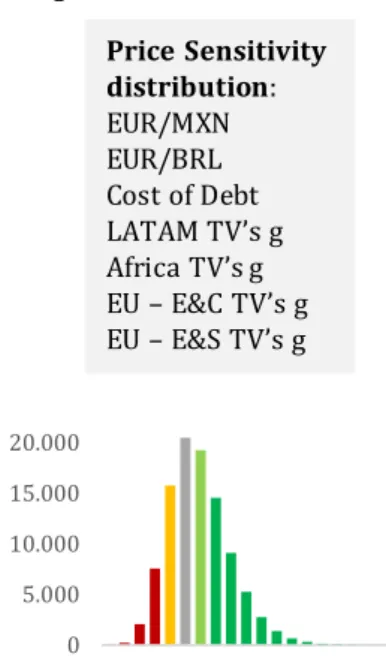
As a way to complement our previous analysis, Monte Carlo simulation was considered. ME’s valuation is highly sensitive to exchange, interest and growth rates. The average price with the simulation is €2.58, which is similar to our DCF target price of €2.35. According to the Monte Carlo simulation the variables that have the greatest impact on ME’s target price are LATAM growth rates and EUR/MXN. Our BUY recommendation has an 83% probability of being accurate (appendix ).
Sensitivity Analysis
Cost of Debt (Rd) 5.00% 5.75% 6.50% 6.82% 7.00% 7.75% 8.50%
DCF fair price 2.72 2.56 2.41 2.35 2.31 2.17 2.03
Change in inital price 6.2% 6.4% 2.7% -1.5% -6.2% -6.3%
0.0% 1.5% 1.8% 2.0% 2.3% 2.5% 2.8%
0% 1.86 2.10 2.15 2.19 2.25 2.30 2.35
1% 1.93 2.17 2.22 2.27 2.32 2.37 2.43
2% 2.01 2.25 2.30 2.35 2.40 2.45 2.51
3% 2.11 2.35 2.39 2.44 2.49 2.55 2.60
4% 2.22 2.46 2.50 2.55 2.60 2.66 2.71
Terminal growth rate Africa
T e rm in a l g ro w th r a te L A T A M
-1.0% 0.0% 1.0% 2.0% 3.0% 4.0% 5.0%
-1% 2.57 2.41 2.27 2.14 2.02 1.92 1.82
0% 2.51 2.35 2.21 2.08 1.96 1.85 1.76
1% 2.45 2.29 2.15 2.02 1.90 1.80 1.70
2% 2.40 2.24 2.09 1.97 1.85 1.74 1.65
3% 2.35 2.19 2.04 1.92 1.80 1.69 1.60
4% 2.30 2.14 2.00 1.87 1.75 1.65 1.55
Additional Country Risk Premium in Africa
A d d it io n a l C o u n tr y R is k P re m iu m in L A T A M
Figure 26. Monte Carlo Simulation
Source: Estimates
Price Sensitivity
distribution
:
EUR/MXN
EUR/BRL
Cost of Debt
LATAM TV’s g
Africa TV’s g
EU
– E&C TV’s g
EU
– E&S TV’s g
0 5.000 10.000 15.000 20.000 0,541,492,453,404,355,316,26