DOI: 10.5935/2359-4802.20180058
ORIGINAL ARTICLE
Mailing Address: Elizabeth de Orleans Carvalho de Moura
Universidade Federal de São Paulo - Campus Baixada Santista - Departamento de Biociências R. Silva Jardim, 136. Postal Code: 11015-020, Vl. Mathias, Santos, SP - Brazil
E-mail: [email protected]
Comparison betweent the Effects of Swimming and Treadmill-Based Aerobic Training
Protocols in Diabetic Rats
Elizabeth de Orleans Carvalho de Moura,1 Kelvin Tanaka,1 Moisés Felipe Pereira Gomes,1 Evandro Nogueira,2
Ricardo Gomes,1 Debora Estadella,1 Katt Mattos,3 Patrícia Chakur Brum,3 Alessandra Medeiros1
Universidade Federal de São Paulo (UNIFESP),1 São Paulo - Brazil
Faculdade Integral Diferencial,2 Piauí - Brazil
Universidade de São Paulo (USP),3 São Paulo - Brazil
Manuscript received September 14, 2017, revised manuscript June 11, 2018, accepted June 18, 2018.
Abstract
Background: Type 1 diabetes mellitus (DM1) can cause damage to several physiological systems.
Objectives: To compare and characterize the effects of aerobic exercise training (ET) performed by swimming with those of ET performed on a treadmill on the skeletal muscle and heart of rats with DM1.
Methods: 41 male Wistar rats were randomized into four groups: nondiabetic control (CTR), diabetic control (DMC), diabetic trained on the treadmill (DMT), and diabetic trained by swimming (DMS). The trained groups performed aerobic exercise training for 8 weeks, 5 times a week, 60 min per day. Exercise tolerance, blood glucose, body weight, wet weight of the skeletal muscles and left ventricle (LV), muscle glycogen, cross-sectional area of skeletal muscles, and cross-sectional diameter and collagen volume fraction of the LV were evaluated.
Results: The results were expressed as mean ± standard deviation of the mean and submitted to two-way ANOVA with post-hoc Bonferroni test. Aerobic ET protocols applied to animals with DM1, regardless of the ergometer, showed satisfactory results (p < 0.05) when compared to the control groups: improved exercise tolerance, increased glycogen content of the soleus and extensor digitorum longus (EDL) muscles and increased cross-sectional diameter of the left ventricular cardiomyocytes. In some variables, such as exercise tolerance and cross-sectional area of the soleus and EDL muscles, DMT showed better results than DMS (p < 0.05). On the other hand, DMS showed increased cross-sectional diameter of cardiomyocytes when compared with the DMT group.
Conclusion: Both aerobic ET protocols offered benefits to animals with diabetes; however, due to the specific characteristics of each modality, different physiological adaptations were observed between the trained groups. (Int J Cardiovasc Sci. 2018;31(6)610-618)
Keywords: Exercise; Physical Exertion; Rats, Wistar; Diabetes Mellitus; Exercise Test; Muscle, Skeletal.
Introduction
In Brazil, the current overall prevalence of diabetes mellitus (DM) is 7.6% and of these, 46% have not been
diagnosed.1 DM type 1 (DM1) is found in 5% to 10% of
cases. This type is characterized by destruction of the
insulin-secreting cells of the pancreas.2 In the long term,
DM1 can cause damage throughout the body and to several physiological systems, especially the kidneys,
eyes, nerves, heart, and blood vessels.3
Cardiomyocytes are greatly affected by the disease. The development of “diabetic cardiomyopathy 1” (DC)
may occur4 and skeletal muscle can also be affected.
In fact, a reduction in the muscle fiber size occurs and in cases of poor glycemic control, there can also be
alterations in the distribution of muscle fiber types.5
Silva et al.,4 showed that ET performed in a swimming
other hand, ET on a treadmill resulted in increased capillary density in Wistar rats and an increase in
oxidative muscle fibers.6 However, a comparison between
the effects of ET performed on a treadmill and in a swimming pool is scarce in the literature.
We know that the environment where exercise is carried out influences the acquired adaptations. ET in water submersion tests requires different physiological
adaptations than training performed on the ground.7
The main physical properties of water that show clinical relevance are density, buoyancy, hydrostatic pressure, turbulence, viscosity, surface tension, and
refractivity.8 Whereas in the swimming pool the
individual is subject to the action of all of these properties to keep the upper airway above the level of water, on the treadmill, the gravitational force and the ground reaction force are the factors that most influence the movement
performed out of water.9
Therefore, the aim of this study was to compare the effects of ET in animals with DM1 and thus perform the characterization of the cardiac and skeletal muscle adaptations following an ET protocol performed in two different ergometers, a treadmill and a swimming pool.
Material and methods
A cohort of 41 male Wistar rats was studied from 8 to 16 weeks of age. The animals were housed under controlled environmental conditions. The animals were assigned to four experimental groups: sedentary control (CTR) with 10 rats; sedentary diabetes mellitus (DMC) with 11 rats; diabetes mellitus submitted to swimming training (DMS) with 12 rats; diabetes mellitus submitted to treadmill training exercise (DMT) with 9 rats. This study was carried out in accordance with the National Research Council’s Guidelines for the Care and Use
of Laboratory Animals,10 according to the Brazilian
legislation on animal testing (Federal Law N˚11,794 of 2008) and was approved by the Ethics and Research Committee (ERC) of UNIFESP (ERC #0384/12).
DM1 induction was carried out by administrating streptozotocin (STZ) (Sigma Chemical Company, St. Louis, MO, USA). A single dose of STZ (70 mg/ kg) dissolved in citrate buffer (0.01 M, pH 4.5) was
administered through the dorsal vein of the penis.11,12
Fasting blood glucose was estimated using a reagent strip and glucometer to confirm the diabetic state 7 days after the STZ injection. The animal was considered
diabetic when glycemia was ≥ 200 mg/dL.13,14 Animals
with glycemia equal to or higher than 500 mg/dL were excluded from this experiment.
The animals in this experiment were trained individually with equal intensity in their respective tracks of aerobic/anaerobic transition (Lan). To identify the metabolic transition zone, a test to measure blood lactate during exercise was carried out to determine the maximum lactate steady state (MLSS).
Before performing the test cited earlier, the animals underwent a 5-day adaptation to their respective
ergometers for 25 min/day.15
After 48 h of rest, the end of the adjustment period, the animals of the DMS group performed 20 min of continuous effort in the pool, bearing a load of 3% of their body weight on the first test day, 3.5% on the second day, 4% on the third day, and 4.5% on the fourth test day. Between each test, there was an interval of 48 h to allow for stabilization of serum lactate levels. The incremental load was tied to the back of the animals with an elastic band. During the test, blood samples were collected every 5 min from a cut in the tip of the
tail for lactate determination.15
The animals submitted to treadmill training exercise (DMT) also underwent a lactate test similar to the group submitted to swimming training; however, the test was adapted to the treadmill. After 48 hours of rest at the end of the adaptation period, the animals performed 20 minutes of exercise on each test day. The protocol consists of 4 days of testing, starting on the first day with a velocity of 10m /min, and 5m / min added on each day of the test. Between each test day there was a 48-hour interval for the stabilization of lactate levels. Blood samples were taken every five minutes during the test at the distal end of the animals’ tail to measure
the lactate level of each animal.15
The exercise capacity of all groups was measured on the treadmill and estimated by the total distance. It was evaluated before the beginning of the exercise training protocols and after the end of the exercise training protocols on the eighth week, after 24 hours of rest. The test consisted of an initial walk with an initial speed of 3 m/min for 5 minutes for warming-up, with 3 m/min being added every 3 minutes until the animal showed
signs of exhaustion.16
Exercise training
Swimming
In the first week of the experiment, the animals from the DMS group were placed in a pool with 700 L of water, divided by glass tanks of different sizes. The water temperature was maintained at 33 ± 1º C. The training protocol consists of 1 session of 60 min/day, 5 days/week and intensity determined by the MLSS, for 8 weeks. At midpoint of the protocol, that is, the fourth week of training, there was a new lactate test to readjust the intensity of training, as animals suffer physiological adaptations and the intensity established at the beginning of the protocol would satisfy a lower intensity of animal Lan.
Treadmill
After the week of adaptation and determination of MLSS, the animals of the DMT group started the ET protocol over 8 weeks, 5 days/week, 60 min/day at an intensity corresponding to MLSS. At midpoint of the protocol, that is, the fourth week of training, a new lactate test was performed in order to readjust the intensity of training.
Glucose levels and body weight
Glucose measurement was performed at the tip of the tail in the following phases of the trial period: after 12 h of fasting; every 7 days during the experimental period. For the fasting blood glucose test, reagent strips were used and measured by a glucometer.
Body weight was evaluated under the same conditions and at the same time as glycemic control on a scale.
Euthanasia of animals
At the end of the experiment, rats were not handled for 24 h and after that they were anesthetized with ketamine (0.2 mL/100 g) and xylazine (0.1 mL/100 g), sacrificed by decapitation, and their tissues harvested. Cardiac chambers were dissected, and the left ventricle was weighed, as well as the right soleus and right extensor digitorum longus (EDL) muscles.
Skeletal muscle cross-sectional area
Soleus and EDL muscles were cut into 5-µm-thick sections using a cryostat and stained with hematoxylin and eosin for examination under light microscopy.
Whole muscle cross-sectional area was evaluated at 200× magnification and further analyzed on a digitizing unit connected to a computer using the Axiovision program. All analyses were conducted by a single observer (EM), blinded to the rat’s group.
Skeletal muscle glycogen content
The soleus and EDL muscles were digested in 30% KOH at 100°C and glycogen was precipitated by the addition of 100% ethanol. After precipitation, the sample was centrifuged at 3500 rpm for 30 min. The supernatant was then decanted off and the precipitated glycogen was obtained quantitatively by two successive extractions with trichloroacetic acid 5%. Glycogen was estimated using a colorimetric assay with an anthrone reagent (0.2% solution in 95% sulfuric acid). The protocol was
adapted for skeletal muscle tissue from Balmain et al.,17
and previously used by Voltarelli et al.18 The values are
expressed in microgram per gram of fresh weight.
Cardiac structural analysis
The left ventricles were then embedded in paraffin for histological processing. Sections (5 µm) were stained with hematoxylin and eosin for examination under light microscopy. Only nucleated myocytes from the transversally-cut muscle fiber areas were included in
the cross-sectional diameter of cardiomyocyte analysis.19
Quantification of left ventricular fibrosis was achieved using picrosirius red staining. Analyses were performed in a computer-assisted morphometric system.
Statistical analysis
The data are expressed as mean ± standard deviation. The normality of the data was verified through the Kolmogorov-Smirnov test. The effect of exercise training protocols was tested by one or two-way analysis of variance (ANOVA), as appropriate. When a statistically significant difference was achieved, post hoc comparisons between groups were performed using Bonferroni test. Statistical analyses were performed using Dell Statistica (version 12). The level of significance was set at p < 0.05.
Results
Table 1 - Glycemia, body weight and exercise tolerance before (pre) and after (post) 8 weeks of either sedentary status or exercise training
Parameter
Glycemia (mg/dL) Body weight (g) Exercise tolerance (min)
Groups
Pre
CTR 70 ± 6 237 ± 15 29 ± 2
DMC 229 ± 24 a 219 ± 8 19 ± 1 a
DMS 282 ± 27 a 234 ± 8 21 ± 1 a
DMT 250 ± 25 a 193 ± 7 20 ± 1 a
Post
CTR 65 ± 8 381 ± 19 * 23 ± 2 *
DMC 284 ± 18 a 196 ± 12 a 16 ± 1 a
DMS 252 ± 12 a 227 ± 8 a 23 ± 2 b
DMT 346 ± 27 abc* 211 ± 10 a 28 ± 2 b*
CTR (n = 10), DMC (n = 11), DMS (n = 12), and DMT (n = 9). a ≠ CTR, b ≠ DMC, c ≠ DMS. * ≠ pre (p < 0.05). Results are presented as mean ± standard derivation of the mean; Two-way ANOVA with post-hoc Bonferroni test.
group showed higher glycemia at the end of the protocol when compared to all other groups (Table 1).
In relation to body weight, diabetic groups (DMC, DMS and DMT) showed lower body weight when compared to the CTR at the end of the protocol. Only the CTR group showed a significant (p < 0.05) increase in body weight at the end when compared to the beginning of the protocol (Table 1).
Diabetic groups (DMC, DMS and DMT) displayed statistically significant (p < 0.05) lower exercise tolerance at the beginning of the protocol when compared to the CTR group. Only the DMT group showed a significant (p < 0.05) increase in exercise tolerance at the end when compared to the beginning of the protocol. Although the DMS group did not show a significant increase at the end compared to the beginning of the protocol, exercise tolerance was significantly higher (p < 0.05) than in the DMC group (Table 1) at the end of the protocol. The CTR group showed a decrease in exercise tolerance at the end compared to the beginning of the protocol.
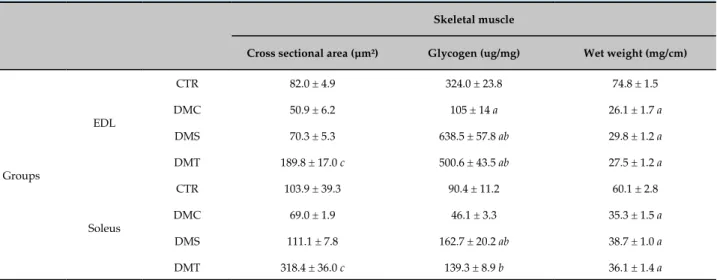
The data related to the analysis performed in the soleus and EDL muscles are shown in table 2. The DMC group showed similar cross-sectional areas of soleus and EDL muscle fibers when compared to the CTR group. Only exercise training on the treadmill was able to increase this variable, since the DMT group showed greater areas in the fibers of both muscles when compared to the CTR, DMC and DMS groups (p < 0.05).
Regarding glycogen levels, the DMC showed similar levels in soleus but decreased levels in the EDL (p < 0.05) when compared to the CTR group. Both ET protocols were able to increase the glycogen levels in both muscles (p < 0.05). In addition, the DMS group showed a higher level in relation to the CTR group.
When comparing the wet weight of the soleus and EDL muscles, the DMC showed lower weights of both muscles corrected for tibial length when compared to the CTR group. The ET protocols used in this study had no effect on this variable, since no differences were found between the DMC, DMS and DMT groups. When correcting the weight of the muscles by body weight, there were no significant differences either and, for that reason, these data are not shown.
Table 2 - Cross-sectional area, glycogen content and wet weight of the soleus and EDL muscles corrected for tibial length after 8 weeks of either sedentary status or exercise training
Skeletal muscle
Cross sectional area (µm²) Glycogen (ug/mg) Wet weight (mg/cm)
Groups
EDL
CTR 82.0 ± 4.9 324.0 ± 23.8 74.8 ± 1.5
DMC 50.9 ± 6.2 105 ± 14 a 26.1 ± 1.7 a
DMS 70.3 ± 5.3 638.5 ± 57.8 ab 29.8 ± 1.2 a DMT 189.8 ± 17.0 c 500.6 ± 43.5 ab 27.5 ± 1.2 a
Soleus
CTR 103.9 ± 39.3 90.4 ± 11.2 60.1 ± 2.8
DMC 69.0 ± 1.9 46.1 ± 3.3 35.3 ± 1.5 a
DMS 111.1 ± 7.8 162.7 ± 20.2 ab 38.7 ± 1.0 a DMT 318.4 ± 36.0 c 139.3 ± 8.9 b 36.1 ± 1.4 a
CTR (n = 10), DMC (n = 11), DMS (n = 12), and DMT (n = 9). a ≠ CTR, b ≠ DMC, c ≠ DMS, DMC and CTR (p < 0.05). Results are presented as mean ± standard derivation of the mean; One-way ANOVA with post-hoc Bonferroni test.
Table 3 - Cross-sectional diameter, collagen volume fraction and wet weight of left ventricle corrected for tibial length after 8 weeks of either sedentary status or exercise training
Left ventricle
Cross-sectional diameter of
cardiomyocytes (µm) Collagen (%) Wet weight (mg/cm)
Groups
CTR 18.8 ± 1.0 5.78 ± 0.45 225.8 ± 685
DMC 17.8 ± 1.4 6.34 ± 1.03 162.2 ± 585 a
DMS 34.6 ± 6.8 ab 8.15 ± 0.68 175.8 ± 449 a
DMT 25.7 ± 1.0 abc 7.55 ± 0.69 161.3 ± 298 a
CTR (n = 10), DMC (n = 11), DMS (n = 12), and DMT (n = 9). a ≠ CTR, b ≠ DMC, c ≠ DMS (p < 0.05). Results are presented as mean ± standard derivation of the mean; One-way ANOVA with post-hoc Bonferroni test.
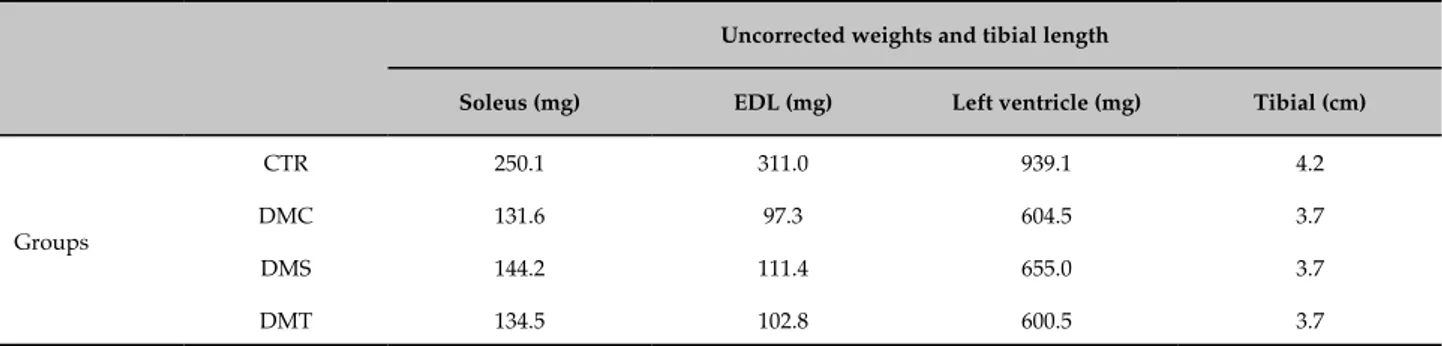
exercise training protocols were not able to change this variable (Table 4).
Discussion
Some studies show that aerobic ET aids in controlling blood glucose, whereas other studies showed no
significant improvement regarding this control.14,20 What
is known and is widely discussed in the literature is that, physiologically, ET increases the expression of GLUT4 transporters, optimizing glucose uptake in muscle cells and accordingly, it is argued that this has a significant
impact on the control of serum glucose, while maintaining
hepatic glucose production stable.21 However, this glucose
control was not verified in our study.
Neither ET protocol was able to reestablish the body weight of the diabetic groups. Body weight maintenance is one of the variables affected by the clinical condition
of DM1.22 With the diminishing supply of glucose
Table 4 - Demonstration of uncorrected weights in relation to the tibial length; soleus muscle, EDL muscle, left ventricle and tibial length
Uncorrected weights and tibial length
Soleus (mg) EDL (mg) Left ventricle (mg) Tibial (cm)
Groups
CTR 250.1 311.0 939.1 4.2
DMC 131.6 97.3 604.5 3.7
DMS 144.2 111.4 655.0 3.7
DMT 134.5 102.8 600.5 3.7
are not triggered and this prevents progressive weight
loss.22,23 As the ET was not able to promote better
glycemic control, the improvement of body weight did not occur, either.
The DMC group showed decreased exercise tolerance and the trained groups increased exercise tolerance after the ET protocol when compared with the DMC group. This result allows us to infer that DM1 had a negative influence on the exercise tolerance of the animal, and the ET, whatever the ergometer used, provided physiological adaptations to the diabetic animal, increasing exercise capacity. The DMT group was the only one with a significant improvement in exercise tolerance when compared to the results achieved before the experimental period. Adaptability and familiarity with the ergometer
can explain this result,24 as the exercise tolerance test
was performed in the same ergometer in which the DMT group trained for 8 weeks.
Regarding the skeletal muscles, the diabetic groups showed lower weights when compared with the CTR group. This result confirms the activation of biochemical mechanisms to increase energy bioavailability in the bloodstream, as well as the difficulties of supplying energy to maintain the cell, which is caused by the lack
of insulin caused by DM1.22
On the other hand, when we evaluated the cross-sectional area of the soleus and EDL muscles, we did not observe differences between the DMC and CTR groups. However, the ET on the treadmill was able to significantly increase the cross-sectional area of both muscles. ET leads to differentiation of muscle fiber types and the different types of fibers have different diameters. Although the soleus muscle has a predominance of type 1 fibers and the EDL muscle a predominance of type 2 fibers, there still exists a small percentage of other types of fibers that may influence this analysis. The histological technique used in
this study did not allow us to differentiate between fiber
types.25,26 Furthermore, the biomechanics of movement
in the ergometer should have favored the DMT group, as we analyzed agonist muscles.
Muscle fibers of different types also have different metabolic profiles. Thus, the soleus muscle has an oxidative metabolism and, consequently, greater reserves of glycogen, whereas the EDL muscle has a predominantly glycolytic metabolism and lower bioavailability of glycogen. As expected, the DMC group showed lower glycogen content when compared to the CTR group in the EDL because they had not received insulin 23. In the soleus muscle, this decrease in muscle glycogen levels did not show statistical difference.
Both ET protocols used in this study were able to increase glycogen content in both muscles when compared with the DMC group. This result corroborates the abovementioned data , where researchers claim that ET has the ability to increase the expression of
the GLUT4 transporter.21 This fact may have favored
the entry of glucose into muscle cells. However, this action may not have been enough to affect serum glucose levels, which remained high even after the exercise training period. Possible explanations for the contrast observed in this study include the severity of STZ effects, which can vary between animals, and the intensity of the effort equivalent to metabolic transition, which may not be the most suitable one for obtaining
the desired beneficial effects.2
Regarding the analysis carried out in the heart, although glucose was found to be high in the DMC group and to stay high in the trained groups, we found no differences in the collagen volume fraction between
the groups, corroborating the results of Stilli et al.,27
unlike the findings of other studies.28,29. Sears et al.,30
used herein. However, they found that diabetic rats had increased levels of collagen fibers after DM1 induction, which may indicate that there is some variability in the cardiac collagen fraction response of rats when DM1
is induced by STZ.30 It may be possible that the period
of DM1 may influence this response. Aside from that, the different techniques and types of collagen volume fraction assessment may also influence this response.
Bakth et al.,31 induced mild DM1 in canines by
administering low doses of alloxan for a period of 1 year. Despite the low doses and mild DM1, this greater period of DM1 led to increased collagen volume
fraction in the myocardium of canines. Silva et al.,28 also
observed increased collagen in the left ventricle of rats. However, in this case, Silva et al. induced DM1 in rats
by administering STZ, 60 mg/kg, intraperitoneally.28
Another cardiac morphological change that was observed in this study was the left ventricular wet weight. As expected, the DMC group had a decrease in ventricular weight when compared with the CTR group, similar to other studies that have found a decrease in heart weight30,32 and left ventricular weight.27 Neither of
the exercise training protocols used in the present study was able to change the left ventricular wet weight.
On the other hand, cardiomyocyte hypertrophy was not observed in the DMC group, but the exercise training protocols used in the present study were able to increase the cross-sectional diameter of cardiomyocytes. There may have been a physiological hypertrophy since it is believed that ET can influence DNA replication and mitotic activity, which offsets the larger diameter induced by exercise training, compensating for the left ventricular weight. Thus, it may have decreased the number of cells, while increasing the size of those that remained. However, it is important to remember that we evaluated the wet weight of the ventricle, not the dry weight, which may result in other components influencing this remodeling of cardiomyocytes and ventricular mass.
The fact that swimming showed a more prominent increase in cardiac cross-sectional diameter may be due to the characteristics of this type of exercise, where the hydrostatic pressure exerted by water on the blood vessels leads to vasoconstriction and therefore,
promotes increased venous return and preload.33 It
is known that increasing the preload promotes the addition of new sarcomeres in series, leading to an
eccentric hypertrophy.34 Furthermore, this increase in
vasoconstriction also promotes increased post-load and
stimulates the growth of cardiomyocytes by adding new sarcomeres in parallel and increasing the thickness of the heart wall to produce a stronger contraction to overcome
this increased resistance.34 In fact, swimming training
was effective in increasing the width and cell volume of
cardiomyocytes in rats with DM.4
Another factor that may have contributed to this more notable increase in cardiac cross-sectional diameter after swimming training is the increased adrenergic activity. There are studies in rats showing that swimming training leads to higher norepinephrine and adrenaline levels than exercise training on a treadmill, favoring the activation of the sympathetic nervous
system.35 It is known that catecholamines exert cardiac
hypertrophic effects through adrenergic action, especially
in pathological conditions.36-39 Therefore, perhaps a
higher cardiac adrenergic action may have contributed to increased cardiomyocyte hypertrophy in DMS, when compared with DMT. It is likely that this cardiac remodeling observed in the trained animals reflected an improvement in cardiac function, which must have influenced the superior performance in terms of exercise tolerance compared with the DMC group.
However, it is important to note that our study did not evaluate the number of cardiomyocytes, or the adrenergic activity of each training protocol and its association with cardiac hypertrophy is speculative. Nevertheless, it is undoubtedly an interesting topic for future investigations.
Conclusion
The aerobic ET protocols applied to animals with DM1, irrespective of the ergometer, offered benefits in some regards: increased glycogen content of the soleus and EDL muscles and increased cross-sectional diameter of cardiomyocytes. For some variables, such as exercise tolerance and the cross-sectional area of the soleus and EDL muscles, the DMT showed better results than DMS group. On the other hand, the DMS showed increased cardiac cross-sectional diameter when compared with the DMT group.
Author contributions
1. Duarte CK, Almeida JC, Merker AJ, Brauer Fde O, Rodrigues Tda C. Physical activity level and exercise in patients with diabetes mellitus. Rev Assoc Med Bras (1992). 2012;58(2):215-21.
2. de Oliveira CA, Luciano E, Marcondes MC, de Mello MA. Effects of swimming training at the intensity equivalent to aerobic/anaerobic metabolic transition in alloxan diabetic rats. J Diabetes Complications. 2007;21(4):258-64.
3. Viggiano CE. Uma revisão sobre diabetes melito a review on diabetes mellitus. Rev Bras Cienc Saúde. 2007;3(11):52-61.
4. Silva MF, Pelúzio MD, Amorim PR, Lavorato VN, Santos NP, Bozi LH, et al. Swimming training attenuates contractile dysfunction in diabetic rat cardiomyocytes. Arq. Bras. Cardiol. 2011;97(1):33-9.
5. Andreassen CS, Jakobsen J, Ringgaard S, Ejskjaer N, Andersen H. Accelerated atrophy of lower leg and foot muscles—a follow-up study of long-term diabetic polyneuropathy using magnetic resonance imaging (MRI). Diabetologia. 2009; 52(6):1182-91. Erratum in: Diabetologia. 2009;52(7):1454.
6. De Angelis K, Pureza DY, Flores LJ, Rodrigues B, Melo KF, Schaan BD, et al. Efeitos fisiológicos do treinamento físico em pacientes portadores de diabetes tipo 1. Arq Bras Endocrinol Metab. 2006:50(6):1005-13.
7. Biomecânica do movimento humano. Brasília: Fundação Vale, UNESCO; 2013.
8. Finholdt M. Análise da função autonômica sobre o sistema cardiovascular em humanos submetidos à mudança postural e imersão em água. Belo Horizonte: Universidade Presbiteriana Mackenzie; 2007.
9. Caromano FA, Themudo Filho MR, Candeloro JM. Efeitos fisiológicos da imersão e do exercício na água. Rev Ter Ocup USP. 2003;14(2):95-103.
10. Barthold SW, Bayne K, Davis M. Guide for the care and use of laboratory animals. Washington: National Academy Press; 2011.
11. Luciano E, Lima FB. Metabolismo de ratos diabéticos treinados submetidos ao jejum e ao exercício agudo. Rev. ciênc. bioméd. (São Paulo). 1997;18:47-60.
12. Lenzen S. The mechanisms of alloxan-and streptozotocin-induced diabetes. Diabetologia. 2008;51(2):216-26.
13. Cesaretti ML, Ginoza M, Ribeiro AB, Kohlmann O Jr. [Systemic hemodynamic and left ventricular function of diabetic-induced hypertensive rats]. Arq Bras Endocrinol Metabol. 2010;54(9):842-51.
14. Lee Y, Kim JH, Hong Y, Lee SR, Chang KT, Hong Y. Prophylactic effects of swimming exercise on autophagy-induced muscle atrophy in diabetic rats. Lab Anim Res. 2012;28(3):171-9.
15. Manchado FD, Gobatto CA, Contarteze RV, Papoti M, Mello MA. The maximal lactate steady state is ergometer-dependent in experimental model using rats. Rev Bras Med Esporte. 2006;12(5):233e-6e.
16. Brum PC, Forjaz CL, Tinucci T, Negrão CE. Adaptações agudas e crônicas do exercício físico no sistema cardiovascular. Rev paul Educ Fís (São Paulo). 2004;18:21-31.
17. Balmain JH, Biggers J, Claringbold P. Micromethod for the estimation of glycogen in the genital organs of the, mouse. Austr J Biol Sciences.1956;9(1):139-46.
18. Voltarelli VA, Bacurau A, Bechara L, Bueno Junior C, Bozi L, Mattos K, et al. Lack of β2-AR improves exercise capacity and skeletal muscle oxidative phenotype in mice. Scand J Med Sci Sports. 2012;22(6):e125-32.
19. Rolim NP, Medeiros A, Rosa KT, Mattos KC, Irigoyen MC, Krieger EM, et al. Exercise training improves the net balance of cardiac Ca2+ handling protein expression in heart failure. Physiol Genomics. 2007;29(3):246-52.
20. Umpierre D, Ribeiro P, Kramer C, Leitão CB, Zucatti AT, Azevedo MJ, et al. Physical activity advice only or structured exercise training and association with HbA1c levels in type 2 diabetes: a systematic review and meta-analysis. JAMA. 2011;305(17):1790-9.
21. Pádua MF, Pádua TF, Pauli JR, Souza CT, Silva AS, Ropelle EC, et al. Exercício físico reduz a hiperglicemia de jejum em camundongos diabéticos através da ativação da AMPK. Rev Bras Med Esporte. 2009;15(3):179-84.
22. Santos C, Alvim C, Costa D, Coelho A, Guimarães F, Lage A, et al. Cetoacidose diabética. Revista Médica de Minas Gerais. 2008;18(3 supl 4):S6-S10.
23. Sociedade Brasileira de Diabetes. Diretrizes da Sociedade Brasileira de Diabetes. 2013-2014. São Paulo: AC Farmacêutica; 2014.
24. Tanaka LY. Efeito do exercício físico aeróbio no relaxamento aórtico de ratos e no controle da biodisponibilidade do óxido nítrico. [Dissertação]. São Paulo: Faculdade de Medicina da Universidade de São Paulo; 2008.
25. Galassetti P, Riddell MC. Exercise and Type 1 Diabetes (T1DM). Compr Physiol. 2013;3(3):1309-36.
26. Krause MP, Riddell MC, Hawke TJ. Effects of type 1 diabetes mellitus on skeletal muscle: clinical observations and physiological mechanisms. Pediatr Diabetes. 2011;12(4 Pt 1):345-64.
27. Stilli D, Lagrasta C, Berni R, Bocchi L, Savi M, Delucchi F, et al. Preservation of ventricular performance at early stages of diabetic cardiomyopathy involves changes in myocyte size, number and intercellular coupling. Basic Res Cardiol. 2007;102(6):488-99.
28. Silva E, Natali AJ, Silva MF, Gomes GJ, Cunha DN, Ramos RM, et al. Ventricular remodeling in growing rats with experimental diabetes: The impact of swimming training. Pathol Res Pract. 2013;209(10):618-26.
29. Castellar A, Remedio R, Barbosa R, Gomes R, Caetano FH. Collagen and reticular fibers in left ventricular muscle in diabetic rats: Physical exercise prevents its changes? Tissue Cell. 2011;43(1):24-8.
References
Statistical analysis: Gomes MFP. Writing of the manuscript: Medeiros A. Critical revision of the manuscript for intellectual content: Estadella D, Medeiros A.
Potential Conflict of Interest
No potential conflict of interest relevant to this article was reported.
Sources of Funding
There were no external funding sources for this study.
Study Association
This study is not associated with any thesis or dissertation work.
Ethics approval and consent to participate
This study was approved by the Ethics Committee
on Animal Experiments of the Universidade Federal
30. Searls YM, Smirnova IV, Fegley BR, Stehno-Bittel L. Exercise attenuates diabetes-induced ultrastructural changes in rat cardiac tissue. Med Sci Sports Exerc. 2004;36(11):1863-70.
31. Bakth S, Arena J, Lee W, Torres R, Haider B, Patel B, et al. Arrhythmia susceptibility and myocardial composition in diabetes. Influence of physical conditioning. J Clin Invest. 1986;77(2):382-95.
32. Howarth F, Qureshi M. Effects of carbenoxolone on heart rhythm, contractility and intracellular calcium in streptozotocin-induced diabetic rat. Mol Cell Biochem. 2006;289(1-2):21-9.
33. Negrão CE, Barreto AC. Cardiologia do exercício - do atleta ao cardiopata. Barueri (SP): Manole; 2010.
34. Mill JG, Pimentel EB, Lemos DM, Leite CM. Hipertrofia cardíaca: mecanismos bioquímicos. Revista da Sociedade de Cardiologia do Rio Grande do Sul. 2004;13(3):1-4.
35. Baptista S, Piloto N, Reis F, Teixeira-de-Lemos E, Garrido A, Dias A, et al. Treadmill running and swimming imposes distinct cardiovascular
physiological adaptations in the rat: focus on serotonergic and sympathetic nervous systems modulation. Acta Physiol Hung. 2008;95(4):365-81.
36. Tank AW, Lee Wong D. Peripheral and central effects of circulating catecholamines. Compr Physiol. 2015;5(1):1-15.
37. Vidal M, Wieland T, Lohse MJ, Lorenz K. β-Adrenergic receptor stimulation causes cardiac hypertrophy via a Gβγ/Erk-dependent pathway. Cardiovasc Res. 2012;96(2):255-64.
38. Ryall KA, Saucerman JJ. Automated microscopy of cardiac myocyte hypertrophy: a case study on the role of intracellular α-adrenergic receptors. Methods Mol Biol. 2015;1234:123-34.
39. Xu XY, Nie Y, Wang FF, Bai Y, Lv ZZ, Zhang YY, et al. Growth differentiation factor (GDF)-15 blocks norepinephrine-induced myocardial hypertrophy via a novel pathway involving inhibition of epidermal growth factor receptor transactivation. J Biol Chem. 2014;289(14):10084-94.