UNIVERSIDADE DA BEIRA INTERIOR
Ciências Sociais e Humanas
PORTUGUESE AIRPORTS AND THEIR HINTERLAND:
A GEOGRAPHICAL EFFICIENCY ANALYSIS USING
ANALYTIC NETWORK PROCESS COMBINED WITH
DATA ENVELOPMENT ANALYSIS
Tiago Alexandre Diogo Marques
Dissertação para obtenção do Grau de Mestre em
Economia
(2º ciclo de estudos)
Orientador: Prof. Doutora Margarida Vaz
iii
Resumo
Os aeroportos e o seu hinterland encontram-se hoje em dia sob o foco de intensa investigação académica em termos de impactos económicos, sociais e ecológicos. Neste trabalho, visamos o estudo da eficiência geográfica dos aeroportos portugueses, usando para o efeito três Análises Envoltórias de Dados (DEA) com Rendimentos Variáveis à Escala (VRS), e uma ponderação das eficiências técnicas obtidas através do VRS DEA. Estes modelos são previamente apoiados por uma selecção de inputs e outputs com base nas prioridades definidas através do Processo Analítico de Rede (ANP). Observa-se que os aeroportos de Lisboa (continental) e de Santa Maria (ilha) se encontram na fronteira eficiente para todos os outputs seleccionados (com rendimentos constantes à escala). Sete aeroportos das ilhas obtêm resultados de eficiência técnica bastante bons, com especial destaque para Santa Maria, Corvo, Graciosa e Horta. O aeroporto de Faro obtém níveis de eficiência técnica especialmente baixos para os outputs número de destinos directos e volume de carga processada. Conclui-se que os aeroportos, ao contrário do que seria expectável, não sofrem de uma dissociação da eficiência consoante a sua localização geográfica, tipo de operação (Carga ou Passageiros) ou tamanho efectivo do aeroporto. Os aeroportos com uma função Low
Cost apresentam resultados aquém dos obtidos para os aeroportos com operações ditas mais
generalistas, por via do efeito do número de destinos.
Palavras-chave
v
Abstract
Airports and their hinterland are nowadays being the scope of academic research in terms of economic, social and ecological impacts. In this research we study the geographical efficiency of Portuguese airports, using to this purpose a Data Envelopment Analysis (DEA) with Variable Returns to Scale (VRS) and an average score of technical efficiencies obtained through VRS DEA. These models are previously supported by a selection of inputs and outputs based on the priorities of the Analytic Network Process (ANP). We observe that the airports of Lisbon (continental) and Santa Maria (island) are on the efficient frontier for all selected outputs (with constant returns to scale). Seven airports on the islands obtain quite good technical efficiency scores, with particular emphasis on Santa Maria, Corvo, Graciosa and Horta. Faro airport obtains very low levels of technical efficiency especially for the outputs ‘number of direct destinations’ and ‘cargo volume’. We conclude that the efficiency of Portuguese airports, contrary to what may be expected, does not suffer from dissociations depending on geographic location, type of operation (cargo or passenger) or the effective size of the airport. Airports with a Low Cost function present results below those obtained by airports with more generalist operations, due the effect of the number of destinations technical efficiency scores.
Keywords
vii
Table of Contents
PART I - INTRODUCTION AND LITERATURE REVIEW ... 1
1. INTRODUCTION ... 1
1.1. Context and Relevance of the Study ... 1
1.2 Research questions and objectives ... 3
1.3 Structure of the research ... 3
2. AIRPORTS AND REGIONAL DEVELOPMENT... 4
3. THE IMPORTANCE OF BENCHMARKING AND ITS APPLICATIONS TO AIRPORTS ... 5
4. DATA ENVELOPMENT ANALYSIS (DEA) ... 7
4.1 The CCR model ... 9
4.2 The BCC model ... 9
4.3 Limitations ... 11
5. MULTI-CRITERIA DECISION METHODS: THE AHP AND THE ANP ... 11
5.1 Analytic Hierarchy Process (AHP) ... 12
5.2 Analytic Network Process (ANP) ... 12
PART II - EMPIRICAL STUDY ... 15
6. OBJECTIVES AND METHODOLOGY... 15
6.1 Objectives of the Empirical Study ... 15
6.2 Methodology ... 15
7. PORTUGUESE AIRPORTS AND THEIR HINTERLAND ... 17
7.1 Presentation of the Portuguese airports... 17
7.2 Brief characterization of the Portuguese airports and their hinterland ... 18
8. AN ANP MODEL FOR HINTERLAND VARIABLE SELECTION ... 20
8.1 Airports and hinterland indicators ... 20
8.2 The ANP model and the selected variables ... 21
9. EMPIRICAL DEA MODEL AND AVERAGE SCORE TABLE... 25
10. DISCUSSION OF EMPIRICAL RESULTS ... 28
11. FINAL CONCLUSIONS, LIMITATIONS AND RECOMMENDATIONS ... 29
BIBLIOGRAPHY ... 30
ix
List of Figures
Figure 1 - Methodologies for Airport Benchmarking ... 6
Figure 2 – An example of an ANP Model for the estimation of market share... 12
Figure 3 - The 14 studied Portuguese Airports... 17
Figure 4 – Hinterland Categorization Model ... 22
Figure 5 – Our ANP model for variable selection ... 22
Figure 6 – Example of pairwise comparisons in our model ... 23
xi
Table List
Table 1 - Use of Benchmarking ... 7
Table 2 – Review of Literature on DEA ... 7
Table 3 - The fundamental scale of the AHP and ANP ... 13
Table 4 – Categorization of Portuguese Airports ... 18
Table 5 – Hinterland Information of Portuguese Airports ... 19
Table 6 – Most used indicators in airport studies ... 20
Table 7 – Initial set of indicators for this study ... 21
Table 8 – Synthesis of the ANP model and selected variables ... 24
Table 9 – Correlation matrix of the selected inputs for DEA ... 25
Table 10 – Outputs and Inputs for DEA ... 25
Table 11 – VRS DEA results for each output selected ... 26
Table 12 – Final average score of the Portuguese Airports ... 28
Table 13 – Unweighted Super Matrix ... 34
Table 14 – Weighted Super Matrix ... 34
Table 15 – Limit Matrix... 345
xiii
List of Acronyms
ANA ANA Aeroportos, SAANAM ANAM Aeroportos da Madeira, SA
ANP Analytic Network Process
BCC Banker, Charnes and Cooper
CCR Charnes, Cooper and Rhodes
CRS Constant Returns to Scale
DEA Data Envelopment Analysis
DEAP Data Envelopment Analysis Software
DMU Decision-Making Unit
DRS Decreasing Returns to Scale
GRETL Econometrics Software
IGESPAR Institute for Heritage Protection and Management
INE National Institute of Statistics
IRS Increasing Returns to Scale
LCC Low-Cost Carriers
NUTS Nomenclature of Territorial Units for Statistics
PE Productive Efficiency
SATA SATA Gestão de Aeródromos, SA
SE Scale Efficiency
SREA Regional Service of Statistics Azores
TAP Transportes Aéreos Portugueses, SA
TE Technical Efficiency
1
PART I - INTRODUCTION AND LITERATURE REVIEW
1. INTRODUCTION
1.1. Context and Relevance of the Study
During the past thirty years, Airport’s operators have ceased to be seen as simple providers of infrastructures due to an increase in the number and diversification of new related services. Thus far, plenty of benchmarking techniques have led the regulatory and operational sides of an airport further. Most of benchmarking techniques have been used to compare airports to best-in-class performers (Francis et al, 2002). This tendency has the merit of emphasizing the categorization of airports on the basis of operating performance as the main criterion. However, airports are also key levers for the development of a region, so they can no longer be managed in isolation from the geographical area they serve. Airport impacts pose actually considerable challenges for both airport operators and the surrounding urban and regional environment (Ferreira et al, 2006).
In fact, the valuable role of airports for a region goes far beyond providing high speed access for both business and leisure travellers. Nowadays, their ability to generate jobs and attract new business is being used in many locations as a justification for public investments in further airport construction and expansion (Weisbrod et al, 1993). Also, models of regional development have used airports at different levels; for example, in a tourism-oriented model of regional development, airports bring tourists and contribute conclusively for the success of the model (Adamaki-Tzavella et al., 2008).
There is, in fact, a consensus among researchers about the existence of benefits brought by the presence of an airport in a given region. Some of these benefits are measured as catalytic effects, being defined as the net economic effects (e.g., on employment, incomes, and government finances) resulting from the contribution of air transport to tourism and trade and its long-run contribution to productivity and gross domestic product (GDP) (TRB, 2007). Furthermore, geographical constraints of airports may support the definition of individual strategies, in order to unleash their full potential (Tapiador et al, 2008).
Airports are no longer exclusive to the most developed regions. Their location and size is a strategic factor of equity among regions, notably for policy makers with concerns about regional development.
In fact, the thematic of regional development gives great importance to transport infrastructures, namely airports. Like other transport infrastructures, airports have very high sunk costs and may be subject to several expansions and maintenance works. Still, the construction of an airport may become the catalyst for a region’s development, because it assumes a strong role enabling the raise of the Gross Regional Product. Even so, some factors
2
need to take place simultaneously to ensure the contribution of airports to a region’s growth, namely:
The creation of a good infrastructure network for the airport’s supply chain;
The need and achievement of an increasing mobility of the population;
The entry in a market regulated by governments and aviation regulation agencies, and the competition with established airports;
Acceptable levels of noise and pollution, compatible with the population’s quality of life prior to the airport’s construction;
The existence of more inbound tourism than outbound tourism, in order to preserve a balanced regional growth;
The overall economic performance of the region.
Airports, given a certain scale, develop a strong time-saver role for firms requiring quick shipping, or quick business meetings, being able to put their merchandise and businessmen all over the world in a matter of hours. The benefits generated with the presence of the airport will, in turn, create spin-off-effects called ‘catalytic effects’ or ‘transportation benefits’, which will impact tourism, trade, investments on the airport or region, and productivity generated by industries, which may not work directly with the airport (Malina et al., 2008).
Notwithstanding all these assumptions, we believe that the importance of airports to regional development can also be seen as the result of hinterland influence on the operational activity of airports. In this context, Tapiador et al (2008:208) follow a complementary approach and use the term “geographical efficiency” to refer to how efficiently an airport benefits from its location. Like Tapiador, we assume that “this geographical efficiency is linked to certain key characteristics of the size of an airport's catchment area, such as population, level of economic activity, accessibility or tourism potential. Some of these variables, such as population, are linked with the traffic from the airport, whereas others, such as the tourism potential, account for potential trips to the airports.” We propose a new methodology for the evaluation of airports’ geographical efficiency based on Analytic Network Process (ANP) and Data Envelopment Analysis (DEA).
Our empirical study is based on the work of Tapiador et al. (2008), who proposed a new variant of efficiency assessment in airports. Tapiador analysed the efficiency of Spain’s airports through the application of a geographic variant of DEA instead of the more common operational indicators. The method was also applied by Hájek and Grebeníček (2010) to assess the geographical efficiency of Czech regional airports.
Distinct from these works, our study uses a DEA-ANP combination as a method for assessing the geographical efficiency of airports, applying it to the Portuguese Airports. As far as we know, the ANP method is applied for the first time to Portuguese airports studies. Also the present work adds geography to Portuguese airports benchmarking from a territorial policy view, thereby strengthening the role played by secondary airports within their respective regional economies (Tapiador et al, 2008).
3
1.2 Research questions and objectives
As stated before we assume that airports perform differently according not only to operational aspects (such as employees, size of terminal or number of gates), but also according to the inputs they use or might use from their hinterland.
But a question arises: does the airport effectively take benefits from its hinterland resources? The inverse question can also be asked, leading to a scenario where the benefits that the airport takes from its hinterland can generate, by their turn, benefits to the region, creating positive feedback loops and causality relationships which are very challenging to model and determine. A possible approach to answer to this question lies in evaluating if airports are operating efficiently according to the resources they have in their hinterland.
This approach leads to the main questions of the present study:
1.
Is the operational efficiency of airports affected by the distinctive features of their hinterland?2.
To what extent the resources and characteristics of the hinterland contribute to operational efficiency of airports?The answers to these two questions support the main objective of this research, which is: to assess the geographical efficiency of Portuguese airports based on a variable
selection model oriented to the different characteristics of the airports' hinterland, trying to identify possible significant differences between these airports.
Consequently, the best inputs and outputs must be selected to measure the geographical efficiency of Portuguese airports and the variables they are served by. The specification of the inputs is made possible using the ANP, a Multi-Criteria Decision-Making (MCDM) tool.
1.3 Structure of the research
This work is structured in two parts, each one subdivided in several chapters.
The first part, besides the introduction (Chapter 1), is related to the review of literature. Thus, the theoretical framework is first defined with the identification of relationships between airport and regional development (Chapter 2). Benchmarking theories and applications are explored to select the best suiting methodology for our study (Chapter 3). Finally, DEA (Chapter 4) and the multi-criteria decision methods like AHP and ANP models (Chapter 5) are explained and adapted to our study.
The second part is related to the empirical study. In addition to the objectives and methodology of the empirical research (Chapter 6) the Portuguese airports and their hinterland are presented and characterized (Chapter 7). After, an ANP model for hinterland variables selection is displayed, as well as a synthesis of the results (Chapter 8), which are
4
used for the DEA efficiency estimations (Chapter 9). The discussion of the empirical results (Chapter 10) precedes the last chapter (Chapter 11), where we present the final conclusions, limitations of the study and some recommendations.
2. AIRPORTS AND REGIONAL DEVELOPMENT
Rietveld (1989:255) provides a good definition of the importance of infrastructures, of any kind, on regional development:
“Regional development is not only the result of private production factors such as labour and capital but also of infrastructure. Improving infrastructure leads to a higher productivity of private production factors. Conversely, a neglect of infrastructure leads to a low productivity of the other production factors.”
Relatively to the specific nature of transport infrastructures, which are extensively said to be catalysts of regional development, Izquierdo (1997) argues that the infrastructure by itself does not generate economic development in general, neither regional development. Still, infrastructures may act as catalysts in the promotion of development benefiting from their location (European Investment Bank, 1998). Location theorists as early as von Thünen (1826) noticed that, because of the variation of transportation costs and economic rents across goods, the land uses and its use intensities will differ as we get farther from the marketplace.
Nevertheless, few have studied the effects of the airports on regional development, nor the effects of regional development on airports (Green, 2007). Brüeckner (2003) and Green (2007), applied OLS regressions to airport activity at airports’ metropolitan area to predict population and employment. Ferreira et al. (2006) argued that airports and their surrounding commercial districts are playing an increasingly important role in shaping urban and regional growth patterns, defining “airfront” as the spreading range of commercial, industrial, and transportation facilities intrinsically tied to the airport.
Since airports are no longer exclusive to the most developed regions, their location and size is a strategic factor of equity among regions, notably for policy makers with concerns about regional development. Nevertheless, regional airports can also promote regional diseconomies, for example, if passengers mostly make tourism abroad, namely if the airport clearly supports low-cost carriers (Stewart, 2009). Low-cost carriers are also bringing a great downward pressure to aviation revenues of airports (Martens and van der Zwan, 2011), causing a shift from aviation to non-aviation revenues.
For Weisbrod et al. (1993), hubs/international airports should have more freight activities, whereas passenger and business-oriented airports should have more hotels and business in the vicinity. Weisbrod confirmed the tendency for airports to generate jobs and attracting new businesses, using this argument as a justification for public investments in new
5
airport construction and expansion, but also argued that business could take up to 20 years to develop activities in the surrounding land of the airport.
Malina et al. (2008) estimated the benefits of the presence of an airport for business as the willingness to accept a fee for the closure of an airport.
The Transportation Research Board (TRB, 2008) argues that airports exert significant effects on regional demand, estimating the effects on value added, employment, income, and tax revenue that result from economic activities taking place at the airport:
Companies at the airport site (the airport operator, airlines, ground handling companies, retailers etc.) are generally important regional employers; they produce goods and services for which they need intermediate and capital goods, thus increasing regional demand;
Employees of companies at the airport site and of producers of capital and intermediate goods spend part of their income within the region, also creating additional demand.
3. THE IMPORTANCE OF BENCHMARKING AND ITS
APPLICATIONS TO AIRPORTS
Benchmarking is one of the most performed practices nowadays. The benchmarking process usually identifies the best performer in a given amount of performers, where there is possibility of drawing comparisons. This requires a similarity in the structure of the performers and their practices. Then, the results and processes of the performers studied are compared with others, allowing the identification of the best practices.
Benchmarking is valuable for three reasons: it provides basic data otherwise difficult to obtain, defines world class standards for facilities, and identifies priorities for improving the physical design at individual airports. Effective benchmarking thus focuses on objective data of capacity or performance that can be measured and observed across widely different operations, rather than on data that is either subjective derived from widely different accounting practices (Neufville and Guzmán, 1998).
In the aviation sector, benchmarking analysis is considered as one of the ways to drive airports towards the frontier of best practices (De Borger et al., 2002, cited in Barros and Dieke, 2007:184). Graham (2005) identified airlines as one of the most interested parties in the benchmarking of airports, because they design their routes taking into account the selection of the most efficient airports. Graham also discussed the interest of government regulators of airports when establishing or reviewing the regulations which they set, and investors and bankers which are interested in airport privatization may want to use benchmarking techniques to identify possible business opportunities.
6
The Airports Council International (ACI, 2006) divides two general types of benchmarking:
Partial - assessing and comparing individual processes/functions/services;
Holistic - creating a systematic approach for defining and assessing a critical set of processes/functions/services that, when taken together, indicate the relative performance of the total organization.
A common distinction in benchmarking is to treat the process as internal, self-benchmarking within an organization which compares internal performance of processes/functions/services over time (time-series), or external, which compares performance across organizations with peers or in other industries (cross-sectional) at a single point in time and through time (ACI, 2006). Von Hirschhausen and Cullmand (2006),quoted by Liebert et al, 2010:24) identified the main methodologies used for airport benchmarking, which are depicted in Figure 1.
Figure 1 - Methodologies for Airport Benchmarking
Source: Adapted from von Hirschhausen and Cullmand (2006, in Liebert et al, 2010:24)
These methods have all different applications which are convenient to distinguish. According to Hensher and Waters (1993), the main methods to generate comprehensive performance measures of efficiency are the following:
Non-parametric index number;
Parametric model estimation (OLS or SFA);
Non-parametric estimation (DEA).
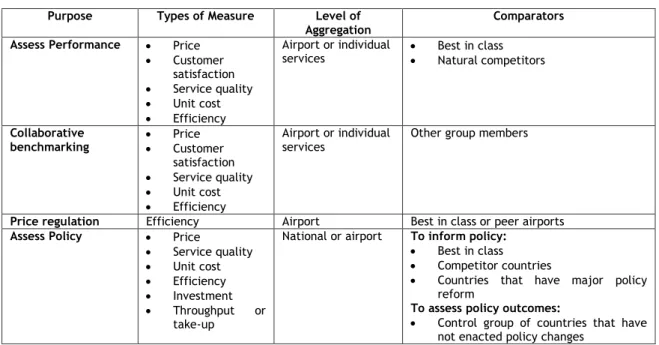
Moreover, Kincaid and Tretheway (2009) provided a comprehensive table (see table 1) of the purposes of airport benchmarking, the types of measure used, level of “aggregation”
Productivity and Efficiency Analysis One-dimensional Partial Performance Multi-dimensional Average Approaches Index-based numbers Total Factor Productivity (TFP) Parametric (Deterministic) Ordinary Least Squares (OLS) Frontier Approaches Parametric (Stochastic) Stochastic Frontier Analysis (SFA) Non-parametric (Deterministic) Data Envelopment Analysis (DEA)
7
and “comparators” of the studies, which are important for the categorization of our airport benchmarking study.
Table 1 - Use of Benchmarking
Purpose Types of Measure Level of
Aggregation Comparators Assess Performance Price
Customer satisfaction Service quality Unit cost Efficiency Airport or individual
services Best in class Natural competitors
Collaborative
benchmarking Price Customer satisfaction
Service quality
Unit cost
Efficiency
Airport or individual
services Other group members
Price regulation Efficiency Airport Best in class or peer airports
Assess Policy Price
Service quality Unit cost Efficiency Investment Throughput or take-up
National or airport To inform policy:
Best in class
Competitor countries
Countries that have major policy reform
To assess policy outcomes:
Control group of countries that have not enacted policy changes
Source: adapted from Kincaid and Tretheway (2009)
Our study inserts itself in the assessment of airport efficiency category, since it is the main object of benchmarking research, taking the best in class comparator.
4. DATA ENVELOPMENT ANALYSIS (DEA)
The application of operations research to the aviation field has been greatly expanded in the last years, mainly due to the increase in the capability of constructing non-parametric models and the increasing availability of variables. DEA has been applied extensively to measure relative efficiencies in a given set of decision-making units (such us airports), involving homogenous datasets of variables for each unit (Ulutas and Ulutas, 2009).
Table 2 joins authors who focused their studies on the use of DEA to measure the operational efficiency of airports:
Table 2 – Review of Literature on DEA
Seiford (1997) Did a DEA literature bibliography review for the years 1978-1996. Tavares (2002) Reviewed 3203 studies for the period 1978-2001.
Schaar and Sherry
(2008) Examined the difference between results in DEA studies, coming to the conclusion that, following the model used, results would change in small, medium and large scale airports. The efficiency in CCR models tended to degrade from small to medium to large scale airports, whereas in SBM models efficiency tended to degrade from large to medium to small scale airports, and BCC models showed
8
no tendency.
Humphreys and Francis (2002, cited in Barros and Dieke, 2008:1041)
Said “While there is extensive literature with DEA applied to a diverse range of economic fields, the scarcity of studies regarding European airports bears testimony to the fact that this is a relatively under-researched topic”.
Graham (2005) Investigated DEA and TFP and identified that the key advantage of DEA facing TFP is that the weights for the inputs and outputs are not pre-determined but instead are the result of the linear programming procedure. DEA is therefore a more attractive technique than the other methods because it has less demanding data requirements.
Barros and Dieke
(2008) Collected several studies related to the benchmarking of airports through DEA, using the Simar and Wilson (2007) two-stage. They observed that there is a tradition of analysing airports by separating activities into terminals and movements (Gillen and Lall, 2001, Pels et al., 2001 and Pels et al., 2003). They also observed that several papers compare the DEA model with the frontier model (Hooper and Hensher, 1997, Pels et al., 2001, 2003), while a few others combine principal component analysis with a DEA model (Adler and Berechman, 2001), or focus on stochastic frontier analysis to assess the airport’s efficiency ( Pels et al., 2001, 2003).
Pavlyuk (2012) Made an extensive review of the airport benchmarking theory and applications, namely the airport business model and all the benchmarking techniques used in the studies covered by his survey, and the spatial competition among airports.
Source: own elaboration
Many academics encountered a number of difficulties in attempting to benchmark the airports and identify the best performers in the airport sector; these difficulties arise from differences in accounting and regulatory regimes, which are subject to different ownerships and policies of airport operators, and the degree of vertical integration (Müller et al., 2009). Moreover, agents such as airlines can bring many barriers with tariffs and the access to the airport for other airlines.
DEA is an input-output tool coming from the operations research field, which focus on benchmarking efficiency through the modelling of convexities and, therefore, has not the capability to study the catalytic impact of an airport to the surrounding economy.
Still, some of the spill over effects can be contended if the geographical effect of efficiency is considered and best practice cases are compared with less efficient ones.
DEA deeply takes roots in the work of Farrell (1957). Farrell argued that the efficiency of a single firm (or unit) consists of two components: technical efficiency, which reflects the ability of a firm to obtain maximum output from a given set of inputs, and allocative efficiency, which reflects the ability of the firm to use optimal proportions, given their respective prices and production technology. These two measures are combined to provide a measure of total economic efficiency.
This work was later revised and consolidated in 1978 with the PhD thesis of Rhodes, under Cooper’s advisement, as quoted by Casa Nova and Santos (2008:135), which aimed at the technical efficiency benchmarking of a program performance for necessitous students in several schools, based on the Farrell input-output premise, whether schools adopted the
9
program or not. Charnes et al. (1978) finally computed a non-parametric procedure that compares a decision unit with an efficient frontier using performance indicators.
The model improved and resulted in the DEA CCR model (Charnes et al, 1978), published in the European Journal of Operations Research during the same year, which extends the single-input, single-output ratio measure of the efficiency of a single Decision-Making Units (DMU) proposed by Farrell to a multiple-inputs, multiple-outputs efficiency measurement. The premise of the CCR model is to compare the technical efficiency among DMUs, presenting which of the DMU is the most efficient by comparison to other DMUs. Cooper et al. (2003) define full (100%) efficiency as the maximal efficiency attained by any DMU if, and only if, none of its inputs or outputs can be improved without worsening some of its other inputs or outputs.
4.1 The CCR model
The CCR model is limited by constant returns to scale (CRS). This means that there is no assumption that any positive or negative economies of scale exist, and, as such, a small airport should be able to operate as efficiently as a large one (Schaar and Sherry, 2008). The input-oriented CCR model is generally presented as follows:
∑ Subject to: ∑ ∑ ∑
Solving the linear programming problem for each DMU, the most efficient DMUs are identified. Relative efficiencies between DMUs can be obtained solving the problem for each DMU.
4.2 The BCC model
Banker et al (1984) developed a new DEA model with variable returns to scale (VRS), also called BCC model. The input-oriented BCC model is usually written this way:
10 ∑ Subject to:
∑
∑
∑
The CCR and BCC models present different convexity areas, due to the introduction of the variable in the equation (2.1) (Casa Nova and Santos, 2008). Consequently, the efficiency indicator of the BCC model is less or equal to the CCR model efficiency indicator (Belloni, 2000) and represents a measure of Technical Efficiency rather than Productive Efficiency, due to the clearance of production scale effects in the BCC model (Casa Nova and Santos, 2008).
The relationship between indicators of both models allows extracting another measure of efficiency called Scale Efficiency (Banker et al, 1984), which results from equation (3). This efficiency enables us to identify differences in the operation of small-scale by comparison to bigger airports.
Where:
A DMU has to be simultaneously scale efficient and purely technical efficient to be considered CCR-efficient, or productive efficient (PE), whether it only has to be purely technical efficient (TE) to be considered BCC-efficient. Thus, the ratio of
CCR-efficiency/BCC-efficiency is equal to equation (3) and gives us the Scale Efficiency.
Put in practice, the scale efficiency enables us to study with more detail if airports are operating well according to their size.
11
4.3 Limitations
However, like any empirical technique, DEA is based on a number of simplifying assumptions that are well known among the academic community and are commonly acknowledged when interpreting the results of DEA studies (Seiford and Thrall, 1990):
Being a deterministic rather than statistical technique, DEA produces results which are particularly sensitive to measurement error. DEA only measures efficiency relative to best practice within the particular sample. Thus, it is not meaningful to compare the scores between two different studies;
DEA scores are sensitive to input and output specification and the size of the sample;
DEA does not perform full-ranking; instead, it merely provides classification into two dichotomic groups: efficient and inefficient (Royendegh and Erol, 2009);
The number of efficient firms on the frontier tends to increase with the number of inputs and output variables (Berg 2010).
Furthermore, DEA determines the indicator weights by mathematical approach. Several airports can be pointed as fully efficiency simply because it exists at least one indicator on those airports which is much better that the others, leading at times to an unclear understanding of the efficiency ranking (Braz et al., 2012). This is also known as the “Convergence” problem, since the efficiency of DMUs will converge to 1 (maximal efficiency). Because of this limitation, and in order to preserve a good balance between DMUs and variables, in our study an ANP model is structured to select the best variables.
5. MULTI-CRITERIA DECISION METHODS: THE AHP
AND THE ANP
Multiple-Criteria Decision Methods (MCDM) are methods used in situations where one or more criteria (e.g. cost, revenue, quality) are considered, working with a common tool named Decision Matrix, to analyse priority among given alternatives. MCDM provide useful information to decision-makers for many reasons (Braz et al, 2012):
Enabling multiple stakeholder preferences to be modelled;
Offering improved coordination and collaboration;
Implementing the integration of spatial information.
The adoption of a MCDM in our study is justified with the need of selecting the best indicators among a given set, based on a given number of criteria. Although the problem is relatively well-known among DEA users, we found no study indicating ideal ratios between DMUs and inputs/outputs. We propose a model with 3:1 of proportionality between DMUs
12
(Airports) and variables (Inputs and Outputs) to avoid obtaining too many efficient units on the frontier.
5.1 Analytic Hierarchy Process (AHP)
The ‘Analytic Hierarchy Process’ (AHP) was proposed by Saaty (1977) to model subjective decision-making problems in a hierarchical structure of goals, criteria, sub criteria and alternatives, respectively. AHP is based on pairwise comparisons between criteria and alternatives in a structured manner, in order to rank alternatives according to the answers of the decision-maker. This assumes that the decision maker can provide paired comparisons based on his knowledge and intuition. The applications of AHP can refer to corporate planning, portfolios election, and benefit/cost analysis by government agencies for resource allocation purposes.
5.2 Analytic Network Process (ANP)
The ANP (Saaty, 1996) is a generalization of the AHP, which tries to solve the independence constraint among elements in the same hierarchical level present in AHP. A network is composed of clusters, nodes and links among the nodes. Although the AHP has been introduced in the decision-making literature earlier, the AHP is a specific ANP model; hierarchies are special cases of networks in which the links point from the goal to the criteria to the alternatives. The ANP also allows an evaluation of the relative importance of its various elements by pairwise comparisons. AHP and ANP convert these evaluations to numerical values (weights or priorities), which are used to calculate a score for each alternative (Saaty, 1980). A consistency index measures the extent to which the decision-maker has been consistent in his responses.
13 Source: Super Decisions Software (demonstration model)
All concepts highlighted with a red arrow (link indicators, nodes and clusters) in Figure 2 are fundamental to understand how the model is built. The link indicators are the interactions and feedback within clusters and between clusters.
ANP provides a thorough framework that includes clusters of elements connected in any desired way to investigate the process of deriving ratio scales priorities form the distribution of influence among elements and among clusters (Saaty, 2001). Feedback can better capture the complex effects of interplay in human society.
The next step in an ANP problem is to form the networks. Then, for each network corresponding to one of the several control criteria under benefits, the priorities from paired comparison matrices are derived, and are used in super matrix. The control criteria and decision networks for input alternatives are formed. Table 3 represents the values that pairwise comparisons take with respect to a given criteria.
Table 3 - The fundamental scale of the AHP and ANP
Intensity of
importance Definition Explanation
1 Equal importance Two elements contribute equally to the objective
3 Moderate importance Experience and judgment slightly favour one element over another
5 Strong importance Experience and judgment strongly favour one
element over another
7 Very strong importance An activity is favoured very strongly over another
9 Absolute importance The evidence favouring one activity over another is of the highest possible order of affirmation 2, 4, 6, 8 Used to express intermediate
14
values
Decimals 1.1, 1.2, 1.3, …1.9 For comparing elements that are very close
Rational
numbers Ratios arising from the scale above that may be greater than 9
These ratios are used to complete the matrix if consistency were to be forced based on an initial set of n numerical values
Source: adapted from Super Decisions
While ANP is a more general form of the Analytic Hierarchy Process (AHP), used in Multi-Criteria Decision Analysis (MCDA), literature shows little difference in the applications of these methods, but the ANP allows a more in-depth a thorough analysis, enabling more complex relationships and a higher degree of adjustment to real life problems. Furthermore, the ANP allows the existence of dependency between alternatives and criteria, and their inclusion in clusters.
AHP has been applied successfully as a MCDA tool to airports, namely by Vreeker et al. (2001), evaluating airports expansions plans. Some authors applied the ANP for risk management. For example Yilmaz (2008) developed a model for airline risk management and Chen et al. (2011) developed an Environmental Risk Management model. Tsai and Kuo (2011) evaluated the airport service quality through a hybrid MCDM approach containing an ANP model.
5.3 AHP, ANP and DEA Combinations
The combination of AHP and DEA is not new, and there have been several attempts for using them in the present (Royendegh and Erol, 2008). Still, the combination of ANP and DEA is under-researched.
Royendegh and Erol (2008) recommend a DEA-ANP hybrid algorithm in order to eliminate both the ordering in the DEA model and the disadvantage of the whole hierarchy and subjective evaluations in the ANP method. Ulutas and Ulutas (2009) measured the efficiency of Turkish airports through a combined ANP-DEA model, where the ANP is used to determine the best inputs to enter the analysis. This combined analysis was pioneered by Sarkis (1999), involving the synthesis of ANP and DEA for environmentally conscious manufacturing programs. Hasan et al. (2008) also integrated ANP and DEA, but in a multi phased supplier selection approach.
AHP and ANP have also been combined a posteriori with DEA to provide efficiency rankings. Those methods are called DEAHP or DEANP according to the type of the analytic model. Research on improving and doing combinations of these methods is still on-going, as well as their issues and applications (e.g. Ramanathan, 2006; Wang and Chin, 2008; Davoodi
et al, 2012; Kejia and Xiankang, 2011). Examples of these applications include integrated
15
Through the combination DEA-ANP as a method for assessing the regional efficiency of airports, our study contributes to the literature on regional/geographical analysis and airports benchmarking.
PART II - EMPIRICAL STUDY
6. OBJECTIVES AND METHODOLOGY
6.1 Objectives of the Empirical Study
The main objective of the empirical study is to assess the geographical efficiency of Portuguese airports, while setting up a new procedure for geographical efficiency analysis. To do this, we first provide a definition and characterization of airport operators, and then we select the variables according to their relative importance with respect to location and other criteria further explained in the ANP model chapter.
The next step is providing good results from DEA and discussing them. We elaborate efficiency rankings according to the outputs selected, and we create an overall technical efficiency scorecard, to avoid the limitations of multi-output DEA estimations.
6.2 Methodology
To do a comprehensive comparison of airports, the best-in class comparison approach allowed by DEA is used. Based on our literature review of Benchmarking, the DEA best-in class approach is preferable for four main reasons:
Airports are ranked by comparison with their peers and not by their individual performance;
Airports have generally the same kind of inputs to generate their activity;
Airports can be ranked even if performing at different scales;
The data requirements are less time and money demanding than other methodologies such as catalytic impact studies or econometric regressions. This study approaches the efficiency of Portuguese airports in a procedure similar to the one used by Tapiador et al. (2008), who related the resources present in the hinterland of each airport with the volume of passengers carried at that time, allowing them to identify which resources were fully exploited and which remained underexploited. They pointed out many benefit of this analysis, mainly:
To link territorial policies to the needs of airports;
To point the criteria that Low Cost Carriers (LCCs) use to select new airport destinations;
16
To identify and conceptualize geographical constraints.
The volume of passengers carried by each airport is a potent instrument to predict or explain regional growth, as proved by Brüeckner (2003) and Green (2007), who found that passenger activity is a powerful predictor of population growth, whether cargo activity is not (Green, 2007).
In this context, the scale efficiency present in geographical study done by Tapiador et
al. is of extreme relevance to determine which airports are operating according to their
hinterland potentials.
Furthermore, some regional airports located in islands are characterized by strong tourist traffic with seasonal demand. The efficiency of these airports directly affects the quality of service offered to passengers who use it as a basic means of transport to reach their destination (Psaraki and Kalakou, 2010).
Regarding the study of Tapiador et al (2008), our study differs because we introduce the ANP model to select the best variables before entering DEA. This aims to overcome the following limitations:
The convergence problem of inputs of a DEA model with few airports (Braz et al, 2012);
The lack of homogeneity among the studied airports, or Decision-making Units (DMUs).
Once determined which inputs enter the dataset, DEA will enable us to measure the efficiency of our set of airports. Taking an operational approach in geographical/regional efficiency analysis permits to determine wastes in less efficient airports, to help predicting regional development, and to support decision making in urban planning policy.
The hinterland appeared as a term initially applied to the background of seaports. With the development of hinterland studies, the terminology separated into importer hinterland and exporter hinterland, depending on the source / destination of the goods.
In the context of airports and human geography, the term Catchment Area is a more widely used term, which corresponds to the area and population from which a city or individual service may attract visitors or customers, but still diverges from the definition of Hinterland as a provider of resources and not only a static area in the neighbourhood of the airport. Nonetheless, the catchment area proves to be a good starting point to define what has to be included or excluded from Portuguese airports’ surrounding area, and which variables are going to be selected.
Postorino (2010) defines the ‘Catchment Area’ as the area containing all the potential users and passengers of a given airport, from a geographical point of view. The later also defends that accessibility is the key to development and particularly for airports, as he relates a larger catchment area with a larger potential demand.
The size of the Catchment Area is of very high importance for passengers to choose an airport, when there are competitors within the same range. The Catchment Areas can be usually defined in two ways:
17
1. Formation around boundaries (districts) based on government regulation or other spatial assumptions.
2. Population living, as a general rule of thumb, in a time of 2 hours by bus, car or train to the airport.
We use the first definition, since we keep the hinterland to the district (when the airport is continental) or island level, because of the difficulty to compare areas of influence. We select a sample of 14 Portuguese airports with regular routes and available data collected from INE, SREA, ANA, SATA, and IGESPAR for the 2008-2010 period (2005 for IGESPAR). Other small regional airports do exist (notably the regional airports of Bragança, Évora, Vila Real and Tires), but could not be integrated in this list, since no disaggregated information is available for the years under study. For the treatment of the data we used the software’s implementations of ANP and DEA for PC, which are respectively called Super Decisions and DEAP v2.1.
7. PORTUGUESE
AIRPORTS
AND
THEIR
HINTERLAND
7.1 Presentation of the Portuguese airports
We study a heterogeneous group of fourteen airports, where nine are controlled by two State-owned companies (ANA Aeroportos, S.A. and its subsidiary ANAM, S.A. in the Madeira archipelago), four smaller airports in the Azores by a regional public company (SATA Gestão de Aeródromos, S.A.) and the “Aerogare Civil das Lajes” being owned and operated by the Azores Regional Government. Nine airports are located in the Azores Islands, two in the Madeira Islands, and three in the continent.
18
Source: Google Earth Software
7.2 Brief characterization of the Portuguese airports and their
hinterland
A primary ranking of the Portuguese airports (including the islands) is made according to the article 2005/C 312/01 of the European Commission1, which categorizes the airports
according to their passenger Volume. In table 4 we also join the operational indicators available for each airport.
Table 4 – Categorization of Portuguese Airports - operational indicators (2010)
Category Airport Number of passengers
Number of direct routes Number of airlines Number of Airplane Movements Volume of Freight Transport (tons) Volume of Mail Transport (tons) Category A (>10 million passengers/ year) Lisbon 14066545 100 28 138147 93870,6 11432,9 Category B (between 5 and 10 million passengers/ year) Faro 5342707 61 23 39629 289 0 Oporto 5279531 61 14 55432 35274,8 385,6 Category C (between 1 and 5 million passengers/ year) Santa Cruz (Madeira) 2239353 55 37 25898 6286,1 2368,3 Category D (<1 million passengers/ year) Ponta Delgada (S. Miguel) 935207 29 8 13115 5994,7 1486,8 Lajes (Terceira) 477721 2 9 9788 2187,421 1140,095 Horta (Faial) 190135 2 5 4734 800,2 279,6 Porto Santo 105628 6 5 5032 213,6 108,7 Santa Maria 87006 2 2 3362 2265,9 71,4 Pico 60133 1 3 1370 221 150 São Jorge 48541 1 2 1198 145 106 Flores 42493 1 3 1500 172,4 68,1 Graciosa 39670 1 2 1038 160 50 Corvo 4491 1 3 526 37 17
Source: ANA (2010); ANAM (2010); SATA (2010); SREA (2010), own elaboration.
The three existing continental airports carry the most passengers on the list. Beside this, 11 of the Portuguese airports are located on the islands, where they rely heavily on
1 Full text is available at
19
tourism and are subject to a certain level of seasonality. Some of those airports only provide direct destinations to one or two bigger airports with other routes. This is the case for 7 of the Azores airports and the Porto Santo airport, located in the Madeira archipelago. Even though those regional airports may not be profitable because of their scale, they also develop functions that are socially relevant (Vaz et al., 2012), most notably:
Providing a public service of extreme importance to those places where medical care is not available and which require urgent transport to bigger cities;
Increasing mobility of local populations;
Assisting the competitive edge and expansion of local markets.
To better understand the context of each airport, we collected data concerning the surrounding area of the airport.
The biggest airports have also a bigger area of influence, since they serve a bigger district or island, depending on the airport location. Lodging capacity (number of beds) and number of guests help to understand the power of attraction that each hinterland exercises over tourism and airport utilization (number of passengers carried by each airport). Table 5 resumes the collected variables.
Table 5 – Hinterland Information of Portuguese Airports (2010 or else if stated)
Airport (kmArea 2) Population Capacity Lodging
Number of Guests Classified Heritage (2005) Gross Added Value (2009) Oporto 2395 1771622 19855 1509698 429 13156373 Lisbon 2761 2248925 49733 3621859 626 36266005 Faro 5412 437643 98980 2874136 205 2331197 Porto Santo 42,5 4387 2071 54096 6 15429
Santa Cruz (Madeira) 740,7 243181 26795 922263 37 1869726
Ponta Delgada (S. Miguel) 746,8 137741 5277 216148 82 827267
Santa Maria 97,2 5555 366 9545 12 10886 Horta (Faial) 173,1 14996 955 40947 51 45183 Flores 141,7 3806 339 6778 17 11508 Pico 447,7 14168 458 17911 30 29888 Corvo 17,1 429 14 508 4 648 Graciosa 61,2 4400 203 5748 15 7396 São Jorge 245,8 9192 185 6919 16 19282 Lajes (Terceira) 402,2 56445 1461 57598 75 193534
Source: INE (2010), SREA (2010), IGESPAR (2005), own elaboration.
Faro Airport neither carries freight nor mail, aside luggage from passengers. The number of Low-Cost (LC) passengers at Faro Airport has been growing on a yearly basis, whereas for the Porto Airport, which has a prevalent freight transport function, the LC carriers operate as a complement.
20
8. AN ANP MODEL FOR HINTERLAND VARIABLE
SELECTION
8.1 Airports and hinterland indicators
Plenty of indicators have been used in the airport benchmarking process, including, most notably, operational indicators used both as inputs or outputs. Martens and van der Zwan (2011) completed a survey of 32 studies demonstrating which operational indicators were the most used (see Table 6):
Table 6– Most used indicators in airport studies
Indicator/Times used in the 32 studies
Total number of passengers ALL Airport area 7
Number of airplane movements 25 Number of luggage reclaim belts/reclaim hall area 5
Invested capital/cost of capital 14 Total runway length 5
Total number of employees 13 Total cost 5
Total sales 13 Runway area 4
Number of runways 12 Number of car parking spots 4
Total labour cost 12 Number of check-in desks 4
Terminal Area 12 Apron area 3
Operational Cost 9 Number of aircraft parking stands 3
Aviation/non-aviation revenues 8 Profitability 2
Number of gates 8 Departure Lounge area 1
Source: Martens and van der Zwan (2011)
We specify another two indicators we consider critical for the assessment of the operational efficiency of airports:
The number of direct routes present at each airport, which is critical to determine the degree of accessibility of the airport;
The number of airlines operating at a given airport, which is directly correlated with the number of routes available.
Beyond those operational indicators, Postorino (2010) characterized the main indicators for the Catchment Area: population, households' disposable income, employment, sectorial structure of employment, population age structure, distance to other airports, and existent low-cost offer.
In their seminal work on the ‘geographical efficiency’ of Spanish regional airports, Tapiador et al. (2008) included the following indicators in their analysis: population, European resident population, a leisure-related services activity index, an economic activity index, a commercial activity index, an industrial activity index, a tourist activity index, the length of railway (km), the length of roads (km) and an estimate of inter-modality (the length of motorways/dual carriageways, railways and roads).
21
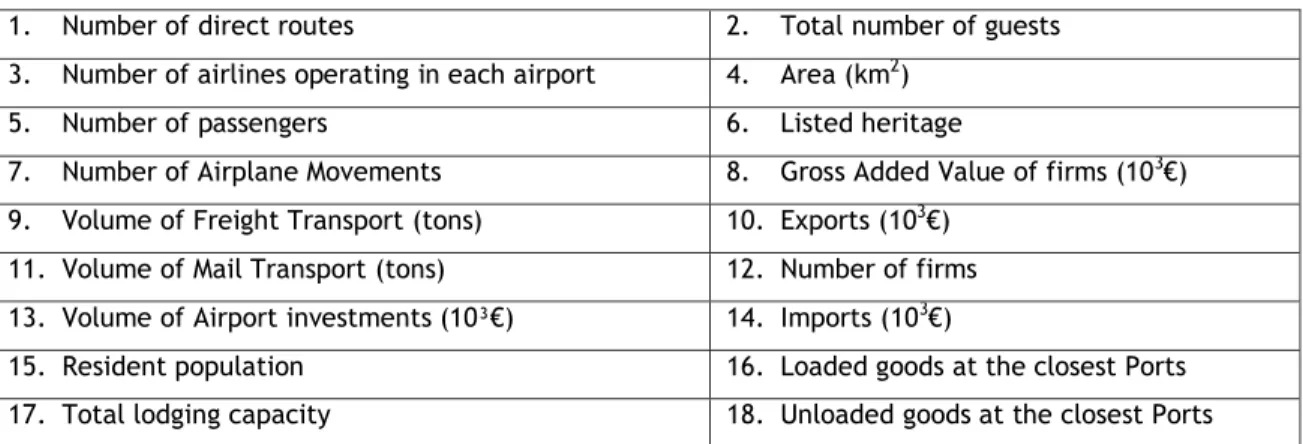
Our study aimed to include an initial set of 18 indicators, during the 2008-2010 yearly periods (2005 for Listed Heritage), for each Portuguese airport, and for each district or island they serve, when applicable:
Table 7 – Initial set of indicators for this study
1. Number of direct routes 2. Total number of guests
3. Number of airlines operating in each airport 4. Area (km2)
5. Number of passengers 6. Listed heritage
7. Number of Airplane Movements 8. Gross Added Value of firms (103€)
9. Volume of Freight Transport (tons) 10. Exports (103€)
11. Volume of Mail Transport (tons) 12. Number of firms
13. Volume of Airport investments (10³€) 14. Imports (103€)
15. Resident population 16. Loaded goods at the closest Ports
17. Total lodging capacity 18. Unloaded goods at the closest Ports
Most of the indicators were collected through the annual statistical publications of the National Institute of Statistics (INE) and its regional partners, annual accounting reports of SATA, and annual reports of ANA. Data for the listed heritage was collected at the National Institute of Heritage Management (IGESPAR). This study is limited by the following premises:
Most of the variables, notably indexes, constructed by Tapiador et al. (2008) required data not available for Portugal, at the time of this study;
The Regional Government of the Azores Islands did not release any statistical information about the airport under their management (Aerogare Civil das Lajes) at the time of this study;
The districts of Lisbon and Oporto do not match the area of the metropolitan area, neither the NUTS III nomenclature. Data at the municipality level is hard or impossible to obtain, and has to be summed with all the municipalities that belong to these districts in order to obtain the district value;
The calculation of an inter-modality index for means of transport, despite its vital importance for a balanced economic growth, had to be put aside, due to major differences between Islands and continental Portugal.
8.2 The ANP model and the selected variables
The assessment of the most important operational variables of airports to be included in an efficiency measurement is an issue that Ulutas and Ulutas (2009), with their ANP-DEA hybrid approach, tried to overcome.
The adoption of the ANP in our study is justified with the need to select the best indicators among a given set, based on a given number of criteria, and to overcome the “convergence”
22
problem with DEA models referenced before, in order to build a model with a 3:1 level of proportionality between DMUs (Airports) and variables (Inputs and Outputs).
The next figure (Figure 4) depicts the selected dimensions: clusters in blue and nodes listed next, which require to be ranked according to their appropriateness for the problem under study. Favourable concerns are called opportunities while unfavourable ones are called risks.
Figure 4 – Hinterland Categorization Model
Source: own elaboration
Figure 5 – Our ANP model for variable selection
•DEMAND SATURATION •ECONOMIC INSTABILITY •SEASONALITY •HIGH COST •ENVIRONMENT •ACCESSIBILITY INCREASE •AIRPORT DEVELOPMENT •STAKEHOLDERS' INTEREST •LOW-COST OFFER •BUSINESS •INDUSTRY •TIME ACCESSIBILITY •NATURAL RESOURCES •COMPETITION WITH OTHER TRANSPORT MEANS •LISBON •OPORTO •FARO •MADEIRA ISLANDS •AZORES ISLANDS
LOCATION
OF AIRPORTS
CONTROL
CRITERIA
RISKS
23 Source: Super Decisions Software; own elaboration.
We use the ‘Location of Airports’ as the main driver to identify which of the variables are the most important. The ‘Control Criteria’ is the second most important factor, followed by the ‘Opportunities’ and ‘Risks’. Those categories are used as clusters in our ANP model to replicate the model depicted in the Figure 4, whereas the criteria are used as nodes. Thus the Figure 4 resumes the elements of our ANP model, and Figure 5 shows the final model as it is shown in the Super Decisions Software.
Figure 6 – Example of pairwise comparisons in our model
Source: Super Decisions Software; own elaboration.
Figure 6 indicates a sample of pairwise comparisons made in the Super Decisions Software. All the pairwise comparisons, or derived priorities, are resumed the unweighted
24
supermatrix (Table 13, p.33). In the ANP component blocks of the supermatrix are multiplied by constants so that the columns will sum to 1, resulting in the weighted supermatrix (Table 14, p.33). Another matrix called limit supermatrix (Table 15, p.34) contains the final results, the priorities for the alternatives, as well as the overall priorities for all the other elements in the model, including the cluster matrix. The cluster matrix represents the derived priorities from comparisons between clusters (Table 16, p.34).
We use the ‘ratings’ function present in the Super Decisions software to classify variables according to criteria present in our ANP model. We rank them from 1 as ‘preferable’ to 17 as ‘non preferable’. Rank 1 gets 17 points and rank 17 gets 1 point.
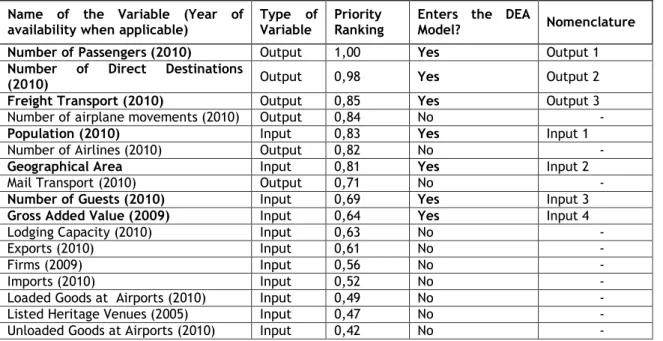
Table 8 features the results of the ANP model, including the selected variables to enter the DEA model. Variables are separated as ‘output’ when they are related to the operation of an airport, and ‘input’ when they are related to the hinterland.
Table 8 – Synthesis of the ANP model and selected variables
Name of the Variable (Year of
availability when applicable) Type of Variable Priority Ranking Enters the DEA Model? Nomenclature
Number of Passengers (2010) Output 1,00 Yes Output 1
Number of Direct Destinations
(2010) Output 0,98 Yes Output 2
Freight Transport (2010) Output 0,85 Yes Output 3
Number of airplane movements (2010) Output 0,84 No -
Population (2010) Input 0,83 Yes Input 1
Number of Airlines (2010) Output 0,82 No -
Geographical Area Input 0,81 Yes Input 2
Mail Transport (2010) Output 0,71 No -
Number of Guests (2010) Input 0,69 Yes Input 3
Gross Added Value (2009) Input 0,64 Yes Input 4
Lodging Capacity (2010) Input 0,63 No -
Exports (2010) Input 0,61 No -
Firms (2009) Input 0,56 No -
Imports (2010) Input 0,52 No -
Loaded Goods at Airports (2010) Input 0,49 No -
Listed Heritage Venues (2005) Input 0,47 No -
Unloaded Goods at Airports (2010) Input 0,42 No -
Source: Super Decisions, own elaboration
We adopt the 3:1 rule of thumb for the selection of variables according to the number of DMUs under study to avoid convergence. As we study fourteen DMUs, variables (inputs and outputs) will be four (3 inputs + 1 output) to enter the DEA model. We do DEA with each of the outputs selected, resulting in 3 different DEA, which results are different as if one DEA model with 3 outputs + 3 inputs was done (that model would not respect the proportionality and would give most of the DMUs on the efficient frontier).
The correlation matrix of the selected inputs is depicted in table 9. The correlation matrix is usually used to explore the linkage between variables. This correlation matrix was made with the econometrics software GRETL.
25
Table 9 – Correlation matrix of the selected inputs for DEA
Population Area Number of Guests Gross Added Value
Population 1.0000 0.5763 0.8139 0.9379
Area 1.0000 0.8798 0.4663
Number of Guests 1.0000 0.8037
Gross Added Value 1.0000
Source: own elaboration
We can see an overall very high correlation between the selected inputs, with exception to the population-area and area-gross added value correlations.
9. EMPIRICAL DEA MODEL AND AVERAGE SCORE
TABLE
As stated in Chapter 5, the DEA model to be used in this study is a VRS input-oriented model. The software DEAP version 2.1 is used to obtain the DEA estimations (Coelli, 1996). Table 10 presents the ANP’s selection of inputs and outputs to be used in the DEA estimations.
Table 10 – Outputs and Inputs for DEA
Airport D M U Out 1 - Pax Out 2 – Dest Out 3 - Cargo Input 1 - Pop Input 2 - Area Input 3 - Guests Input 4 - G.A.V. Oporto 1 5279531 61 35274,8 1771622 2395 1509698 13156373 Lisbon 2 14066545 100 93870,6 2248925 2761 3621859 36266005 Faro 3 5342707 61 289 437643 5412 2874136 2331197 Porto Santo 4 105628 6 213,6 4387 42,5 54096 15429 Santa Cruz (Madeira) 5 2239353 55 6286,1 243181 740,7 922263 1869726 Ponta Delgada (S. Miguel) 6 935207 29 5994,7 137741 746,8 216148 827267 Santa Maria 7 87006 2 2265,9 5555 97,2 9545 10886 Horta (Faial) 8 190135 2 800,2 14996 173,1 40947 45183 Flores 9 42493 1 172,4 3806 141,7 6778 11508 Pico 10 60133 1 221 14168 447,7 17911 29888 Corvo 11 4491 1 37 429 17,1 508 648 Graciosa 12 39670 1 160 4400 61,2 5748 7396 São Jorge 13 48541 1 145 9192 245,8 6919 19282 Lajes (Terceira) 14 477721 2 2187,42 56445 402,2 57598 193534