ABSTRACT: It is very important to control the characteristics of a polymer used in rubber compositions and paints in aerospace applications. Hence, the development of simple and fast methodologies that allow the identiication of these compositions becomes attractive to researches carried out in this area. This study has evaluated infrared (IR) techniques, such as transmission, universal attenuated total relection (UATR), and attenuated total relection (ATR), for the characterization of elastomers and paints. It takes into consideration the characteristics of surface techniques, such as the depth of penetration of the IR beam into the sample. The presence of additives in low concentrations on paints was only detected by UATR after grinding the components. Results show that it is possible to differentiate rubber mixtures with similar IR spectra and to detect small amounts of additives in the surface of coatings.
KEYWORDS: Rubbers, paints, infrared, FT-IR, ATR, UATR.
Infrared Spectroscopy Applied to Materials
Used as Thermal Insulation and Coatings
Natália Beck Sanches1, Ricardo Pedro1, Milton Faria Diniz2, Elizabeth da Costa Mattos2,Silvana Navarro Cassu2, Rita de Cássia Lazzarini Dutra2
INTRODUCTION
Polymers are used in many industrial areas, such as the aerospace (Dutra et al., 2002; Oliveira et al., 2011). heir diferent types, with speciic characteristics, are used in propellant (Sciamareli et al., 2012), composites, rubbers (Ferrari et al., 2012; Santos et al., 2013), and coatings (Blackford, 1999).
he resin most oten utilized in aerospace applications is hydroxyl terminated polybutadiene (HTPB), which is used in propellants and lexible insulation protection (Lourenço et al., 2006; Crespim et al., 2007). It is known that phenolic resins are employed in composites for rigid thermal insulation, while epoxy are used in adhesive compositions for these same protections and in polymer arrays for the aeronautical sector (Pardini, 2000). Rubbers are used in lexible thermal insulation, and the most cited ones in literature for using in aerospace applications are copolymers of acrylonitrile and butadiene (NBR) and ethylene-propylene-diene rubber (EPDM) (Moraes et al., 2007).
Traditionally, aircrat paints are coatings with speciic characteristics and requirements, because in extreme cases the use of a defective one may contribute to injuries in a catastrophic scale (Blackford, 1999). he requirements are associated with the environment in which modern aircrats are used and how they are painted, among other factors. hus, there are signiicant diferences in formulations used for the aerospace sector compared to other industrial areas, allowing the use of products that can cause damage to people’s health, such as chromate pigments, or to the environment, like large amounts of solvents.
1.Instituto Tecnológico de Aeronáutica – São José dos Campos/SP – Brazil 2.Instituto de Aeronáutica e Espaço – São José dos Campos/SP – Brazil
Author for correspondence: Rita de Cássia Lazzarini Dutra | Praça Marechal Eduardo Gomes, 50 – Vila das Acácias | CEP 12.228-904 São José dos Campos/SP – Brazil | Email: [email protected]
Generally, solvents are used to decrease viscosity and facilitate the application of paints. The vehicle or binder is the chemical component that will generate a film on the surface, besides being responsible for keeping the other constituents scattered and clumped. Fillers are materials that provide specific properties to paints, for example, the magnetic nanoparticles that turn aircrafts non-detectable to radars. The additives are compounds used from storage to product application. For example, microbicides preserve the paint during its storage and catalysts reduce the time of film formation during product application (Mello et al., 2012).
With regard to the analysis of polymers used in the aerospace industry, there are studies in the literature (Sanches et al., 2006; ASTM D3677-10, 2010; Romão
et al., 2006; Hori et al., 1990) that employ mid infrared (MIR) spectroscopy for identification, characterization, and quantification of materials. In these investigations, analyses of materials using Fourier transform infrared (FT-IR) techniques with variation of the parameters, in different layers of the surface, were not explored.
It is also known that some components present in paints cannot be directly analyzed by using conventional FT-IR techniques, because the characteristic bands overlap with absorptions of other components often seen in high concentrations. Although the study of bands overlapping could be done by using mathematical methods, such as derivatives and deconvolution to quantify components, these ones, in some cases, are complex and depend on the thickness of the analyzed samples. This limitation becomes even more relevant when additives are present in extremely low concentrations. A specific methodology must then be studied.
The FT-IR literature emphasizes that, in the analysis of multiple components systems, there are factors to be considered: influence of sample preparation, total or partial analyses of composition (Allen, 1992; Dutra et al., 1995), and the technique used to obtain the spectrum, single or coupled (Mattos et al., 2004; Almeida et al., 2002; Mateo et al., 2009). In these cases, it is helpful to perform the evaluation of characteristic functional groups, the query to the database of reference spectra (Smith, 1979) using spectra software (Szafarska et al., 2009), and the interpretation of similar studies to highlight the limitations and potential of techniques (Miliani et al., 2002).
Diferent FT-IR techniques may be suitable for the study of many kinds of materials, according to their characteristics. he most common surface technique is the attenuated total relection (ATR), which can be used for the analysis of liquid and dried paint ilms (Mazzeo et al., 2007; Zhang
et al., 2009). In the ATR spectroscopy, the radiation passing through the crystal relects totally on its internal surface (Waltham, 2005). When a radiation absorbing material is placed in contact with a crystal, the infrared (IR) beam penetrates the thin layer of the sample surface and loses energy, causing the attenuated total relectance. In this technique, good contact between the sample and the crystal is essential (Pandey and Kulshreshtha, 1993).
he penetration depth of the IR beam into the sample depends on the IR radiation angle of incidence, the radiation wavelength, and the refractive indices of the crystal and sample. Ge crystals are able to analyze thinner surfaces (Pandey and Kulshreshtha, 1993). In the ATR technique, diferent species of the sample surface and interior can be revealed depending on the analysis procedure. he literature reports (Pandey and Kulshreshtha, 1993; PerkinElmer, 2005) and experiences indicate that this aspect must be considered if the study requires selective analysis of the very supericial layer.
Ultimate FT-IR techniques, such as the universal ATR (UATR), have found prominence in the analysis of diferent materials (PerkinElmer, 2005; Abidi and Hequet, 2005). his technique of internal relection is able to perform nondestructive analysis of solids, powders, liquids, and gels. In it, the IR beam passes through an ATR element composed of ZnSe (refractive index 2.67) or diamond-KRS-5 (refractive index 2.42), with high refractive index, and reaches the surface of the sample.
One of the prerequisites of the UATR technique is good contact between the crystal and the sample surface. The probe strength can be adjusted to obtain the most suitable contact, since different pressure levels influence directly on the intensities of the obtained spectra. Because the IR beam does not penetrate deeply into the sample, this technique is suitable for analyzing surfaces with thickness of only a few microns (Pandey and Kulshreshtha, 1993).
enable rapid identiication of the diferent materials used in the aerospace industry. he aim of this work was to show the new results obtained by the Chemical Department of the Instituto de Aeronáutica e Espaço (AQI/IAE), in the characterization of diferent types of materials by using FT-IR relection techniques, such as ATR and UATR. In addition, the transmission FT-IR technique was applied to identify rubber mixtures.
EXPERIMENTAL
The nitrile rubber (NBR) and rubber mixtures used in this study were prepared in AQI/IAE. The paint and additives were provided by Rohm and Haas. The chemical structure of the additives carbendazim (2-methoxycarbonylamino-benzimidazole), Diuron (N’-(3,4-dichlorophenyl)-N, N-dimethylurea)) and OIT (2-N-octyl-4-isothiazolin-3-one) is shown in the text. Portions of the samples, before and after extraction with acetone, were also subjected to Beilstein and acid-resistance tests (Dutra and Diniz, 1993). A treatment with heated ortho-dichlorobenzene was performed as well.
EVALUATION OF TRANSMISSION AND REFLECTION FT-IR TECHNIQUES FOR CHARACTERIZATION OF RUBBERS
NBR was analyzed qualitatively by transmission, preparing the sample by pyrolysis (Smith, 1979) after extraction in methanol for eight hours, using the liquid film technique. For the UATR analysis, the NBR sample was placed in contact with the surface of the crystal and a force of 80 N was applied with the aid of an articulated arm. For ATR (KRS-5 or Ge) analysis, the NBR sample was placed on both sides of the crystal. In this study, KRS-5 (TlBr-crystal mixture TlI) with refractive index 2.4 and Ge with refractive index 4.0 crystals were utilized. The filler was analyzed by transmission, preparing the specimen with the KBr disc technique.
EVALUATION OF TRANSMISSION FT-IR TECHNIQUES FOR CHARACTERIZATION OF RUBBERS AND THEIR MIXTURES
An unknown mixture of rubbers was analyzed qualitatively by transmission, preparing the sample by pyrolysis ater extraction for eight hours in acetone, using
the liquid ilm technique (Smith, 1979). All analysis were performed using the spectrometer Spectrum One PerkinElmer (resolution 4 cm-1, gain 1, spectral range 4000–
400 cm-1, 40 scans).
UATR ANALYSIS OF PAINTED SURFACE
A paint ilm was applied on a lat glass substrate. Ater drying, the ilm was removed by scraping and then analyzed. he paints additives were analyzed directly, without the need of sample preparation. UATR analysis was performed using the spectrometer Spectrum One, PerkinElmer, DTGS detector (resolution 4 cm-1, spectral range 4000–550 cm-1,
gain 1, 20 scans). Spectra were obtained using the accessory UATR and applying a force of 80 N.
RESULTS AND DISCUSSION
This section presents the evaluation of FT-IR techniques for the analysis of elastomers and paints, using methods traditionally applied and developed in AQI/IAE laboratories.
APPLICABILITY OF TRANSMISSION AND REFLECTION FT-IR TECHNIQUES FOR CHARACTERIZATION OF RUBBERS
It is known that conventional FT-IR techniques can be applied to the characterization of rubbers (Matheson
et al., 1994; Wake et al., 1983; Williams and Besler, 1995). In this work, different information is obtained by using independently transmission (liquid phase of pyrolyzate) and reflection (ATR and UATR) techniques. These were used for the characterization of the polymer and the filler, respectively.
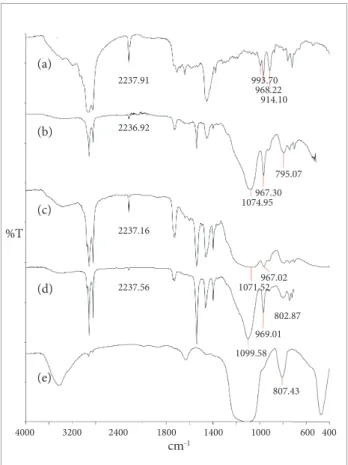
Figure 1 shows the FT-IR spectra obtained from NBR analysis by using diferent techniques. It is observed that the analysis of the liquid phase of the pyrolyzate resulted in a spectrum (Fig. 1a) with the base polymer characteristic absorptions. he band observed at 2237 cm-1 is assigned to
the stretching of the C-N group, and the peaks in the region of 1000–900 cm-1 are assigned to the wagging bending vibration
of vinyl and trans C=C groups. In the spectra obtained by relection using diferent crystals (Figs. 1b, 1c and 1d), the band at 2237 cm-1 showed lower intensity and there was a
the latter related to the load used in the formulation (Smith, 1979). Figure 1e shows these load-related bands, analyzed by transmission (KBr pellet), at er rubber calcination.
Although the spectra obtained by using rel ection techniques did not clearly evidence the absorptions of NBR, they were able to indicate the i ller used in the formulation. In order to obtain the same i ller related information by using transmission techniques, it is necessary to apply supplementary sample preparation techniques, such as KBr pellet at er rubber calcination.
h e use of rel ection techniques can also be applied to the detection of silica i ller in silicone rubbers, instead of using a large number of techniques to achieve the same goal. h is is important because applying some sample preparation techniques for transmission analysis, such as calcination, can induce the formation of silicon oxide in this type of rubber.
It might lead to misinterpretation, since not all silicone rubbers have silica as i ller.
APPLICABILITY OF FT-IR TRANSMISSION TECHNIQUES FOR THE CHARACTERIZATION OF RUBBERS AND THEIR MIXTURES
As it is known, pyrolysis of rubbers without solvent extraction is performed only to determine the base polymer and the best solvent for its extraction. Because additives bands are also observed, it is necessary to extract the rubber sample in order to obtain a spectrum that shows only characteristic bands of the polymer (Smith, 1979; Wake et al., 1983). The identification of rubber mixtures by using FT-IR is possible, providing that their characteristic bands are different, without the occurrence of overlapping.
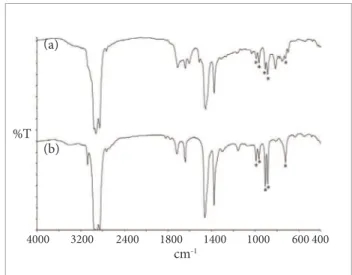
Figure 2 illustrates the application of the FT-IR transmission technique (pyrolysis without control of temperature) to an unknown mixture of rubbers, with and without extraction.
The main absorptions observed in the spectrum of the pyrolyzed rubber without extraction (Fig. 2a) and their attributions (Smith, 1979) are: 1376 cm-1,
angular bending vibration (δ) of CH
3 groups; 991
and 909 cm-1, wagging bending vibration (ω) of vinyl
group; 964 cm-1, wagging bending vibration of trans
groups; and 887 cm-1, wagging bending vibration of
vinylidene groups. These absorptions positions, shapes, and intensities suggest the presence of EPDM and/or NR (poly cis-isoprene or natural rubber) elastomers, which requires the use of acetone solvent for removal of the plasticizer and other additives (Wake et al., 1983).
The sample was extracted for eight hours in Soxhlet apparatus, using acetone as the solvent. Then, it was pyrolyzed and analyzed as a liquid film (Fig. 2b). The same main bands were observed, as expected, because plasticizers used in EPDM and NR formulations are apolar and their groups do not contribute with different absorptions in the spectrum of the pyrolyzates without extraction. The band at 887 cm-1 is characteristic of NR rubber, but it is
also present in the EPDM rubber. To further elucidate the chemical structure of the sample, a comparison was made between the IR spectrum of this sample and that of known EPDM and NR rubbers, pyrolyzed after extraction in acetone (Figs. 2b and 2c).
Figure 1. FT-IR spectra obtained from analysis of the nitrile rubber through different techniques: (a) Nitrile rubber transmission pyrolyzed (liquid i lm), (b) Nitrile rubber – UATR, force 80, (c) Nitrile rubber – ATR/KRS-5, (d) Nitrile rubber – ATR/Ge, and (e) residue obtained after calcination of rubber on Bunsen burner – transmission, KBr pellet.
(a)
2237.91 993.70
968.22 914.10
(b)
(c)
%T
(d)
(e)
cm-1
4000 3200 2400 1800 1400 1000 600 400 2236.92
1074.95967.30 795.07
2237.16
967.02 1071.52 2237.56
802.87
969.01
1099.58
To better identify the EPDM bands, it was also applied a treatment with hot ortho-dichlorobenzene to the sample, which was then pyrolyzed to obtain the IR spectrum. h e resultant IR spectrum (Fig. 3a) showed more clearly the presence of EPDM rubber (bands marked with an asterisk), as can be visualized in Fig. 3b.
The Beilstein test was performed before and after extraction in acetone to confirm the absence of halogen compounds, expected because EPDM and NR do not present halogens in their compositions. The negative result corroborates the hypothesis of the presence of these elastomers.
h e acid-resistance test, which basically classii es the rubber resistance when treated with an acid mixture at 40°C and 70°C, was also performed in the sample to elucidate the mixture composition. h e sample did not show degradation at 40°C in the time established for the test, i.e. 15 minutes (Dutra and Diniz, 1993). At 70°C, it was observed degradation in around three minutes, coni rming that the rubber has a certain content of EPDM. If the sample contained only NR, it would resist for only a few seconds, for less than one minute.
Figure 2. FT-IR spectra of (a) sample pyrolyzed without extraction, (b) sample pyrolyzate after extraction with acetone, (c) spectrum of known EPDM, pyrolyzed after extraction with acetone, and (d) spectrum of known NR, pyrolyzed after extraction with acetone.
(a)
(b)
(c) %T
(d)
cm-1
4000 3200 2400 1800 1400 1000 600 400
(a)
(b) %T
cm-1
4000 3200 2400 1800 1400 1000 600 400
Figure 3. FT-IR spectra of (a) pyrolyzed insoluble portion, after ortho dichloro benzene treatment (previously extracted in acetone for eight hours), and (b) pyrolysed EPDM (reference).
Basically, FT-IR analysis of the liquid pyrolysis products, associated with Beilstein and acid resistance tests (Dutra and Diniz, 1993), within the detection limits of the FT-IR technique, indicated that the unknown rubber consists of NR and EPDM.
h e utilization of acid-resistance test to characterize rubber mixtures (Dutra and Diniz, 1993), also developed in IAE/AQI, is important especially in EPDM mixtures. h is elastomer is considered as a replacement for NBR in the aerospace industry. h e addition of NR in a rubber mixture may be intended to lower the cost, but it certainly af ects properties. Hence, we can conclude that appropriate methodologies for the quality control of materials, contemplating the application of dif erent tests and analyses, are fundamental to achieve the outlined goals, essentially in the aerospace industry, where materials require specii c properties.
APPLICABILITY OF TRANSMISSION AND REFLECTION FT-IR TECHNIQUES FOR CHARACTERIZATION OF PAINTS
As mentioned, aeronautical coatings may contain hazardous products, such as chromate pigments (Blackford, 1999). The identification of chromate anions (CrO42-)can
be performed by IR spectroscopy in the region of 800 to 900 cm-1 (Smith, 1979).
photo acoust ic detect ion (PAS) FT-IR techniques in an article published by the IAE/AQI group (Campos et al., 2003). It was observed that FT-IR techniques are able to indicate the catalyst method of synthesis. This is possible by using surface analysis techniques, with different degrees of sampling depth, without the need for other characterization methods. Therefore, the techniques used in this study (Campos et al., 2003) have emerged as new alternatives for characterizing other types of catalysts or materials containing these kinds of compounds, such as chromium-based anions.
Certain additives, as OIT, diuron, and carbendazim, are added in small contents to preserve coatings during storage (Mello and Suarez, 2012). In this study, the methodology of chromium-based compounds (Campos et al., 2003) was applied to the analysis of paints, with dif erent degrees of sampling depth.
ANALYSIS OF PAINTS BY UATR
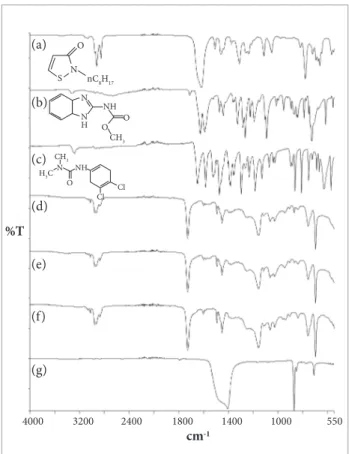
Figure 4 shows the UATR spectra of additives OIT, carbendazim, and diuron, painted with and without preservatives, dried resin, and filler.
The main bands observed in the FT-IR spectrum of OIT (Fig. 4a) are: 2924, 2855 and 722 cm-1 (stretching
and rocking bending vibration of the CH2 aliphatic group), 1618 cm-1 (stretching of the C=O group), as well
as at 1263 and 781 cm-1 (vibration of five-membered
heterocyclic ring). The spectrum of carbendazim (Fig. 4b) showed bands at: 3320 cm-1 (stretching of
N‒H secondary group), 1710 cm-1 (stretching of C=O
group), 1627 cm-1 (stretching of the C=O group and
of the C=N 5-membered heterocyclic ring), 1591 cm-1
(stretching of the C‒C aromatic and C=N groups), 1266 and 1093 cm-1 (stretching of the C‒O group), and
726 cm-1 (vibration of five-membered heterocyclic ring
and of the C‒H aromatic substitution group).
The spectrum of the additive Diuron (Fig. 4c) shows bands at: 3280 cm-1 (stretching of the N‒H group),
1651 cm-1 (stretching of C=O and C=N groups), 1584 cm-1
(stretching of the C-C aromatic group), 1473, 1298 and 1186 cm-1 (stretching of the C‒N group), 1132 cm-1
(wagging of C‒Cl aromatic group), as well as 864 and 813 cm-1 (bending vibration of the CH‒tri-aromatic
substitution group) (Smith, 1979; Silverstein et al., 2005.
h e additives OIT, carbendazim and diuron presented intense peaks that could be potentially used as analytical bands. However, the direct analysis of these compounds in the paint, by using UATR, was not possible because spectra of the paint, without (Fig. 4d) and with (Fig. 4e) preservatives are virtually identical. h e resin (Fig. 4f) and i ller (Fig. 4g) are present in high concentrations, so these ingredients could be the major interferences to the direct analysis. In fact, the main bands observed are associated with the resin (Fig. 4f): 1728 cm-1 (stretching of the C=O
group), 1159 cm-1 (stretching of the C‒O group), and 698 cm-1
(bending vibration of C‒H aromatic substitution group). Although the characterization of preservatives in the surface of paints by UATR was not possible in the studied conditions, it is known that they are added to the compound to control proliferation of microorganisms (Lindner, 2005). Thus, we can suppose that some content of preservatives is present on the i lm surface.
Figure 4. UATR spectra of: (a) OIT, (b) carbendazim, (c) diuron, (d) paint without preservatives, (e) paint with preservatives, (f) dry resin, and (g) calcium carbonate.
(a)
(b)
(c)
(d)
(e)
(f)
(g) %T
3200 2400 1800 1400 1000 550
4000
cm-1
nC8H17 O
S N
N
N H
NH O O
CH 3
CH3
Cl O
NH
Cl N
H
It is known that the difusion phenomenon is a process that depends on the size of the involved particles. he rate of difusion is inversely proportional to the size of the particle. Hence, a smaller particle will difuse faster and migrate easier to the surface. Preservatives were grinded to obtain diferent particle sizes. hese samples were studied to investigate the efect of particle size on surface analysis results.
EVALUATION OF THE INFLUENCE OF PARTICLE SIZE IN THE DETECTION OF PRESERVATIVES AT THE PAINTED SURFACE BY UATR
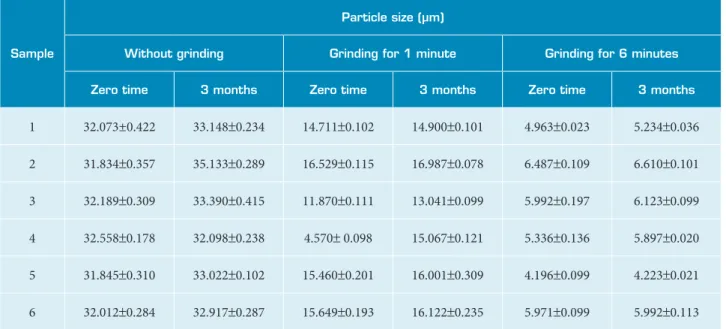
Results of grinded preservatives are presented in Table 1 and show that preservatives reduce their size up to one ith, when grinded for six minutes. he values represent the average of two determinations. Stabilizers (wetting agents and dispersants) were added to the samples to prevent agglomeration of crystals. Although the resulting particle sizes are very close, there seems to be a tendency of increasing the particle size with time, indicating agglomeration of particles (Welin-Berger and Bergenstahl, 2000). his increasing is negligible compared to the magnitude and extent of the uncertainty in its determination, and therefore it was neglected.
The smaller the particle size, the most effective the preservative should be in the microbiological control.
The explanation for this is that with smaller particle sizes, preservatives cover a larger surface area and can be used in lower concentrations. In smaller sizes, these additives also migrate more easily to the surface, becoming more bio-available to control microbes.
UATR ANALYSIS AFTER GRINDING OF PRESERVATIVES
The UATR paint spectra, with and without preservatives and grinding, compared to UATR reference spectra of the additives (OIT, diuron, and carbendazim), are shown in Fig. 5. The band with low intensity around 3320 cm–1 (N‒H group), detected in the spectra of paints
containing grinded preservatives (specially the six-minute grinded sample), and the peaks at 1625 cm-1 (C=O group
and C=N 5-membered heterocyclic ring), and around 1330 cm-1 (C–N group), may indicate the presence of
carbendazim. The absorption around 1625 cm-1 might
have also contributed to the OIT bands around 1620 cm-1
(C=O group). The band around 870 cm-1 (C–H aromatic
substitution group) might be from the additives diuron and/or carbendazim, and the absorption observed at 782 cm-1 (vibration of five-membered heterocyclic ring),
from the additive OIT.
Table 1. Particle sizes of preservatives.
Sample
Particle size (µm)
Without grinding Grinding for 1 minute Grinding for 6 minutes
Zero time 3 months Zero time 3 months Zero time 3 months
1 32.073±0.422 33.148±0.234 14.711±0.102 14.900±0.101 4.963±0.023 5.234±0.036
2 31.834±0.357 35.133±0.289 16.529±0.115 16.987±0.078 6.487±0.109 6.610±0.101
3 32.189±0.309 33.390±0.415 11.870±0.111 13.041±0.099 5.992±0.197 6.123±0.099
4 32.558±0.178 32.098±0.238 4.570± 0.098 15.067±0.121 5.336±0.136 5.897±0.020
5 31.845±0.310 33.022±0.102 15.460±0.201 16.001±0.309 4.196±0.099 4.223±0.021
CONCLUSIONS
h e evaluation of IR techniques for the characterization of elastomers and coatings indicated that:
• Transmission and rel ection techniques applied to the same rubber sample, NBR in this study, can provide dif erent information, highlighting only the base polymer characteristic absorptions (by pyrolysis/transmission) or the i ller ones (by KBr pellet/transmission and ATR or UATR/ rel ection). h is methodology can be applied to other types of rubber, particularly silicone formulations that might or might not contain silica i ller. h is aspect can be easily verii ed by using rel ection analysis (ATR or UATR). • The studied EPDM/NR mixture can be identified only
by using the pyrolysis technique and after treatment
with ortho-dichlorobenzene. This method is suitable only for mixtures whose characteristic bands do not overlap.
• h e UATR technique, without grinding of preservatives, did not allow the direct analysis of the painted dry i lm, for the samples analyzed. However, at er the preservatives had been grinded, it was possible to observe bands around 3300 and 1330 cm-1 (carbendazim), 1625 cm-1
(carbendazim and/or OIT), 870 cm-1 (diuron and/or
carbendazim), and 782 cm-1 (OIT).
• By using different FT-IR techniques, the preservatives carbendazim and OIT allow better visualization of the painted surface after grinding, because of their characteristics bands (medium and intense bands of functional groups and/or higher diffusion).
(a)
(b)
%T
cm-1
4000.0 3600 3200 2800 2400 2000 1800 1600 1400 1200 1000 800 550.0 (c) (d) (e) (f) (g) 2957.39 2930.51 2873.42 2957.01 2930.80 2873.19 1452.86 1493.69 1395.26 1728.47 1601.93 1583.23 1252.76 1159.36 1066.54 759.71 1795.31 1728.96 1601.88 1408.62 1159.69 1257.61 1028.28 871.57 759.48 3320.50 3027.67 2956.15 2927.11 2856.86 3319.83 3027.60 2955.09 2926.47 2856.13 3074.70 2954.54 2924.78 2855.15 3319.70 2949.32 3279.67 2935.22 1795.22 1729.59 1626.65 1404.82 1266.11 1161.51 1027.42 782.48 871.43 1794.20 1728.37 1622.93 1409.04 1327.70 1266.68 1225.96 1180.13 1028.24 871.71 782.55 725.39 753.61 1618.85 1509.07 1464.40 1313.50 1263.10 1238.04 1114.10 1052.82 781.60 722.72 752.84 1711.28 1627.69 1591.37 1474.48 1442.17 1327.22 1266.65 1224.83 1093.87 955.80 869.84 791.79 726.86 1651.43 1584.74 1523.98 1406.55 1234.71 1268.47 1186.68 1132.151027.05 864.76 755.55 724.52
REFERENCES
Abidi, N. and Hequet, E., 2005, “Fourier Transform Infrared analysis of trehalulose and sticky cotton yarn defects using ZnSe-Diamond UATR”, Textile Research Journal, Vol. 75, No. 9, pp. 645-652.
Allen, T.J., 1992, “Paint sample presentation for Fourier transform infrared microscopy”, Vibrational Spectroscopy, Vol. 3, No. 3, pp. 217-237.
Almeida, E., Balmayore, M. and Santos, T., 2002, “Some relevant aspects of the use of FTIR associated techniques in the study of surfaces and coatings”, Progress in Organic Coatings, Vol. 44, No. 3, pp. 233-242.
American Society for Testing and Materials – ASTM, 2010, “Book of ASTM Standards”, Philadelphia, D 3677-10, Standards Test Methods for Rubber-Identiication by Infrared Spectrophotometry.
Blackford, R., 1999, “Performance demands on aerospace paints relative to environmental legislation”, Pigment & Resin Technology, Vol. 28, No. 6, pp. 331-335.
Campos, E.A., Diniz, M.F., Reis, T.B., Dutra, R.C.L., Rezende, L.C. and Iha, K., 2003, “Aplicação de Técnicas FT-IR na Caracterização de Catalisador Cromito de Cobre. Utilizado na Indústria Aeroespacial”, Anais Associação Brasileira de Química, Vol. 52, No. 1, pp. 22-25.
Crespim, H., Azevedo, M.F.P, David, L.H., Cassu, S.N. and Lourenço, V.L., 2007, “Substituição de amianto por silicato de alumínio e graite expansível em compósito de poliuretano utilizado em motor-foguete”, Polímeros: Ciência e Tecnologia, Vol. 17, No. 3, pp. 228-233.
Dutra, J.C.N., Massi, M., Otani, C., Dutra, R.C.L., Diniz, M.F., Urruchi, W.I., Maciel, H. and Bittencourt, E., 2002, “Surface Modiication of EPDM Rubber by Reactive Argon-Oxygen Plasma Process”, Molecular Crystals and Liquid Crystals, Vol. 374, No. 1, pp. 45-52.
Dutra, R.C.L. and Diniz, M.F., 1993, “Resistência à degradação oxidativa e comportamento aos solventes como indicadores da composição de sistemas elastoméricos vulcanizados mistos”, Polímeros: Ciência e Tecnologia, Vol. 3, No. 3, pp. 25-28.
Dutra, R.C.L., Diniz, M.F., Takahashi, M.F.K., 1995, “Importância da Preparação de Amostras em Espectroscopia no Infravermelho com Transformada de Fourier (FTIR) na Investigação de Constituintes em Materiais Compostos”, Polímeros: Ciência e Tecnologia, Vol. 5, No. 1, pp. 41-46.
Faillace, J.C., Medeiros, M.E., Filho, A.M.F., 1999, “Comportamento Térmico do Acelerador de Queima de Propelentes Sólidos, Anais
do III Encontro Técnico de Materiais e Química, 3th ETMQ, Rio de
Janeiro, Brazil.
Ferrari, V.C.G.M., Lourenço, V.L., Dutra, R.C.L., Diniz, M.F., Azevedo, M.F.P., David, L.H., 2012, “Caracterização de um Pré-Impregnado Aeronáutico por FT-IR e Análise Térmica”, Polímeros: Ciência e Tecnologia, Vol. 22, No. 4, pp. 369-377.
Hori, K., Iwama, A., Fukuda, T., 1990, “FTIR spectroscopic study on the Interaction between Ammonium Perchlorate and Bonding Agents”, Propellants, Explosives, Pyrotechnics, Vol. 15, No. 3, pp. 99-102.
Lindner, W., 2005, “Surface Coatings”, In: Directory of Microbicides for the Protection of Materials, Edited by Paulus, W., Springer, New York.
Lourenço, V.L., Kawamoto, A.M., Sciamareli, J., Rezende, L.C., Pires, D.C., Takahashi, M.F.K., Berdugo, A.V., Cruz, S.M., Dutra, R.C.L. and Soares, B.G. 2006, “Determinação da distribuição de funcionalidade de HTPB e veriicação de sua inluência no comportamento mecânico de poliuretano utilizado em motor-foguete”, Polímeros: Ciência e Tecnologia, Vol. 16, No. 1, pp. 66-70.
Mateo, M.P., Ctvrtnickova, T. and Nicolas, G., 2009, “Characterization of pigments used in painting by means of laser-induced plasma and attenuated total relectance FTIR spectroscopy”, Applied Surface Science, Vol. 255, No. 10, pp. 5172-5176.
Matheson, M.J., Wampler, T.P., Simonsick Jr., W.J., 1994, “The effect of carbon-black illing on the pyrolysis behavior of natural and synthetic Rubbers”, Journal of Analytical and Applied Pyrolysis, Vol. 29, No. 2, pp. 129-136.
Mattos, E.C., Moreira, E.D., Dutra, R.C.L., Diniz, M.F., Ribeiro, A.P. and Iha, K., 2004, “Determination of the HMX and RDX content in synthesized energetic material by HPLC, FT-MIR and FT-NIR spectroscopies”, Química Nova, Vol. 27, No. 4, pp. 540-544.
Mazzeo, R., Joseph, E., Prati, S. and Millemaggi, A., 2007, “Attenuated Total Relection Fourier Transform Infrared Microspectroscopic Mapping for the Characterization of Paint Cross Sections”, Analytica Chimica Acta, Vol. 599, No. 1, pp. 107-117.
Mello, V.M. and Suarez, P.A.Z., “As Formulações de Tintas Expressivas Através da História”, Revista Virtual de Química, Vol. 4, No. 1, pp. 2-12, Retrieved on June 11 2013, 2012, from http://www.uff.br/ RVQ/index.php/rvq/article/viewFile/248/218
Miliani, C., Ombelli, M., Morresi, A. and Romani, A., 2002, “Spectroscopic study of acrylic resins in solid matrices”, Surface and Coatings Technology, Vol. 151-152, pp. 276-280.
Moraes, J.H., Sobrinho, A.S.S., Maciel, H.S., Dutra, J.C.N., Massi, M., Mello, S.A.C. and Schreiner, W.H., 2007, “Surface improvement of EPDM rubber by plasma treatment”, Journal of Physics D: Applied Physics, Vol. 40, No. 40 pp. 7747. dx.doi.org/10.1088/0022-3727/40/24/022
Oliveira, J.I.S., Nagamachi, M.Y., Diniz, M.F., Mattos, E.C. and Dutra, R. C.L., 2011, “Assessment of the synthesis routes conditions for obtaining ammonium dinitramide by the FT-IR”, Journal of Aerospace Technology and Management, Vol. 3, No. 3, pp. 269-278.
Pandey, G.C. and Kulshreshtha, A.K., 1993, “Fourier transform infrared spectroscopy as a quality control tool”, Process Control and Quality, Vol. 4, pp. 109-123.
Pardini, L.C., 2000, “Preformas para Compósitos Estruturais”, Polímeros: Ciência e Tecnologia, Vol. 10, No. 2, pp. 100-109.
Perkin Elmer – Technical Note, 2005, Improved Performance with the New Spectrum 100 UATR Accessory, Retrieved on June 11 2013, from www.perkinelmer.com
Romão, B.M.V., Diniz, M.F., Azevedo, M.F.P, Lourenço, V.L., Pardini, L.C., Dutra, R.C.L., Burel, F., 2006, “Characterization of the Curing Agents Used in Epoxy Resins with TG/FT-IR Technique”, Polímeros: Ciência e Tecnologia, Vol. 16, No 2, pp. 94-98.
Santos, R.P., Oliveira Junior, M.S., Mattos, E.C., Diniz, M.F. and Dutra, R.C.L., 2013, “Study by FT-IR Technique and Adhesive Properties of Vulcanized EPDM Modiied with Plasma”, Journal of Aerospace Technology and Management, Vol. 5, No. 1, pp. 65-74.
Sciamareli, J., Cassu, S.N. and Iha, K., 2012, “Water inluence in poly (epichlororydrin) synthesis: An Intermediate to Energetic Propellants”, Journal of Aerospace Technology and Management, Vol. 4, No. 1, pp. 41-44. doi:10.5028/jatm.2012.04016011
Silverstein, R.M., Webster, F.X. and Kiemle, D.J., 2005, “Spectrometric identiication of organic compounds”, John Wiley & Sons, New York.
Smith, A.L., 1979, “Applied Infrared Spectroscopy”, John Wiley & Sons, New York, pp. 286.
Szafarska, M., Woźniakiewicz, M., Pilch, M., Zięba-Palus, J. and
Kościelniak, P., 2009, “Computer analysis of ATR-FTIR spectra of paint
samples for forensic purposes. Journal of Molecular Structure”, Vols. 924-926, pp. 504-513.
Wake, W.C., Tidd, B.K. and Loadman, M.J.R., 1983, “Analysis
of Rubber and Rubber-like polymer”, 3rd edition, Applied Science
Publishers, New York, pp. 330.
Waltham, 2005, FT-IR Spectroscopy Attenuated Total Relectance (ATR), Technical Note, Catalogue PerkinElmer.
Welin-Berger, K. and Bergenstahl, B., 2000, “Inhibition of Ostwald ripening in local anesthetic emulsions by using hydrophobic excipients in the disperse phase”. International Journal of Pharmaceutics, Vol. 200, No. 4, pp. 249-260.
Williams, P.T. and Besler, S., 1995, “Pyrolysis-thermogravimetric analysis of tires and tyre components”, Fuel, Vol. 74, No. 9, pp. 1277-1283.