www.nat-hazards-earth-syst-sci.net/14/1999/2014/ doi:10.5194/nhess-14-1999-2014
© Author(s) 2014. CC Attribution 3.0 License.
Chlorophyll increases off the coasts of Japan after the 2011 tsunami
using NASA/MODIS data
E. Sava, B. Edwards, and G. Cervone
GeoInformatics and Earth Observation Laboratory, Department of Geography and Institute for CyberScience The Pennsylvania State University, University Park, PA 16802, USA
Correspondence to:G. Cervone ([email protected])
Received: 25 March 2013 – Published in Nat. Hazards Earth Syst. Sci. Discuss.: 3 July 2013 Revised: 21 May 2014 – Accepted: 9 June 2014 – Published: 6 August 2014
Abstract.Large chlorophyll anomalies are observed after the 2011 Japanese tsunami using the NASA MODIS instrument onboard the TERRA and AQUA satellites. These anomalies are observed both along the eastern coast of Japan, where the tsunami wave hit with maximum force, and in the deep wa-ter surrounding the epicentral region. Although both satel-lites show agreeing spatio-temporal patterns, larger anoma-lies are detected using the AQUA satellite. A temporal analy-sis shows increased chlorophyll concentrations immediately after the tsunami, and higher values are observed for nearly one month before reversing to pre-tsunami levels.
1 Introduction
On 11 March 2011 at 05:46 UTC a massiveMw=9.0 under-water earthquake occurred 70 km offshore the eastern coast of Japan. The location of the earthquake was triangulated by the United States Geological Survey (USGS) to 38.322◦N
142.369◦E and the hypocenter was computed to 32 km
be-neath the surface. The earthquake generated a tsunami that rapidly hit the eastern coast of Japan, and propagated across the Pacific Ocean to the western coast of the Americas. A tsunami warning was issued by NOAA affecting all countries with coastlines along the Pacific Ocean1.
Waves up to 40 m high were reported and coastal ar-eas were flooded up to several kilometers inland. National Oceanographic and Atmospheric Agency (NOAA) models2 predicted waves higher than 30 m along the eastern coast
1http://ptwc.weather.gov/ (last access: 11 March 2011) 2http://nctr.pmel.noaa.gov/honshu20110311/ (last access:
11 March 2011)
of Japan and up to 6 m for the western coast of the United States. An alternative model from the University of Cali-fornia at Santa Cruz3predicted even larger wave heights in certain areas. As a result of the flooding, thousands of peo-ple have been proclaimed dead or missing, with the dam-ages estimated to be in the order of several billion USD. Recent results suggest that the tsunami also caused large chlorophyll blooms along the Japanese coast (Siswanto and Hashim, 2012; Sarangi, 2011).
Chlorophyll is the primary photosynthetic molecule and is the basis for marine life (Kirk, 1983). There are six pri-mary classifications of chlorophyll contained in plants and organisms, labeled from a to f. (Nakagawara et al., 2007). Remote sensing instruments can be used to estimate chloro-phyll typea andb. Both types function as light-harvesting pigments found in plant life. However, chlorophylla is lo-cated in plant antenna complexes and reaction centers and acts as an electron carrier, while chlorophyllb is a compo-nent and stabilizer of peripheral antenna complexes (Tanaka et al., 1998; Nakagawara et al., 2007).
Microscopic organisms called phytoplankton also contain chlorophyll, and are crucial for marine life as they form the beginning of the food chain for all ocean organisms. The ocean, especially along coastal regions, is full of phytoplank-ton, and variations in chlorophyll concentrations are good es-timates of phytoplankton production (Prakash and Ramesh, 2007).
Chlorophyll allows plants to absorb energy from light. When light is absorbed, plants or phytoplankton convert wa-ter and carbon dioxide into oxygen and energy. Without the help of chlorophyll plants would be unable to survive.
Chlorophyll also plays a role in the global carbon cycle because phytoplankton blooms decrease light penetration through the water column and can depress marine growth and productivity (Boyer et al., 2009).
Chlorophyll increase is a phenomenon that occurs primar-ily along the coasts, and is driven by upwelling of the lower strata of the ocean towards the surface (Saito et al., 1998). Upwelling occurs when nutrient-rich water rises to the ocean surface from depths of over 50 m (Small and Menzies, 1981). Transportation of deep, cold, nutrient-rich water to the sur-face triggers high chlorophyll production. Areas of upwelling can increase phytoplankton growth, which contribute to the fisheries of the world (Rykaczewski and Checkley, 2008). 1.1 Chlorophyll variation along the Japanese coast Along the Japanese coasts, large chlorophyll concentrations are present at depth (i.e., DCM: deep chlorophyll maximum), and as a result of upwelling of nutrients, large blooming can be observed at the surface (Cullen, 1982; Yamada et al., 2004). In this region, upwelling is driven primarily by three factors (Furuya et al., 1993; Takeoka et al., 1997; Kasai et al., 1997; Saito et al., 1998):
1. wind induced 2. tidal mixing
3. thermohaline circulation.
Wind-induced upwelling is caused by the displacement of water masses and their replacement with nutrient-rich water coming from deeper layers, like when a cross-shore pressure gradient supports an alongshore geostrophic wind (Sverdrup, 1938; Bakun et al., 2010). This wind drives surface water off-shore, and cannot be replaced by waters moving horizontally along the coast. Therefore this water has to be replaced by the upwelling of subsurface waters (Bakun et al., 2010).
Tidal mixing upwelling is caused by currents. Along the coasts of Japan, tidal effects are very strong, exhibiting sea height differences of the order of a few meters. Such changes are predictable based on the phases of the moon.
Thermohaline circulation upwelling is caused by normal seasonal ocean currents. In Japan, surface latent heat flux (SLHF), which is directly proportional to the evaporation of water, is usually high away from the coast in blue waters. To compensate, thermohaline circulation has an in-flowing component at depth, to compensate for the out-flowing sur-face water. Therefore, when high SLHF values are observed, the resulting in-flow of water at depth causes upwelling, and increases the chlorophyll concentrations. Due to SLHF sea-sonal patterns, larger chlorophyll increases can be expected during summer.
Additionally, extreme events such as tropical storms or tsunamis can cause large levels of upwelling both along the coasts and in the deep ocean. Large chlorophyll blooms have been observed after major hurricanes, typhoons, and
tsunamis (Gautam et al., 2005; Walker et al., 2005; Son et al., 2006; Singh et al., 2007; Sarangi, 2012).
In particular, Sarangi (2012) analyzed NASA AQUA satel-lite data for 2009, 2010 and 2011 from February 26 to March 29. This paper expands the initial findings by analyzing data for the entire year, and by comparing anomalies observed along the coast of Japan and in deep water.
1.2 Retrieving chlorophyll using remote sensing It is possible to derive chlorophyll concentration by analyz-ing spectral changes in the green and blue part of the spec-trum.
Chlorophyll concentrations are derived from ocean color, and thus can be readily estimated using remote sensing sen-sors (e.g., Neville and Gower, 1977; Sathyendranath et al., 1989; Kiyofuji et al., 2006; Tan et al., 2007; Radiarta and Saitoh, 2008). Chlorophyll products are generated by analyz-ing spectral measurements in the blue and green parts of the spectrum, roughly corresponding to the phytoplankton ab-sorption peak and minimum, respectively.
Most algorithms have been developed for deriving con-centrations in deep water where the reflection from the bot-tom can be neglected (Cannizzaro and Carder, 2006). The MODIS algorithms used in this study attempt to compen-sate the usually higher values of chlorophyll concentrations in coastal regions (Miller and McKee, 2004).
Datt (1998) showed how chlorophyllaabsorbs energy pri-marily in the blue-violet (400–475 nm) and orange-red (590– 650 nm) parts of the electro magnetic (EM) spectrum, and reflects energy primarily in the green part of the EM spec-trum. In contrast, chlorophyllbabsorbs energy primarily in the green (510 nm) part of the EM spectrum. Chlorophyllb
complements chlorophylla by increasing the absorbtion of energy in the green part of the EM spectrum. This article is entirely based on observations of chlorophyll a, which are simply referred to as chlorophyll.
Since the 1980s, numerous sensors, such as NASA SeaW-iFS, MODIS, and ESA MERIS, have been built and launched to study the variation of chlorophyll concentrations (O’Reilly et al., 1998; Bezy et al., 2000; Dall’Olmo et al., 2005; Kiy-ofuji et al., 2006). Algorithms have been developed to ef-fectively quantify the amount of chlorophyll, and have been validated with in situ observations and other remotely sensed data (Antoine et al., 2008).
are detected. To compensate, it is customary to average the values for 3 days, a week, or even a month, in order to gen-erate products with comprehensive spatial coverage.
In order to study the consequences of the 2011 Japanese tsunami on ocean phytoplankton, a remote sensing analysis has been carried out using the MODIS instrument onboard the TERRA and AQUA satellites. The chlorophyll products used had a 4 km spatial resolution and 3-day and 8-day com-posite temporal resolution. The data for the entire 2011 year were used in order to cover the tsunami and post-tsunami time period. This study focuses on the week the tsunami oc-curred as well as the weeks before and after. For comparison purposes, additional 3-day 9 km resolution data were used to quantify the distribution between the tsunami and non-tsunami periods.
Although the TERRA and AQUA satellites carry identical MODIS instruments, they are on different orbital paths, and thus their measurements of chlorophyll are different because they estimate it at different times of the day, as explained in Sect. 2. Furthermore, by averaging the measurements of TERRA and AQUA, it is possible to reduce the amount of cloud pixels in the scene, and increase the spatial coverage of the available data.
The objective of this study is to investigate the effects of the 2011 Japanese tsunami on chlorophyll a concentrations and the distribution before and after the event using data from MODIS-AQUA and TERRA satellites. Our hypothesis is that major events, such as hurricanes or tsunamis, cause large dis-turbances in ocean waters, which can result in the upwelling of nutrients, and thus, chlorophyll increases.
2 MODIS chlorophyll data
Satellite remote sensing observations from the NASA MOD-erate Resolution Imaging Spectroradiometer (MODIS) in-strument can be used to derive chlorophyll. MODIS is a moderate resolution multi-spectral sensor currently flying on two NASA satellites, AQUA and TERRA. MODIS uses mid-and thermal-IR for measuring the emissivity of the surface. MODIS chlorophyll products are corrected for atmospheric disturbances. A description of the MODIS chlorophyll prod-ucts and their comparison with in situ measurements is dis-cussed by (Esaias et al., 1998; Carder et al., 2004).
The AQUA satellite was designed to observe the earth’s water cycle. Its sun-synchronous polar orbit (south to north) passes over the Equator in the afternoon (13:30 p.m.), and it acquires data for nearly the entire earth each day. The TERRA satellite was designed to collect data relating to the earth’s biogeochemical and energy systems. TERRA is also in a sun-synchronous orbit and crosses the Equator at approx-imately 10:30 a.m. local time.
This study is based on standard AQUA and TERRA MODIS Level 3, 4.63 km gridded 3-day and 8-day compos-ite products, generated through surface emissions. The
grid-ded data are generated by binning and averaging the nominal 1 km swath observations, yielding a≈4 km gridded global
data. The data were downloaded from the NASA OceanColor website4and were processed using the SeaDAS 6.1 software, available from the same location. The data are distributed in HDF-EOS format. The use of MODIS data is limited to cloud-free conditions. Since MODIS is installed on both the TERRA and AQUA satellites, four data points are available per day.
MODIS data can be freely obtained through direct broad-cast, which requires an X-band antenna and its control equip-ment, or from the NASA MODIS website. The data are dis-tributed in HDF5-EOS format.
3 Analysis of tsunami waves
The 2011 tsunami was of unprecedented strength and af-fected the largest portion of the eastern coast of Japan in recorded history. Chlorophyll increases were observed us-ing satellite remote sensus-ing data over a large area, extend-ing from the shallow areas along the coast to the deep water hundreds of kilometers away.
3.1 Analysis of tsunami waves along the coast
The tsunami hit the coast of Japan within minutes of the ini-tial earthquake and is responsible for the loss of thousands of lives as well as massive damages to properties and the en-vironment. In shallow water, waves measured several tens of meters, and penetrated far inland. The eastern coast of Japan received the most damage due to the proximity to the epicen-ter. Table 1 shows the recorded wave heights in different lo-cations along the eastern coast of Japan for four tsunamis that occurred in 1896, 1933, 1960 and 2011. The 2011 tsunami had among the highest wave heights ever recorded, and af-fected the largest portion of the eastern shoreline. The dam-age caused by the 2011 tsunami was mapped by the Inter-national Charter for Space and Major Disasters5using high-resolution satellite data. The maps show the areas most af-fected by the tsunami and provide a near-real-time assess-ment of the damages (Cervone and Manca, 2011). The wave heights reported in Table 1 and the maps from the charter were used to define the area along the coast (R1) used in these experiments.
3.2 Analysis of tsunami wave in deep water
In deep water, tsunami waves have a much smaller ampli-tude, which is a function of the water depth. The dynam-ics for chlorophyll increases differ from shallow regions, but are also related to tsunamis. The 2011 tsunami was observed by buoys of the Deep-ocean Assessment and Reporting of
Figure 1.Tsunami wave travel time (in hours) and location of Pacific Ocean DART buoys used to quantify the wave height in deep ocean. The earthquake epicenter is indicated with a star. Image source: NOAA National Geophysical Data Center.
Table 1.Wave heights in meters recorded along the eastern coast of Japan for recorded tsunamis. Source: Japanese Society of Civil En-gineers. Bold numbers indicate maximum wave heights recorded.
Prefecture 1896 1933 1960 2011
Hachinohe 3.0 3.0 4.1 9.2
Miyako 18.3 13.6 5.8 35.2
Ofunato 38.2 8.9 5.5 30.1
Ojika 3.4 5.2 5.4 20.9
Sendai 2.4 2.6 11.0
Iwaki 1.2 9.4
Oarai 5.7
Tsunamis (DART) tsunami warning system, scattered across the Pacific Ocean, which are designed to measure changes in wave height. Figure 1 shows the location of the buoys, and the tsunami wave travel time in hours computed by the Tsunami Travel Times (TTT) software6, which is provided by the NOAA National Geophysical Data Center. The epi-center of the earthquake is indicated with a star.
6www.ngdc.noaa.gov/hazard/tsu_travel_time_software.shtml
(last access: 15 May 2011)
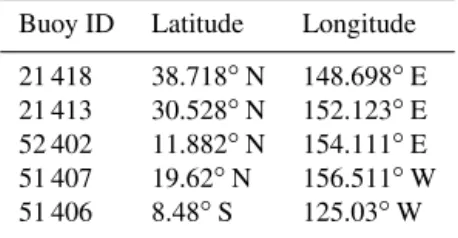
Table 2.ID and location of the DART buoys used to quantify the wave height in deep water.
Buoy ID Latitude Longitude
21 418 38.718◦N 148.698◦E
21 413 30.528◦N 152.123◦E
52 402 11.882◦N 154.111◦E
51 407 19.62◦N 156.511◦W
51 406 8.48◦S 125.03◦W
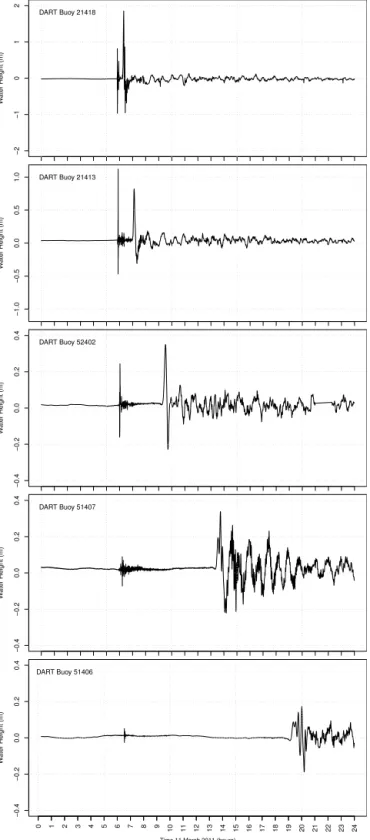
Figure 2 shows the water height in meters for 11 March 2011 measured by the DART buoys listed in Table 2. The data were filtered by performing a wavelet transformation. The data show an amplitude of 1.8 m for buoy 21 418 and 1 m for buoy 21 413, the buoys closest to the epicenter, located 200 km west and 500 km southwest of the epicenter, respec-tively. The tsunami wave can be seen propagating across the Pacific, albeit with a much smaller magnitude.
W
ater Height (m)
−2
−1
0
1
2
DART Buoy 21418
W
ater Height (m)
−1.0
−0.5
0.0
0.5
1.0 DART Buoy 21413
W
ater Height (m)
−0.4
−0.2
0.0
0.2
0.4
DART Buoy 52402
W
ater Height (m)
−0.4
−0.2
0.0
0.2
0.4
DART Buoy 51407
W
ater Height (m)
−0.4
−0.2
0.0
0.2
0.4
DART Buoy 51406
0 1 2 3 4 5 6 7 8 9
10 11 12 13 14 15 16 17 18 19 20 21 22 23 24
Time 11 March 2011 (hours)
Figure 2.Wave height in meters for five DART tsunami buoys for 11 March 2011. The buoys are arranged in increasing distance from the epicenter. Data source: NOAA National Geophysical Data Cen-ter.
Table 3.Regions used in the experiments to analyze the chlorophyll increases.
Region Lat. min Lat. max Long. min Long. max
R1 35.5 39.0 140.6 141.5
R2 37.0 38.0 141.0 143.9
Figure 3.Average chlorophyll concentration for Region 1 and Re-gion 2 for year 2011 retrieved by NASA MODIS onboard TERRA and AQUA. The concentrations are in a logarithmic scale.
4 Results and discussion
Chlorophyll concentration values were downloaded from the NASA Ocean Color website for 2011 for the 3-day and 8-day 4 km gridded products. All values are in mg m−3. The data
were analyzed and plotted using the R7 statistical project. The code is available from the authors upon request.
Two regions are defined, labeled R1 and R2, to analyze the chlorophyll increases along the eastern coast of Japan (R1) as well as in deep water (R2). Table 3 shows the coordinates for the two regions. A spatio-temporal analysis was performed by averaging the chlorophyll concentration over R1 and R2 for the entire year.
Unfortunately, especially in the immediate aftermath of the tsunami, a large cloud cover made the analysis of 3-day data impractical due to the large presence of missing pixels. Consequently, the analysis discussed in this paper is based on the weekly composite, which partially addresses the missing pixel problem by averaging values over a longer time span.
Figure 3 shows the results for R1 (top) and R2 (bottom) for both TERRA (black) and AQUA (gray). Throughout the year the largest anomalies are observed between March and April, and correspond with the occurrence of the tsunami. The maximum average concentration in R1 was detected us-ing AQUA 2 weeks after the tsunami, and it corresponds
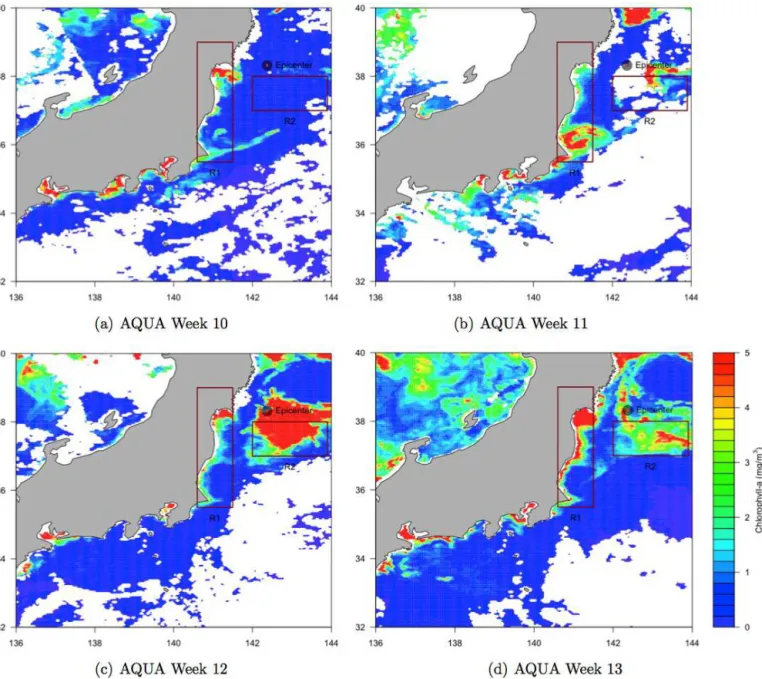
Figure 4.Chlorophyll concentration for the 4 weeks after the tsunami using AQUA. The vertical axis indicates latitude degrees north, and the horizontal axis indicates longitude degrees east.
to 3.5 mg m−3against a background ranging between 0 and
1 mg m−3. The maximum average concentration in R2 was
detected using AQUA the week after the tsunami, and it cor-responds to 3 mg m−3against a background ranging between
0 and 0.5 mg m−3. The values observed by AQUA are higher
than for TERRA, but their temporal extents are consistent. Chlorophyll values return to the pre-tsunami level within 1 to 2 months.
Figure 4 shows the chlorophyll concentration for weeks 10 to 13 of 2011 retrieved by the MODIS instrument on-board AQUA. Week 10 corresponds to the tsunami occur-rence. Large chlorophyll increases are observed over a large region, roughly centered at the epicenter, and extending west
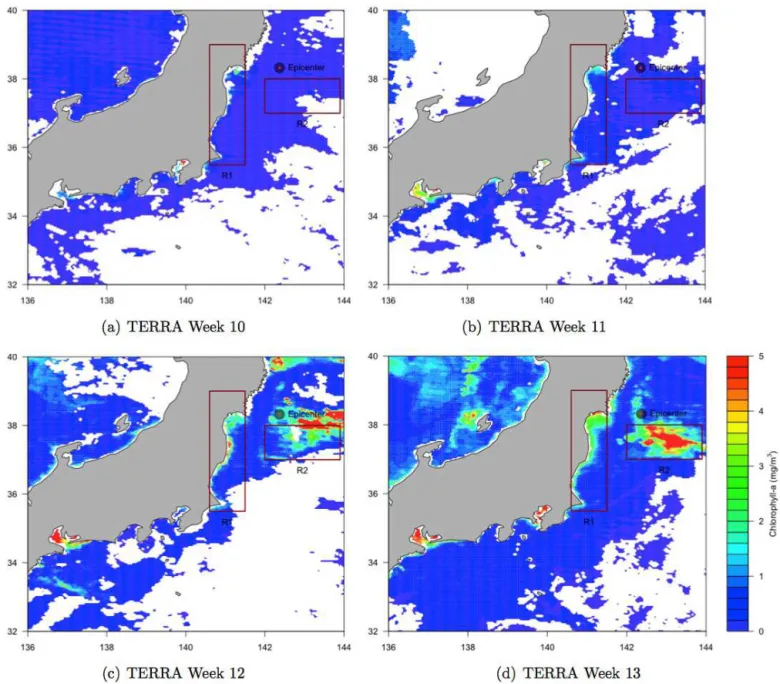
to the coast of Japan and east to buoy 21 418. Chlorophyll increases are seen both in R1 and R2, and they correspond to the largest blooming recorded during the entire year of 2011. Figure 5 shows the chlorophyll concentration for the same 4 weeks retrieved by the MODIS instrument onboard TERRA. The spatial distribution of chlorophyll concentra-tions between AQUA and TERRA is consistent; however, in the TERRA data the concentrations are much smaller.
Figure 5.Chlorophyll concentrations for the 4 weeks after the tsunami using TERRA. The vertical axis indicates latitude degrees north, and the horizontal axis indicates longitude degrees east.
year, especially during the summer months where an increase cloud cover is present.
Because the MODIS instruments onboard AQUA and TERRA are the same, the lesser concentrations are due to the satellites’ orbit. AQUA is specifically designed to study the earth’s hydrosphere, and thus is better suited to observe concentrations in the water. Despite the lower concentrations, TERRA data are very useful to study the spatial extent of the anomalies.
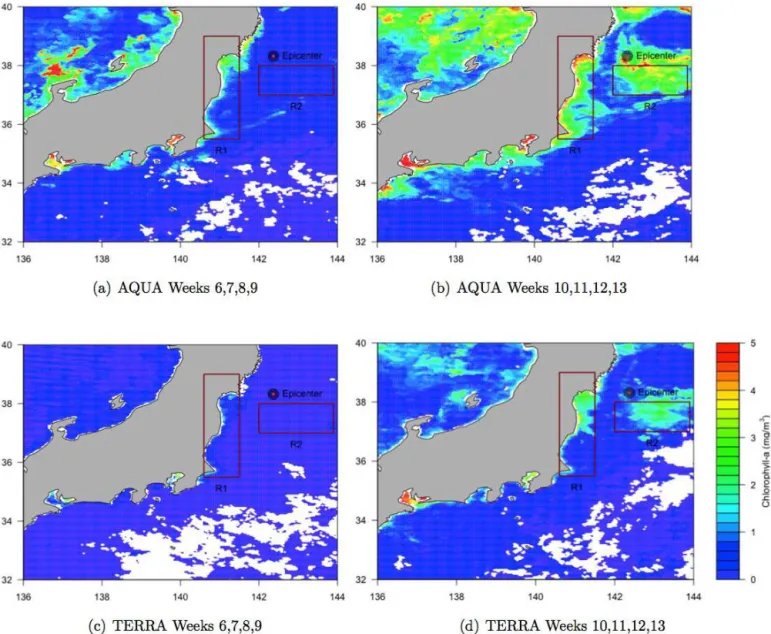
Figure 6 shows the average chlorophyll concentration for 4 weeks (6, 7, 8, 9) before (left) and 4 weeks (10, 11, 12, 13) after (right) the tsunami for AQUA (top) and TERRA (bottom). The concentrations observed by AQUA are about
three times higher than for TERRA, although their spatial distribution is consistent both for R1 and R2.
5 Conclusions
Figure 6.Average chlorophyll concentration for 4 weeks before (left) and after (right) the tsunami for AQUA (top) and TERRA (bottom). The vertical axis indicates latitude degrees north, and the horizontal axis indicates longitude degrees east.
The data from AQUA show higher concentration values than the TERRA data, but the spatial distribution of the con-centrations are consistent between the two satellites. The data also illustrate how these high concentrations are concurrent with the 2011 tsunami. Therefore, the increases in chloro-phyll concentrations are possibly the result from the tsunami causing unusually large upwelling of nutrients.
Acknowledgements. Work performed under this project has been partially funded by the Office of Naval Research (ONR) award #N00014-14-1-0208 (PSU #171570). This research was started when the first two authors were undergraduate students, and it was partially supported by the George Mason OSCAR program.
Edited by: R. Lasaponara
References
Antoine, D., d’Ortenzio, F., Hooker, S. B., Bécu, G., Gentili, B., Tailliez, D., and Scott, A. J.: Assessment of uncertainty in the ocean reflectance determined by three satellite ocean color sen-sors (MERIS, SeaWiFS and MODIS-A) at an offshore site in the Mediterranean Sea (BOUSSOLE project), J. Geophys. Res, 113, C07013, doi:10.1029/2007JC004472, 2008.
Bakun, A., Field, D. B., and Redondo-Rodriguez, S. J.: Green-house gas, upwelling-favorable winds, and the future of coastal ocean upwelling ecosystems, Glob. Change Biol., 16, 1213– 1228, 2010.
Bezy, J., Delwart, S., and Rast, M.: MERIS-A new generation of ocean-colour sensor onboard Envisat, ESA Bull., 103, 48–56, 2000.
Boyer, J. N., Kelble, C. R., Ortner, P. B., and Rudnick, D. T.: Phy-toplankton bloom status: Chlorophyllabiomass as an indicator
of water quality condition in the southern estuaries of Florida, USA, Ecol. Indic., 9, S56–S67, 2009.
Campbell, J. W. and Feng, H.: The empirical chlorophyll algorithm for MODIS: Testing the OC3M algorithm using NOMAD data, in: Ocean Color Bio-optical Algorithm Mini-workshop, 27–29 September 2005, 1–9, New England Center, University of New Hampshire Durham, NH, 2005.
Cannizzaro, J. P. and Carder, K. L.: Estimating chlorophylla
con-centrations from remote-sensing reflectance in optically shallow waters, Remote Sens. Environ., 101, 13–24, 2006.
Carder, K., Chen, F., Cannizzaro, J., Campbell, J., and Mitchell, B.: Performance of the MODIS semi-analytical ocean color algo-rithm for chlorophyll-a, Adv. Space Res., 33, 1152–1159, 2004. Cervone, G. and Manca, G.: Damage Assessment of the 2011
Japanese Tsunami Using High-Resolution Satellite Data, Carto-graphica: The International Journal for Geographic Information and Geovisualization, 46, 200–203, 2011.
Cullen, J. J.: The deep chlorophyll maximum: comparing vertical profiles of chlorophyll a, Can. J. Fish. Aquat. Sci., 39, 791–803, 1982.
Dall’Olmo, G., Gitelson, A. A., Rundquist, D. C., Leavitt, B., Bar-row, T., and Holz, J. C.: Assessing the potential of SeaWiFS and MODIS for estimating chlorophyll concentration in turbid pro-ductive waters using red and near-infrared bands, Remote Sens. Environ., 96, 176–187, 2005.
Datt, B.: Remote Sensing of Chlorophylla, Chlorophyllb,
Chloro-phylla+ Chlorophyllb, and Total Carotenoid Content in
Euca-lyptus Leaves, Remote Sens. Environ., 66, 111–121, 1998. Esaias, W. E., Abbott, M. R., Barton, I., Brown, O. B., Campbell,
J. W., Carder, K. L., Clark, D. K., Evans, R. H., Hoge, F. E., Gordon, H. R., Balch, W. M., Letelier, R., and Minnett, P. J.: An overview of MODIS capabilities for ocean science observations, IEEE T. Geosci. Remote, 36, 1250–1265, 1998.
Furuya, K., Takahashi, K., and Iizumi, H.: Wind-dependent forma-tion of phytoplankton spring bloom in Otsuchi Bay in Sanriku, Japan, J. Oceanogr., 49, 459–475, 1993.
Gautam, R., Cervone, G., Singh, R., and Kafatos, M.: Characteristics of meteorological parameters associated with Hurricane Isabel, Geophys. Res. Lett., 32, L04801, doi:10.1029/2004GL021559, 2005.
Huot, Y., Brown, C. A., and Cullen, J. J.: New algorithms for MODIS sun-induced chlorophyll fluorescence and a comparison
with present data products, Limnol. Oceanogr.-Methods, 3, 108– 130, 2005.
Kasai, H., Saito, H., Yoshimori, A., and Taguchi, S.: Variability in timing and magnitude of spring bloom in the Oyashio region, the western subarctic Pacific off Hokkaido, Japan, Fish. Oceanogr., 6, 118–129, 1997.
Kirk, J. T. O.: Light and photosynthesis in aquatic ecosystems, Cambridge University Press, 1983.
Kiyofuji, H., Hokimoto, T., and Saitoh, S.-I.: Predicting the spa-tiotemporal chlorophyll-a distribution in the Sea of Japan based on SeaWiFS ocean color satellite data, IEEE T. Geosci. Remote, 3, 212–216, 2006.
Letelier, R. M. and Abbott, M. R.: An analysis of chlorophyll fluo-rescence algorithms for the Moderate Resolution Imaging Spec-trometer (MODIS), Remote Sens. Environ., 58, 215–223, 1996. Miller, R. L. and McKee, B. A.: Using MODIS Terra 250 m
im-agery to map concentrations of total suspended matter in coastal waters, Remote Sens. Environ., 93, 259–266, 2004.
Nakagawara, E., Sakuraba, Y., Yamasato, A., Tanaka, R., and Tanaka, A.: Clp protease controls chlorophyll b synthesis by reg-ulating the level of chlorophyllide a oxygenase, Plant J., 49, 800– 809, 2007.
Neville, R. and Gower, J.: Passive remote sensing of phytoplankton via chlorophyllαfluorescence, J. Geophys. Res., 82, 3487–3493,
1977.
O’Reilly, J. E., Maritorena, S., Mitchell, B. G., Siegel, D. A., Carder, K. L., Garver, S. A., Kahru, M., and McClain, C.: Ocean color chlorophyll algorithms for SeaWiFS, J. Geophys. Res.-Oceans, 103, 24937, doi:10.1029/98JC02160, 1998.
O’Reilly, J. E., Maritorena, S., Siegel, D. A., O’Brien, M. C., Toole, D., Mitchell, B. G., Kahru, M., Chavez, F. P., Strutton, P., Cota, G. F., Hooker, S.B., McClain, C., Carder, K., Muller-Karger, F., Harding, L., Magnuson, A., Phinney, D., Moore, G., Aiken, J., Arrigo, K. R., Letelier, R. M., and Culver, M.: Ocean color chlorophyll a algorithms for SeaWiFS, OC2, and OC4: Version 4, SeaWiFS postlaunch calibration and validation analyses, Part, 3, 9–23, 2000.
Prakash, S. and Ramesh, R.: Is the Arabian Sea getting more pro-ductive?, Curr. Sci., 92, 667–670, 2007.
Radiarta, I. N. and Saitoh, S.-I.: Satellite-derived measurements of spatial and temporal chlorophyll-a variability in Funka Bay, southwestern Hokkaido, Japan, Estuar. Coast. Shelf Sci., 79, 400–408, 2008.
Rykaczewski, R. R. and Checkley, D. M.: Influence of ocean winds on the pelagic ecosystem in upwelling regions, P. Natl. Acad. Sci., 105, 1965–1970, 2008.
Saito, H., Kasai, H., Kashiwai, M., Kawasaki, Y., Kono, T., Taguchi, S., and Tsuda, A.: General description of seasonal variations in nutrients, chlorophyll-a, and netplankton biomass along the A-line transect, western subarctic Pacific, from 1990 to 1994, Bulletin of the Hokkaido National Fisheries Research Institute, 1998.
Sarangi, R.: Remote Sensing of Chlorophyll and Sea Surface Tem-perature in Indian Water with Impact of 2004 Sumatra Tsunami, Mar. Geod., 34, 152–166, 2011.
Sathyendranath, S., Prieur, L., and Morel, A.: A three-component model of ocean colour and its application to remote sensing of phytoplankton pigments in coastal waters, Int. J. Remote Sens., 10, 1373–1394, 1989.
Singh, R., Cervone, G., Kafatos, M., Prasad, A., Sahoo, A., Sun, D., Tang, D., and Yang, R.: Multi-sensor studies of the Sumatra earthquake and tsunami of 26 December 2004, Int. J. Remote Sens., 28, 2885–2896, 2007.
Siswanto, E. and Hashim, M.: A data fusion study on the impacts of the 2011 Japan tsunami on the marine environment of Sendai Bay, Int. J. Image Data Fus., 3, 191–198, 2012.
Small, L. F. and Menzies, D. W.: Patterns of primary productivity and biomass in a coastal upwelling region, Deep-Sea Res., 28, 123–149, 1981.
Son, S., Platt, T., Bouman, H., Lee, D., and Sathyendranath, S.: Satellite observation of chlorophyll and nutrients increase in-duced by Typhoon Megi in the Japan/East Sea, Geophys. Res. Lett., 33, L05607, doi:10.1029/2005GL025065, 2006.
Sverdrup, H. U.: On the process of upwelling, J. Mar. Res., 1, 155– 164, 1938.
Takeoka, H., Kaneda, A., and Anami, H.: Tidal fronts induced by horizontal contrast of vertical mixing efficiency, J. Oceanogr., 53, 563–570, 1997.
Tan, C., Ishizaka, J., Manda, A., Siswanto, E., and Tripathy, S.: As-sessing post-tsunami effects on ocean colour at eastern Indian Ocean using MODIS Aqua satellite, Int. J. Remote Sens., 28, 3055–3069, 2007.
Tanaka, A., Ito, H., Tanaka, R., Tanaka, N. K., Yoshida, K., and Okada, K.: Chlorophyll a oxygenase (CAO) is involved in chlorophyll b formation from chlorophyll a, P. Natl. Acad. Sci., 95, 12719–12723, 1998.
Walker, N. D., Leben, R. R., and Balasubramanian, S.: Hurricane-forced upwelling and chlorophyll-a enhancement within cold-core cyclones in the Gulf of Mexico, Geophys. Res. Lett., 32, L18610, doi:10.1029/2005GL023716, 2005.