www.atmos-chem-phys.net/10/313/2010/ © Author(s) 2010. This work is distributed under the Creative Commons Attribution 3.0 License.
Chemistry
and Physics
Single ice crystal measurements during nucleation experiments with
the depolarization detector IODE
M. Nicolet1, O. Stetzer1, F. L ¨u¨ond1, O. M¨ohler2, and U. Lohmann1
1Institute for Atmospheric and Climate Science, ETH Zurich, 8092 Zurich, Switzerland 2Institute for Meteorology and Climate Research, Forschungszentrum Karlsruhe, Germany Received: 11 September 2008 – Published in Atmos. Chem. Phys. Discuss.: 16 December 2008 Revised: 27 November 2009 – Accepted: 11 December 2009 – Published: 18 January 2010
Abstract. In order to determine the efficiency of different aerosol particles to nucleate ice, an Ice Optical DEpolariza-tion detector (IODE) was developed to distinguish between water droplets and ice crystals in ice nucleation chambers. A laser beam polarized linearly (power: 50 mW, wavelength: 407 nm) is directed through the chamber. The scattered light intensity from particles is measured at a scattering angle of 2=175◦in both polarization components (parallel and per-pendicular). The ratio between the perpendicular intensity over the total one yields the depolarization ratioδ. Single particle detection is possible, using a peak detection algo-rithm. For high particle concentrations, a real-time signal averaging method can also be run simultaneously.
The IODE detector was used in connection with the Zurich ice nucleation chamber during the ICIS 2007 workshop where ice nucleation experiments were performed with sev-eral aerosol types. In presence of ice crystals, a depolariza-tion ratio could be measured on a particle-by-particle basis. Mean values ofδ ranged from 0.24 to 0.37 and agree well with theoretical calculations.
1 Introduction
The role of aerosol particles in droplet activation has been recognized for almost 120 years as an essential component of cloud formation (Spurny, 2000). These particles are called cloud condensation nuclei (CCN). Increases in CCN due to anthropogenic activity also affect climate by changing the cloud characteristics (Lohmann and Feichter, 2005). Both the increase in cloud lifetime due to more and smaller cloud droplets and the associated radiative transfer changes are contributing to the indirect aerosol effect in climate forcing.
Correspondence to:O. Stetzer ([email protected])
According to the last IPCC report, the cloud albedo effect amounts to a global mean forcing of−0.7 W m−2 (−1.8 to −0.3 W m−2), but the level of scientific understanding is still low (Forster et al., 2007). The aerosol properties affecting their ability to act as CCN are rather well understood. How-ever, there is a lack of knowledge of the ice nucleation capa-bilities of aerosol particles (Cantrell and Heymsfield, 2005; Szyrmer and Zawadzki, 1997). The theory for heterogeneous nucleation including the molecular nature of its initiation and growth stages is not fully understood. The ice formation ef-ficiency as a function of aerosol particle properties is poorly understood because of the variety of heterogeneous ice nu-cleation modes. Four nunu-cleation modes are typically distin-guished (Vali, 1985). We focus on the deposition and immer-sion modes: Deposition freezing occurs when water vapor deposits directly onto the aerosol particle, forming ice with-out any transition through the liquid phase in a supersaturated environment with respect to ice. Ice nuclei (IN) can also initiate freezing from within a cloud droplet by immersion freezing where the particle is suspended in the interior of the water droplet. Another important unresolved problem is to understand the link between ice nucleation and cloud prop-erties that affect climate. Therefore, a greater understand-ing of the ice nucleation mechanisms is required to improve their representation in climate models. One good approach is to perform measurements of ice nucleation processes in the laboratory under controlled conditions. This can be achieved with cloud diffusion chambers.
this section, it is saturated with respect to ice and thus sub-saturated with respect to water, allowing water droplets to evaporate before detection. One of the limitations of the ex-isting continuous flow diffusion chambers (CFDC) is the in-direct detection of ice crystals by particle size (Rogers et al., 2001). If higher supersaturations and warmer temperatures are investigated, immersion freezing can take place as well. In this case, we may have both the liquid and the solid phase present during experiments so that we have to be able to dif-ferentiate between them. If water droplets and ice crystals are present simultaneously, it is not possible to distinguish between them based on their size. To overcome this limita-tion, a new detection system was built to distinguish between droplets and ice crystals. The property of light depolarization is used, which considers that ice particles are non-spherical and thus induce depolarization of the light whereas water droplets do not (Liou and Lahore, 1974). This device fol-lows the design that is used at the AIDA Chamber (B¨uttner, 2004). Whereas B¨uttner (2004) measures average signals of a collection of particles, we target to detect single par-ticles as IN concentrations in the atmosphere are typically very low (∼10ℓ−1 at−25◦C) (G˝otz et al., 1991). Several experimental applications have been built for single particle detection such as the Small Ice detector (SID) (Hirst et al., 2001), the Particle Measurement System forward scattering probe (FSSP) (Lawson and Cormack, 1995) and the Video Ice Particle Sampler (VIPS) (McFarquhar et al., 2002). Other optical systems dealt with ice nucleation of single levitated (Kr¨amer et al., 1996) or free-falling droplets (Wood et al., 2002) where detection of ice particles using depolarization has been performed. The influence of the particle orientation on the depolarization ratio is large, according to a previous modeling study (Nicolet et al., 2007). The single particle de-tection aspect has a major influence in terms of scattered light intensity and amount of light depolarization expected in that case.
In the present work, the design and the software of the ice detector device called IODE (Ice Optical DEtector) will be presented. The IODE device was connected to the bottom of the ZINC chamber where the scattering and polarization of water droplets and ice crystals were investigated. The results obtained with this detector will be discussed in the follow-ing chapters, along with perspectives, challenges and possi-ble future work.
2 Theory
The depolarization technique is commonly used in remote sensing applications, such as lidars. It has been proposed that depolarization can be used as a parameter for distinguishing between ice crystals and water droplets (Liou and Schottland, 1971). Liquid water particles are assumed to be spherical and therefore cause no depolarization whereas ice crystals can be considered as being non-spherical, causing partial
depolar-ization of the scattered light in the backward direction (Liou and Lahore, 1974).
In the 1960s, early atmospheric tests of the lidar technol-ogy were aimed at assessing the information content of the backscattering depolarization when probing clouds (Sassen, 1995). Thus, it was indicated that lidars using a polarized light source operating in the visible and near infrared wave-lengths of the electromagnetic spectrum should be capable of differentiating between water droplets and ice particles. To explain this property in a purely theoretical way, we use the so-called Stokes parameters given in a 4×1 vector to describe the properties of the laser source and the scattered light:
I= I Q U V (1)
where I is the net monochromatic energy flux. Q and U
express the state of linear polarization and V describes the state of circular polarization. The Stokes parameters are al-ways defined with respect to a reference plane. Defining the scattering plane with reference to the fully linearly polarized laser beam, the Stokes vector of the incident laser sourceIinc
becomes [1,1,0,0]T. It is then possible to define the 4×4 scattering matrixFto explicit the Stokes parameters of the scattered beam as a function of the incident Stokes param-eters. This definition is given with respect to the scattering plane
Isca= Csca 4π r2F(2)I
inc
(2)
whereCscais the average particle scattering cross section,r is the distance between the particle and the detector and2 is the scattering angle. The concept of the scattering matrix is particularly useful when all orientations of the particles are of equal probability, e.g. particles are randomly oriented. If each particle has a plane of symmetry and/or particles and their mirror particles are present in equal number, such a scat-tering medium is called macroscopically isotropic and sym-metric. Due to the symmetry, the scattering matrixFfor such a media is invariant with respect to the choice of the scatter-ing plane. The average scatterscatter-ing cross section is indepen-dent of the direction and polarization of the inciindepen-dent beam and the scattering matrix for this media has a block-diagonal structure (van de Hulst, 1957):
F(2)=
F11(2) F12(2) 0 0
F12(2) F22(2) 0 0
0 0 F33(2) F34(2)
0 0 −F34(2) F44(2)
The representation of the scattering matrix considering exact backscattering direction (2=180◦) from the polarized light
source is then given by (Mishchenko and Hovenier, 1995):
F(2=180◦)=
F11 0 0 0
0 F22 0 0 0 0 F33 0 0 0 0 F44
(4)
The ratio of the perpendicular to the parallel polarization components of backscattered light is defined by the linear depolarization ratioδand is equal to:
δ=I sca
⊥
I||sca=
F11(180◦)−F22(180◦) F11(180◦)+F22(180◦)
(5) For spheres,F11(180◦) =F22(180◦) which leads to the find-ing ofδ=0 for scattering by water droplets.
The depolarization technique was also used for in situ phase discrimination in the AIDA (Aerosol Interaction and Dynamics in the Atmosphere) chamber where ice nucleation experiments were performed (M¨ohler et al., 2003). The de-tection device uses an Ar+-laser (λ=488 nm) linearly polar-ized and directed horizontally through the chamber. Scatter-ing intensities are measured with photomultipliers (PMT) in the forward direction (2=4◦), and polarization resolved in the backward direction (2=176◦). The main difference to a Lidar is that perfect backscattering measurements are not performed due to technical reasons. In that case,F12andF21 are non-zero elements of the scattering matrixFandF12=F21 with the assumption of a collection of randomly oriented par-ticles. Therefore, the depolarization ratio is defined as the ratio between the perpendicular-polarized scattered light and the total one assuming an incident light polarized parallel to the scattering plane:
δ||=
I⊥sca I||sca+I⊥sca=
1 2
F11−F22 F11−F12
(6) For our specific experiments, we have to consider two im-portant aspects. First we are dealing with very low concen-trations of aerosols particles in the ZINC chamber. There-fore, single detection events occur as opposed to collections of particles as discussed above. Secondly, as single parti-cles have to be detected one by one, they are positioned in a specific orientation so that light scattering from a given ori-entation of the ice crystal has to be considered. This exper-imental definition of the depolarization ratio can be related to the theoretical one that can be derived from the elements of the phase matrixZ. This 4×4 matrix is obtained from the phase matrixSthat linearly transforms the electric field vec-tor components of the incident wave into the electric field vector components of the scattered wave.Ztakes the scatter-ing angle and the orientation of the particle given by its Euler angles into account (Mishchenko, 2000). The Stokes vector of the scattered light can then be obtained as:
Isca= 1 r2ZI
inc
(7)
With a laser beam polarized parallel to the scattering plane, we have Iinc=[1,1,0,0]T. Only the elementsZ11, Z12, Z21 andZ22can be considered and the Stokes vector of the scat-tered light can be written as:
Isca Qsca = 1 r2
Z11 Z12 Z21 Z22
Iinc Qinc
(8) and
Isca=Isca
|| +I⊥sca
Qsca=I||sca−I⊥sca (9)
Considering that Qinc=Iinc, Isca=(Z11 +Z12)Iinc and
Qsca=(Z21+Z22)Qinc, the following definition of the depolarization ratio of the light results from Eqs. (6) and (7): δ||=
I⊥sca Isca=
Z11+Z12−Z21+Z22 2(Z11+Z12)
(10) Similarly, the Stokes vector is given as Iinc=[1,−1,0,0]T when a light source polarized perpendicular to the scattering plane is used. Consequently,Qinc=−Iincand the depolariza-tion ratio can be defined as:
δ⊥=
I||sca Isca =
Z11−Z12+Z21−Z22 2(Z11−Z12)
(11) Here Z126=Z21 as a specific orientation of a single parti-cle is taken into account in this study. Using a collection of randomly oriented particles leads toZ12=Z21 and the same expression as in Eq. (6) is obtained.
3 Description
3.1 Experimental apparatus
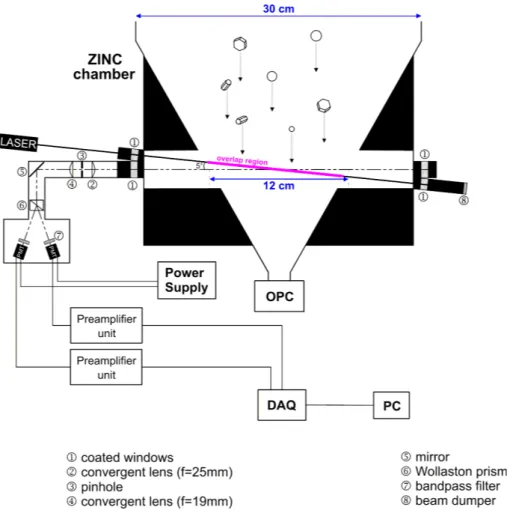
The IODE detector was placed at the lower end of the evapo-ration section of ZINC in its standard configuevapo-ration (Stetzer et al., 2008). Although droplets only reach the detector at very high supersaturations this configuration was neccesary to obtain data for both the IODE detector and the standard OPC for comparison of the data. In the IODE setup, the laser light source is a linearly polarized (100:1) 50 mW GaN diode laser operating at 407 nm (Oxxius OXV-405). Collimation is already included in the laser so that the beam divergence re-mains under 1 mrad. The laser beam is tilted downwards with an angle of 5◦with respect to the horizontal plane to have a scattering angle of 175◦. The beam (Gaussian type) has an elliptical diameter of 1×2.5 mm and the resulting overlap re-gion (area resulting from the intersection between the laser beam and the detector field of view i.e. the area where the particles can be detected) has a volume of 302 mm3. The whole detection system is shown in Fig. 1.
Fig. 1.Schematic diagram of the experimental setup.
may be randomly distributed over the width of the chamber, they have to be detected at any location along the overlap re-gion. Coated windows are mounted on both apertures to keep the chamber tight during experiments. Therefore, all optical components are separated from the chamber. The scattering plane is vertical in this configuration and the polarization can be easily switched in parallel or perpendicular position by turning the laser by 90◦to the cited plane in order to getδ||
orδ⊥, respectively.
Two convergent lenses of focal length 19 and 25 mm and a pinhole form a telescope to collect the scattered light and to prevent parasite light from the environment to enter the system. After being reflected at 90◦ with a coated mirror,
a Wollaston prism then splits the beam into its parallel and perpendicular polarization components. It has the specificity over other polarizing prism types of splitting the scattered ray almost symmetrically. One advantage is to avoid mul-tiple reflections in the prism if the angles are not precisely adjusted. The angle between the two resulting beams is ∼16◦. Before detection by two Hamamatsu H5783P pho-tomultipliers (PMT), both rays pass through bandpass filters
that stop wavelengths different from 407 nm to avoid dif-fused light from the environment reaching the photocathodes of the PMTs. The amplification gaingof the PMTs can be regulated from 2.81×10²to 2.3×10⁶. A Hamamatsu C7319 preamplifier unit placed directly at the signal output of each PMT transforms and amplifies the incoming current signal into a voltage signal. It has three switchable conversion ra-tios (Rconv); 105, 106and 107V/A and also has two switch-able bandwidth selections; 20 and 200 kHz. The complete transformation from the voltage signal to physical units can be obtained with the following formula:
I[pW]= U[V] ×10 15
ξ[mA/W] ×g×Rconv[V/A]
(12)
in both channels is included in the experimental definition of the depolarization ratios that can be used in our device:
δ||=
I⊥sca−I⊥BG
(I⊥sca−I⊥BG)+(I||sca−I||BG) (13)
δ⊥=
I||sca−I||BG
(I⊥sca−I⊥BG)+(I||sca−I||BG) (14) whereI||BGandI⊥BGstand for the average background inten-sities in the parallel and perpendicular channels (with respect to the scattering plane). Background measurements are done before activation experiments and take into account the scat-tered light from aerosols, air molecules and reflections from the walls.
3.2 Data acquisition
To measure and analyze the signal at the preamplifier out-puts, a 4-channel analog input data acquisition unit (DAQ) is used to provide 16-bit simultaneous sampling with inte-grated signal conditioning (National Instrument, 9215 mod-ule). It is connected to a PC with a USB interface (National Instrument, USB-9162 USB carrier). The maximum sam-pling rate is 100 kHz per channel and the typical operating voltage range is 10.4 V. According to simulations made by Stetzer et al. (2008) with the FLUENT computational fluid dynamics software, the average velocity of particles inside the ZINC chamber is 0.1 m/s. It rises up to 0.4 m/s at the height of the detector windows due to the shrinking in the collector cone. As the laser beam has a diameter of 2.5 mm in its parallel configuration, the interaction time between the beam and a particle is∼6 ms. With a given sampling rate of 10 kHz, one particle will then be sampled with approximately 60 points. For the perpendicular setup, the beam diameter is 1 mm, leading to an interaction time of 2.4 ms. The signal peak is theoretically defined with 24 points which is still suf-ficient for a good peak detection.
3.3 Data analysis
A program designed with LabView (National Instrument) was made for real-time data analysis and includes a peak detection algorithm for particle detection and depolarization measurements. The peak detection algorithm scans the sig-nal from the photomultipliers and searches for peaks in the following way: A peak is considered valid if it has the fol-lowing characteristics: First, the elements of a sequence of points begins below a threshold limitτ, then exceeds it for some time, and then returns to a value belowτ. Second, the interval that exceedsτ is greater than or equal to a given widthw. The peak-finding algorithm then fits a parabolic function to the data points aboveτ. Using a least-squares algorithm, the peak detection algorithm finally returns am-plitudes (intensities) and locations (time) of the peaks.
The determination of the best value for the threshold limit τ is done by the analysis of the background signal. If we as-sume that the probability density function for the background intensity follows a normal distribution, then the threshold valueτfor each channel (τ||andτ⊥) can be determined with
the application of the statistical law:
τ=µBG+nσBG (15)
Wherenis a positive number. To determine the depolariza-tion ratio in the backward direcdepolariza-tion, both peaks correspond-ing to the parallel and perpendicular channel have to appear at the same time, considering a tolerance time interval 1t that should be set within an optimum value. Peak detection is made first in the parallel channel. If a peak in the perpen-dicular channel is then located at the same time±1t,δ can be obtained from both peak intensities using Eqs. (13) and (14). If no corresponding peak in the perpendicular channel is found,δis set to zero.
For data filtering, a Lowpass filter is used to suppress noise while keeping peak characteristics in terms of intensity, lo-cation and width. Moreover, the standard deviation of the background is lowered and therefore the threshold limitτ. Hence, the detection efficiency for small particles increases.
3.4 Experiments
Ice nucleation experiments discussed here were carried out during the International Workshop on Comparing Ice Nucle-ation Measuring systems (ICIS 2007) that was held in Karl-sruhe, Germany. The main goal of this workshop was to compare different ice nucleation devices such as the ZINC chamber (Stetzer et al., 2008), the FINCH chamber (Bundke et al., 2008) and the CSU chamber (Rogers, 1988) during ice nucleation experiments. Several aerosol types were used, like Arizona test dust, soot particles, Canary Islands dust (CID), Israel dust (ID), Saharan dust (SD), and Snomax bac-teria (SB) (Morris et al., 2004). This latter product stems from cells ofP. syringaebacteria that have been freeze-dried and then killed by gamma radiation. The aerosol particles were sampled mostly from the NAUA chamber, which is part of the AIDA facility. It is a small-sized (3.7 m3) evacuable aerosol chamber made of stainless steel operating at ambi-ent temperature (stability:±2 K) (Schnaiter et al., 2006). All aerosols were generated and made available in the NAUA chamber.
Fig. 2. 100-ms duration real time measurements of the 4th activa-tion experiment made with Snomax bacteria.
the ZINC chamber. This could lead to coincidence problems with the optical particle detectors. The sheath air flow rates were both set to 2×4.9 lpm accordingly to maintain a total flow of 10 lpm through the instrument. During all experi-ments, a 500-Hz lowpass filter was applied to the IODE raw data. The conversion rate was set to 107V/A for both. The Preamplifier bandwidth was set to 20 kHz. This frequency is sufficient as the software samples the data with a rate of 10 kHz. The widthw for peak detection was set to 15 and the parameternto 3 for the threshold determination for both channels.
All peaks in the parallel and perpendicular channel were recorded during the activation cycles. The depolarization ra-tios were then directly derived from the peak intensities from the software. In addition to the IODE detector, an optical particle counter (OPC: Climet CI 3100) was connected to the bottom of the chamber to count the ice particles in the traditional way. This is done by amplifying and directing the signal of the OPC to a multichannel analyzer (AmpTek, Pocket MCA 8000A) to classify the ice crystals by size (Stet-zer et al., 2008). However, the optical particle counter is not able to provide any information about the phase of the parti-cles detected. Finally, a condensation particle counter (CPC) was used to obtain the total aerosol concentration. The OPC activated fraction is then determined with the CPC data.
4 Results
4.1 Snomax bacteria
For the Snomax bacteria experiment, A part of a 1.5-s dura-tion real-time signal during the 4th activadura-tion experiment is first shown in Fig. 2 as an example where both parallel and perpendicular channels are mentioned.
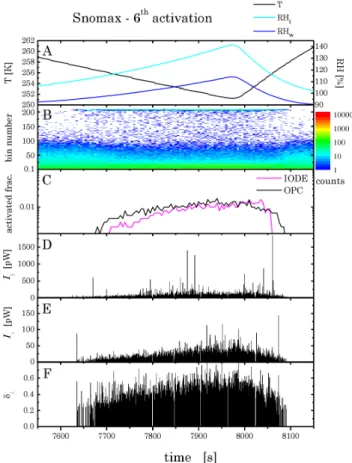
Fig. 3. Scheme of a typical activation experiment (Snomax bacte-ria 6th activation). Panel(A)shows the temperature and humidity profiles calculated from the wall temperatures and flows during the experiment. Panel(B)illustrates the raw data from the optical parti-cle counter as a color coded intensity spectra. The activated fraction of aerosol particles calculated from the OPC and IODE datasets are plotted in panel(C). The parallel and perpendicular intensities of the IODE detector are given in panels(D)and(E). Panel(F) illus-trates the depolarization ratio obtained from both intensities.
One typical activation event (Snomax 6th activation exper-iment) is described in Fig. 3. The temperature of the warm wall was set to 263 K.
Figure 3a shows the temperatureT and humidity profiles with respect to ice RHi and to water RHw for the sample
distribution. As channel 90 corresponds to a particle diam-eter of approximately 2.5 µm in diamdiam-eter according to our calibration, particles of this range of size are considered as ice particles. Channel 160 is related to a diameter of around 4 µm. The ratio of these two numbers is then the activated fraction. Figure 3d and e shows the individual peak intensi-ties from the parallel and the perpendicular channel obtained with the IODE detector, respectively. Finally, Fig. 3f depicts the depolarization ratio obtained from the intensities as dis-cussed above.
Snomax bacteria activate around water activation. As this is within the regime of immersion freezing, we may have ice crystals and water droplets simultaneously. Due to the evaporation section in the lower part of the ZINC chamber, these water droplets formed in the upper part should evap-orate and we should only have ice particles detected by the OPC and the IODE detector. However, if the relative hu-midity with respect to water is above a certain critical value, the water droplets do not have sufficient time to evaporate entirely due to their large sizes. Therefore, they are then detected with both detectors. We call this a “water break-through” event where we expect detection of ice crystals and water droplets at the same time although the evaporation sec-tion of the chamber is always sub-saturated with respect to water. Beyond this limit, water droplets do not have suf-ficient time to evaporate completely and therefore ice and water may coexist at the level of detection. We made calcu-lations for growth and evaporation of droplets for two sec-tions with constant condisec-tions to estimate the supersatura-tions above which droplets survive the evaporation section and reach the OPC. We find good agreement with the exper-imental breakthrough line for warm temperatures (250 and 255 K). For colder temperatures, the calculated breakthrough is at higher supersaturations than measured. However, this deviation is very likely a consequence of the simple two-section approach without taking into account the transitional supersaturation between main chamber and evaporation sec-tion. This transition is longer and more pronounced at high supersaturations and therefore low temperatures and results in longer growth times before reaching sub-saturated condi-tions.
In the Snomax 6th activation experiment, the parti-cle activation started at about t=7630 s (T=257.5 K and RHi=110.2%). This is revealed in the OPC raw data (panel b)
where ice crystals are detected (appearance of counts in channels from about 90 until 210). Everything before that time is considered as background (air loaded only with aerosols). Consequently, this is the background signal taken into account for the IODE peak algorithm tuning (determi-nation of the thresholdτ). The start and the increase of the activated particles fraction (panel c) was also remarkable as the curve rose to 0.01 between roughlyt=7800 to 8000 s. The activation was indicated with peaks in both the parallel and perpendicular channels found by the IODE detector. The on-set of ice in the IODE detector had a delay of about 5 s in
Fig. 4. Real-time signal average values (black and red dots) and their standard deviations (blue dashes) calculated within a 0.5-s time interval for the Snomax 6th experiment.
comparison to the OPC data. This is a good agreement since the OPC had a time resolution of 5 s. During the activation, the activated fraction determined with the OPC remained be-tween 0.01 and 0.02. No further activation was observed with increasing relative humidity and decreasing tempera-ture. In the IODE data, some large isolated peaks occurred, especially in the parallel channel. First, coincidence events seemed to happen, where simultaneous detection of several particles leads to a much higher intensity and to a miscount of peak numbers. This is mostly the case when concentra-tions of particles exceed roughly 70 IN per cm3. Secondly, the ice particles are distributed over the entire width of the chamber at the level of the detector. Closer particles thus generate a higher scattered intensity due to the dependence of the scattering intensity on the distancer to the detector (see Eq. 7). A rise in the perpendicular channel intensity also ap-peared during the activation run: The formation of bigger ice crystals along the experiment and/or a change in the particle shape as a result of varying temperature and relative humid-ity with respect to ice (Pruppacher and Klett, 1997). More-over temperature changes in the ZINC chamber can cause a small misalignment between the detector and the chamber, even though they were mechanically coupled but obviously not strong enough. An increase in the depolarization ratio was denoted.
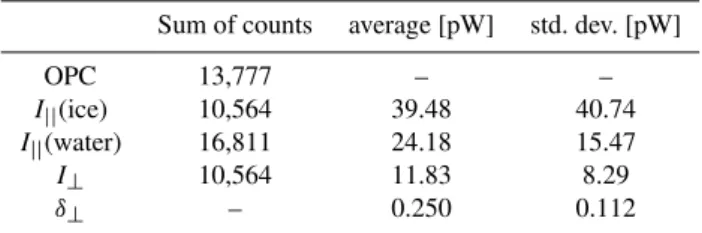
Table 1.Statistical analysis of the OPC and IODE data during the Snomax 6th activation experiment.
Sum of counts average [pW] std. dev. [pW]
OPC 13,777 – –
I||(ice) 10,564 39.48 40.74
I||(water) 16,811 24.18 15.47
I⊥ 10,564 11.83 8.29
δ⊥ – 0.250 0.112
In the mean values, it is hard to see a strong rise, especially in the perpendicular channel. On the contrary, the activation is nicely seen in terms of standard deviations (blue dashes). Their increase results from the individual peaks that enlarge the intensity distribution, making it therefore wider. How-ever, it remains difficult to obtain the exact timing of the start and termination of the activation. Table 1 indicates the values obtained during the Snomax 6th experiment from the IODE detector (intensities and depolarization ratios) and includes the OPC raw data.
The average values of all cases (Table 1) indicate that the large ice particles formed inside the chamber scatter more light than the non-depolarizing particles. These can be either water droplets or other particles that do not depolarize light. It is possible that un-activated aerosol particles that took up water are falsely detected as non-depolarizing particles. The Snomax particles may deliquesce but very likely no efflores-cence occurs afterwards in the evaporation section since rel-ative humidities with respect to water are still close to 100% at the warm temperatures of these experiments. Therefore, the particles exhibit a spherical shape and are large enough to be detected. Some small ice crystals might also exhibit a spherical shape, but even low asphericities can induce strong depolarization signals (Mishchenko and Sassen, 1998). The OPC counted a total amount of 13 777 particles during the activation whereas the IODE registered 10 564 non-spherical particles during the same time interval. According to pre-vious calibration tests made in the laboratory, the OPC has a detection efficiency between 50% and 60% for particles sizes of 0.5 µm in diameter, but is very likely to reach 100% for sizes we expect for our experiment (from 1 to 10 µm). There-fore, the IODE overestimates the total amount of particles, including also coincidence events. This might come from high background signals and/or noise that are counted as par-ticles. The lowpass filter frequency could also be set too high, allowing additional background signals to be falsely recorded.
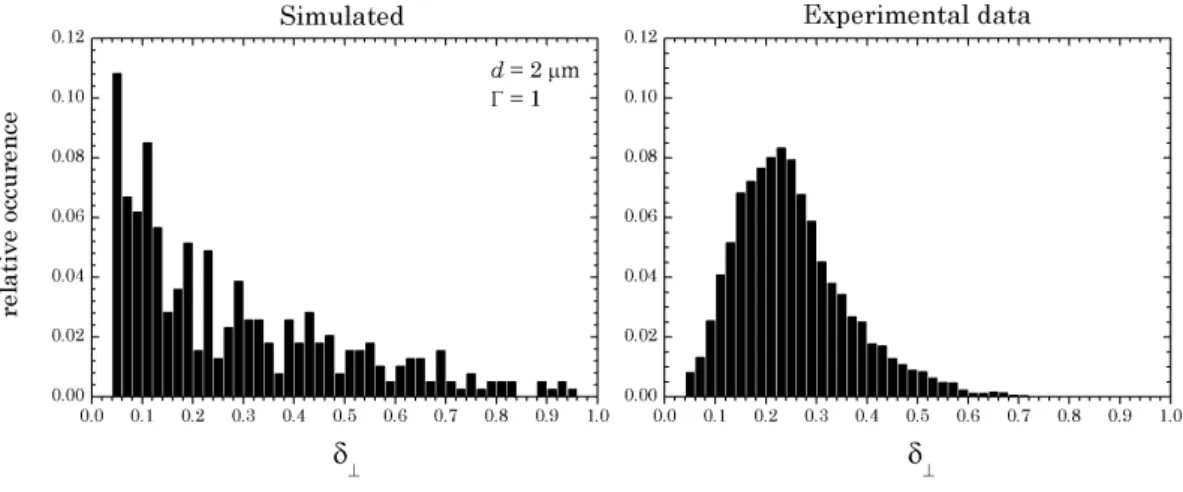
For comparison with previous model calculations (Nicolet et al., 2007), probability density functions were assembled using only data withδ⊥>0.04. This limit cannot be
mathe-matically deduced, but it ensures that the perpendicular light intensity is sufficiently high to be detected by the PMT. The comparison is made between the experimental data and the
modeled one for a 2-µm diameter particle with an aspect ratio of 1 (Fig. 5).
The average value obtained from the experiment is signif-icantly higher and shows a skewed distribution (right panel). The differences may be caused by the differences in shape and size of the real ice crystals in the ZINC chamber as com-pared to the idealized shapes used in the simulations. Theo-retically, the ice particles should be randomly oriented, given their settling velocity (∼0.4 m/s) and a diameter range be-tween 1 and 10 µm (Hallett, 1987). Moreover, the ice parti-cles were modeled as cylinders while their real shapes should be more complex. Unfortunately, it is not possible to inde-pendently determine the size and shape of these parameters and to have clear information about the size and the aspect ratio of these particles. Nevertheless, a similar decrease as calculated can be observed forδ⊥>0.4 with very few
occur-rences of high depolarization (Nicolet et al., 2007).
4.2 Israel dust
In the case of an activation made with Israel dust particles, the concentrations and the size of the aerosol particles were much larger as shown in Fig. 6 (panel b).
The starting point of the activation is clearly identifiable on the activated fraction panel. In that case, the activated frac-tion constantly increased until reaching the minimum tem-perature (237 K) and the maximum humidity with respect to ice (143%). The same evolution occurred for the parallel and perpendicular peak intensities. This translates into a rise in the particle size in a similar way like in the Snomax acti-vation experiment. On the contrary, the depolarization ra-tio stayed at the same level, showing that this parameter is no more dependent on the size, as it should be the case for large particle sizes (Nicolet et al., 2007). The activated frac-tions determined with the OPC and the IODE detectordif-fer significantly. Due to the high concentration of aerosols (∼2900 cm−3), the detection thresholdτ was difficult to set and was probably too high, which partly explains the few number of ice crystals detected.
4.3 Saharan dust
For this experiment, Saharan dust aerosols were injected in the ZINC chamber. The humidity conditions required for this sample were rather higher, peaking at RHi=173% and
RHw=133% at temperatures as low as 246.5 K. Figure 7
Fig. 5.Simulated occurrence of the depolarization ratioδ⊥considering a cylindrical ice crystal with an aspect ratio of 1 and a diameter of
2 µm (from Nicolet et al., 2007) (left panel) and depolarization ratioδ⊥obtained during the Snomax 6th activation experiment for the whole
IODE dataset (right panel).
Fig. 6.Scheme of the Israel dust 4th activation experiment.
particles and water droplets. The real activation profile of ice crystals as measured with the IODE detector did not ex-ceed 0.008. The number of ice particles detected represented about 1.3% of all particles recorded during the activation
ex-Fig. 7.Scheme of the Saharan dust 9th activation experiment.
Fig. 8.Histograms of parallel intensities (ice and water particles, upper panels), perpendicular intensities (bottom left panel) and depolariza-tion ratios (bottom right panel) during the Saharan dust 9th activadepolariza-tion experiment for the whole IODE dataset.
presence of higher peaks indicated the presence of ice crys-tals among the water drops. This trend suggests the following explanation: The mixture of water droplets and ice particles caused this overall slight rise in the average signal intensity. It was high enough to detect a high number of low intensity peaks. The statistical analysis of this activation experiment shown in Fig. 8 establishes that the ice crystals detected are a minority of all particles.
Although ice crystals were in the minority, they scattered more light than water drops and exhibit a quasi-normal dis-tribution in the frequency plot. The water droplets scattering intensity showed nearly a double peak structure: We sug-gest that the first peak is related to single particle detection whereas the second maximum distribution (95 pW) corre-sponds to coincidence events. Still, the perpendicular chan-nel consisted almost entirely of low intensities. This could indicate a particular shape of the ice crystals that does not generate a strong depolarization effect. In the real-time av-eraged signal for both channels, the water activation can be clearly identified, too (Fig. 9).
The average and standard deviation signals illustrate a large increase in the parallel channel. The perpendicular one is slightly rising – sufficiently to get all the low peaks as pre-viously discussed – but nothing comparable to the parallel
Fig. 9. Real-time signal average values (black and red dots) and their standard deviations (blue dashes) calculated within a 0.5-s time interval for the Saharan dust 9th activation experiment.
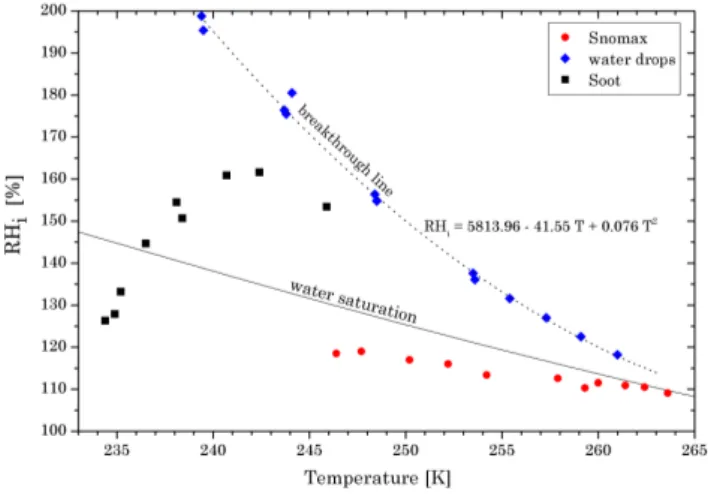
Fig. 10.Critical saturation ratios for Snomax and soot particles ob-tained from the OPC from ZINC experiments using a 1%-activated fraction as threshold for the onset of freezing. The plain line shows the water saturation line using the parametrizations from Murphy and Koop (2005) and the dotted line illustrates the breakthrough section where water droplets survive the evaporation section of the ZINC chamber (blue diamonds).
5 Discussion
Concerning the water activation experiments discussed pre-viously, they were all recorded in the same way and are plot-ted in Fig. 10 (blue diamonds) together with Snomax bacteria and soot experiments.
The dotted line defines the “breakthrough” threshold above which water droplets which had formed inside the chamber are surviving the passage through the evaporation section. As all points follow a clear trend, a best fit is given by the dotted line. These water breakthrough events are not dependent on the aerosol type, but are only due to the tech-nical characteristics of the ZINC chamber. It is therefore unique for this chamber. Another example is given in Fig. 11 which depicts the total counts of both the OPC and IODE detectors for a Snomax activation experiment where water droplet breakthrough occurred.
This activation experiment can be divided in two parts: The first one concerns only ice crystals as no water droplets survived the ZINC evaporation section. The ice peak counts from the IODE range between 35% and 97% of the total OPC counts, with values mainly around 70%. The most interesting part is the “water breakthrough” occurring att=740 s: From that time, the counts from the OPC and the water peaks de-termined with the IODE device increased drastically. The temperature was 253.6 K and we had a relative humidity with respect to ice of 136% (112.7% with respect to water). From t=790 s, the IODE water droplet counts started to stay con-stant at values of approximately 13 cm−3, showing a satu-ration effect of the IODE detector whereas the OPC counts continued to climb.
Fig. 11. Optical particle counter counts (black solid line), water peaks (blue line) and ice peaks counts obtained from the IODE de-tector (magenta solid line) for the Snomax 7th activation experiment and considering an integration time of 5 s.
It is not possible to only rely on the OPC data as it does not distinguish between the water and the ice phase. Con-sequently, this leads to miscounts of the total particle num-ber and we cannot determine the fraction of ice particles present during these events. However, ice crystals can be observed with the IODE detector even when water break-through events occur. Thus, it is possible to show and to follow the formation of ice crystals along these processes. Hence the evaporation section is not necessary anymore for future experiments. An additional information to identify water breakthrough events can be done with a statistical anal-ysis of the depolarization ratios of all ice crystals during a whole activation experiment. This is especially useful in case of high aerosol concentration events.
6 Conclusions
A depolarization detector device was designed and realized to detect water droplets and ice particles that can coexist in a diffusion chamber. This system allows the discrimination be-tween the liquid and the solid phase. Ice crystals depolarize the incident polarized light whereas spherical water drops do not. The parallel and the perpendicular component (to the in-cident light polarization) of the scattering light intensities are measured and the depolarization ratio is determined. Peaks in both channels are counted with a peak detection algorithm. The signal noise is reduced with a lowpass filter. This lowers the standard deviation of the background signal and therefore increases the detection efficiency.
experiments were discussed. In the first one, ice activation occurred with a low particle concentration (Snomax bacte-ria). In the second experiment, a higher particle concentra-tion of Israel dust and in the third one of Saharan dust was used. It was possible to identify the onset and termination of each ice activation event with the IODE detector. In the case of ice activation, peak intensities in both parallel and per-pendicular channels increased simultaneously. The resulting depolarization ratios showed values ranging from 0.02 up to 0.8, which demonstrates that single ice particle detection is possible according to theoretical calculations (Nicolet et al., 2007). In the Israel dust experiment, it was also possible to determine the activation onset. Water droplets at very high supersaturations were well determined in the Saharan dust experiment. Even though the particle concentration was very high, causing some saturation problems with the peak algo-rithm, it was possible to identify the presence of liquid parti-cles by using the 0.5-s average real-time values together with their standard deviations. This alternative solution works well for high particle concentrations. A clear increase in the parallel channel was seen, whereas the perpendicular chan-nel signal exhibited no significant rise. It was also shown that the ice particles scatter more light than water droplets and have a broader intensity distribution. Thus, they can be discriminated from water droplets. Additionally, it must be mentioned that the detector does not see the aerosol particles as their sizes (reaching up to 500 nm in diameter roughly) are too small to induce sufficient scattering.
However, some uncertainties might occur during experi-ments. The alignment of the laser beam passing through the chamber plays a major role in order to miss as few particles as possible. In presence of high particle concentrations, sev-eral particles may falsely be counted as a single event. In case of ice crystals, some specific particle orientations do not induce a significant depolarization ratio, causing them to be miscounted as water droplets. A change in the background intensity during experiments can lead to a misinterpretation of the threshold values in the peak algorithm. These varia-tions may be caused by small displacements of the chamber relative to the detector, owing to the walls cooling at differ-ent temperatures. This can lead to a miscount of peaks and to apparent background peaks even if there is no activation. For the moment, the readjustments have to be done manually.
The first successful tests demonstrate that the IODE device is a promising tool to detect ice crystals and water droplets simultaneously in cloud diffusion chambers. The main chal-lenge is to be able to lower the detection efficiency as much as possible by reducing the background noise in order to cap-ture also single particle events at low particle concentration. Particle detection in high concentration conditions is a prob-lem: Peak counts have to be as close as possible to the ex-pected known values as saturation might occur, meaning that the IODE detector is not able to count all particles if the concentration is too high. Attaching the IODE detector di-rectly to the ZINC chamber windows (without using a
bread-board for the optical elements) can avoid background inten-sity changes along experiments. Further applications with the IODE device can be made to investigate mixed-phase clouds in airborne experiments where both liquid and solid phases can coexist. We also plan to equip the setup with an additional detector in forward direction to be more sensitive to estimate particle sizes and eventually be able to detect un-activated aerosol particles.
Acknowledgements. The authors thank the reviewers for useful
comments and suggestions. They thank the Swiss National Science Foundation for the support of this research under grant 200021-107663/1 and all the AIDA team during the ICIS 2007 workshop.
Edited by: M. Kulmala
References
Bundke, U., Nilius, B., Jaenicke, R., Wetter, T., Klein, H., and Bingemer, H.: The Fast Ice Nucleus chamber FINCH, Atmos. Res., 90, 180–186, 2008.
B¨uttner, S.: Streulicht experimente an asph¨arischen Aerosolpar-tikeln: depolarization und Vorw¨artsstreuverh¨altnis von Mineral-staub und Eiskristallen: Dissertation FZKA 6989, PhD thesis, Forschungszentrum Karlsruhe, 2004.
Cantrell, W. and Heymsfield, A.: Production of ice in tropospheric clouds – a review, B. Am. Meteorol. Soc., 86, 795–807, 2005. Forster, P., Ramaswamy, V., Artaxo, P., Bernsten, T., Betts, R.,
Fahey, D. W., Haywood, J., Lean, J., Lowe, D. C., Myhre, G., Nganga, J., Prinn, R., Raga, G., Schulz, M., and Dorland, R. V.: Climate Change 2007: The Physical Science Basis, Contribution of Working Group I to the Fourth Assessment Report of the Inter-governmental Panel on Climate Change, Cambridge University Press, Cambridge, UK and New York, USA, 2007.
G˝otz, G., M´esz´aros, E., and Vali, G.: Atmospheric Particles and Nuclei, Akad´emiai Kiad´o, Budapest, 1991.
Hallett, J.: Faceted snow crystals, J. Opt. Soc. Am. A, 4, 581–588, 1987.
Hirst, E., Kaye, P. H., Greenway, R. S., Field, P., and Johnson, D. W.: Discrimination of micrometer-sized ice and super-cooled droplets in mixed-phase cloud, Atmos. Environ., 35, 315–348, 2001.
Kr¨amer, B., Schwell, M., H¨ubner, O., Vortisch, H., Leisner, T., R¨uhl, E., Baumg¨artel, H., and W¨oste, L.: Homogeneous Ice Nu-cleation Observed in Single Levitated Micro Droplets, Ber. Bun-senges. Phys. Chem., 100, 1911–1914, 1996.
Lawson, R. P. and Cormack, R. H.: Theoretical design and prelim-inary tests of two new particle spectrometers for cloud micro-physics research, Atmos. Res., 35, 315–348, 1995.
Liou, K. N. and Lahore, H.: Laser sensing of cloud composition: a Backscattered depolarization technique, J. Appl. Meteorol., 13, 257–263, 1974.
Liou, K. N. and Schottland, R. M.: Multiple backscattering and depolarization from water clouds for a pulsed lidar system, J. Atmos. Sci., 28, 772–784, 1971.
Lohmann, U. and Feichter, J.: Global indirect aerosol effects: a review, Atmos. Chem. Phys., 5, 715–737, 2005,
McFarquhar, G. M., Yang, P., Macke, A., and Baran, A. J.: A new representation of the Single-scattering solar radiative properties for tropical anvils using observed ice crystal size and shape dis-tributions, J. Atmos. Sci., 59, 2458–2478, 2002.
Mishchenko, M. I.: Calculation of the amplitude matrix for a non-spherical particle in a fixed orientation, Appl. Optics, 39, 1026– 1031, 2000.
Mishchenko, M. I. and Hovenier, J. W.: Depolarization of light backscattered by randomly oriented nonspherical particles, Opt. Lett., 20, 1356–1358, 1995.
Mishchenko, M. I. and Sassen, K.: Depolarization of lidar returns by small ice crystals: An application to contrails, Geophys. Res. Lett., 25, 309–312, 1998.
M¨ohler, O., Stetzer, O., Schaefers, S., Linke, C., Schnaiter, M., Tiede, R., Saathoff, H., Kr¨amer, M., Mangold, A., Budz, P., Zink, P., Schreiner, J., Mauersberger, K., Haag, W., K¨archer, B., and Schurath, U.: Experimental investigation of homogeneous freez-ing of sulphuric acid particles in the aerosol chamber AIDA, At-mos. Chem. Phys., 3, 211–223, 2003,
http://www.atmos-chem-phys.net/3/211/2003/.
Morris, C. E., Georgakopoulos, D. G., and Sands, D. C.: Ice nu-cleation active bacteria and their potential role in precipitation, J. Phys. IV France, 121, 87–103, 2004.
Murphy, D. and Koop, T.: Review of the vapour pressures of ice and Supercooled water for atmospheric applications, Q. J. Roy. Meteorol. Soc., 6, 2981–2990, 2005.
Nicolet, M., Stetzer, O., and Lohmann, U.: Depolarization ratios of singles ice particles assuming finite circular cylinders, Appl. Optics, 46, 4465–4476, 2007.
Pruppacher, H. R. and Klett, J. D.: Microphysics of Clouds and Precipitation, Kluwer Acad., Norwell, Mass., 1997.
Rogers, D. C.: Development of a continuous flow thermal gradient diffusion chamber for ice nucleation studies, Atmos. Res., 22, 149–181, 1988.
Rogers, D. C.: Measurements of natural ice nuclei with a continu-ous flow diffusion chamber, Atmos. Res., 29, 209–228, 1993. Rogers, D. C., DeMott, P. J., Kreidenweis, S. M., and Chen, Y.: A
Continuous-flow diffusion chamber for airborne measurements of ice nuclei, J. Atmos. Oceanic Technol., 18, 725–741, 2001. Sassen, K.: Lidar cloud research, Rev. Laser Eng., 23, 148–153,
1995.
Schnaiter, M., Gimmler, M., Llamas, I., Linke, C., J¨ager, C., and Mutschke, H.: Strong spectral dependence of light absorption by organic carbon particles formed by propane combustion, Atmos. Chem. Phys., 6, 2981–2990, 2006,
http://www.atmos-chem-phys.net/6/2981/2006/.
Spurny, K.: Atmospheric condensation nuclei P. J. Coulier 1875 and J. Aitken 1880 (historical review), Aerosol. Sci. Technol., 32, 243–248, 2000.
Stetzer, O., Baschek, B., L¨u¨ond, F., and Lohmann, U.: The Zurich Ice Nucleation Chamber (ZINC) – A new instrument to investi-gate atmospheric ice formation, Aerosol. Sci. Technol., 42, 64– 74, 2008.
Szyrmer, W. and Zawadzki, I.: Biogenic and anthropogenic sources of ice-forming nuclei: A review, B. Am. Meteorol. Soc., 78(2), 209–228, 1997.
Vali, G.: Atmospheric ice nucleation – A review, J. Rech. Atmos., 19, 105–115, 1985.
van de Hulst, H. C.: light Scattering by Small Particles, Wiley, New-York, 1957.