ACPD
11, 16693–16744, 2011CARIBIC measurements of
Eyjafjallaj ¨okull plumes
A. Rauthe-Sch ¨och et al.
Title Page
Abstract Introduction
Conclusions References
Tables Figures
◭ ◮
◭ ◮
Back Close
Full Screen / Esc
Printer-friendly Version Interactive Discussion
Discussion
P
a
per
|
Dis
cussion
P
a
per
|
Discussion
P
a
per
|
Discussio
n
P
a
per
|
Atmos. Chem. Phys. Discuss., 11, 16693–16744, 2011 www.atmos-chem-phys-discuss.net/11/16693/2011/ doi:10.5194/acpd-11-16693-2011
© Author(s) 2011. CC Attribution 3.0 License.
Atmospheric Chemistry and Physics Discussions
This discussion paper is/has been under review for the journal Atmospheric Chemistry and Physics (ACP). Please refer to the corresponding final paper in ACP if available.
CARIBIC aircraft measurements of
Eyjafjallaj ¨okull volcanic plumes in
April/May 2010
A. Rauthe-Sch ¨och1, A. Weigelt2, M. Hermann2, B. G. Martinsson3, A. K. Baker1, K.-P. Heue1, C. A. M. Brenninkmeijer1, A. Zahn4, D. Scharffe1, S. Eckhardt5, A. Stohl5, and P. F. J. van Velthoven6
1
Max Planck Institute for Chemistry, Atmospheric Chemistry, Mainz, Germany
2
Leibniz Institute for Tropospheric Research, Leipzig, Germany
3
Lund University, Division of Nuclear Physics, Lund, Sweden
4
Karlsruhe Institute of Technology, Institute for Meteorology and Climate Research, Karlsruhe, Germany
5
Norwegian Institute for Air Research (NILU), Oslo, Norway
6
Royal Netherlands Meteorological Institute (KNMI), De Bilt, The Netherlands
Received: 17 March 2011 – Accepted: 18 May 2011 – Published: 15 June 2011
Correspondence to: A. Rauthe-Sch ¨och (armin.rauthe-schoech@mpic.de)
ACPD
11, 16693–16744, 2011CARIBIC measurements of
Eyjafjallaj ¨okull plumes
A. Rauthe-Sch ¨och et al.
Title Page
Abstract Introduction
Conclusions References
Tables Figures
◭ ◮
◭ ◮
Back Close
Full Screen / Esc
Printer-friendly Version Interactive Discussion
Discussion
P
a
per
|
Dis
cussion
P
a
per
|
Discussion
P
a
per
|
Discussio
n
P
a
per
|
Abstract
The Civil Aircraft for the Regular Investigation of the Atmosphere Based on an Instru-ment Container (CARIBIC) project investigates physical and chemical processes in the Earth’s atmosphere using a Lufthansa Airbus long-distance passenger aircraft. After the beginning of the explosive eruption of the Eyjafjallaj ¨okull volcano on Iceland on
5
14 April 2010, the first CARIBIC volcano-specific measurement flight was carried out over the Baltic Sea and Southern Sweden on 20 April. Two more flights followed: one over Ireland and the Irish Sea on 16 May and the other over the Norwegian Sea on 19 May 2010. During these three special mission flights the CARIBIC container proved its merits as a versatile and comprehensive flying laboratory. The elemental
composi-10
tion of particles collected over the Baltic Sea during the first flight (20 April) indicated the presence of volcanic ash. Over Northern Ireland and the Irish Sea (16 May), the DOAS system detected SO2and BrO co-located with volcanic ash particles that increased the
aerosol optical depth. Over the Norwegian Sea (19 May), the optical particle counter detected a strong increase of particles larger than 400 nm diameter in a region where
15
ash clouds were predicted by aerosol dispersion models. Aerosol particle samples collected over the Irish Sea and the Norwegian Sea showed large relative enhance-ments of the eleenhance-ments silicon, iron, titanium and calcium. Non-methane hydrocarbon concentrations in whole air samples collected on 16 May and 19 May 2010 showed a pattern of removal of several hydrocarbons that is typical for chlorine chemistry in
20
ACPD
11, 16693–16744, 2011CARIBIC measurements of
Eyjafjallaj ¨okull plumes
A. Rauthe-Sch ¨och et al.
Title Page
Abstract Introduction
Conclusions References
Tables Figures
◭ ◮
◭ ◮
Back Close
Full Screen / Esc
Printer-friendly Version Interactive Discussion
Discussion
P
a
per
|
Dis
cussion
P
a
per
|
Discussion
P
a
per
|
Discussio
n
P
a
per
|
1 Introduction
The Eyjafjallaj ¨okull volcano (also known as Eyjafj ¨oll or Eyjafjalla volcano) on the southern coast of Iceland (63.62◦N, 19.63◦W) has been dormant for nearly two cen-turies. Previous eruptions occurred around 920, in 1612 or 1613 and in 1821–1823 (Sigmundsson et al., 2010). The explosive phase of the recent eruption began on
5
14 April 2010 and lasted until 22 May (Sigmundsson et al., 2010). The contact of melt-water from the overlying glacier with the hot magma increased the strength and ex-plosivity of the eruption (phreatomagmatic explosions). The high explosive force was accompanied by the production of unusually fine ash particles with 50 %–70 % of them being smaller than 100 µm (Sanderson, 2010), 20 % being smaller than 10 µm and 7 %
10
being smaller than 2.6 µm in diameter in ash samples collected close to the volcano (G´ıslason and Alfredsson, 2010). The smallest ash particles (.20 µm diameter) were transported over long distances due to their slow gravitational settling whereas the larger particles fell out closer to the volcano (Ginoux, 2003; Schumann et al., 2011). Eruptions of the Eyjafjalla ¨okull volcano typically produce relatively small volumes of
15
ejected matter on the order of 0.1 km3 (Sturkell et al., 2009). This also applies to the eruption in April/May 2010 (Gudmundsson et al., 2010); hence it was a Volcanic Erup-tion Index 4 erupErup-tion (Newhall and Self, 1982; Jenkins, 2010). The erupErup-tion strongly af-fected European aviation through the prevailing weather situation with a high pressure system (anticyclone) south of Iceland both at the surface and at higher levels (Petersen,
20
2010). The southeastward winds over Iceland rapidly transported the emitted ash to Central Europe followed by consecutive re-circulation and trapping of the ash over Eu-rope, thus leading to an unprecedented number of flight cancellations (Gertisser, 2010; Flentje et al., 2010).
When the ash clouds from the Eyjafjallaj ¨okull volcano reached Central Europe, a
25
ACPD
11, 16693–16744, 2011CARIBIC measurements of
Eyjafjallaj ¨okull plumes
A. Rauthe-Sch ¨och et al.
Title Page
Abstract Introduction
Conclusions References
Tables Figures
◭ ◮
◭ ◮
Back Close
Full Screen / Esc
Printer-friendly Version Interactive Discussion
Discussion
P
a
per
|
Dis
cussion
P
a
per
|
Discussion
P
a
per
|
Discussio
n
P
a
per
|
Munich and other EARLINET stations in Germany (Ansmann et al., 2010; Emeis et al., 2011; Gasteiger et al., 2011) and over Belsk in Poland (Pietruczuk et al., 2010). The ceilometer network of the German Weather Service measured the backscatter ratios at 36 stations in Germany (Flentje et al., 2010; Emeis et al., 2011). In addition, ozone son-des and in situ measurements taken at the Hohenpeißenberg observatory in Southern
5
Germany, at the environmental research station Schneefernerhaus on the Zugspitze mountain in the German Alps and with an ultralight aircraft over Southern Germany delivered information about the presence, size, concentration and composition of the ash particles (Flentje et al., 2010; Emeis et al., 2011; Sch ¨afer et al., 2011). Particle concentrations, size distributions and sulphur dioxide concentrations were also
mea-10
sured at the Swiss research station Jungfraujoch in the Alps (Bukowiecki et al., 2011). The Falcon research aircraft of the German Aerospace Center (DLR) conducted 17 re-search flights between 19 April and 18 May 2010 measuring the ash concentration, particle size, particle composition and optical properties, as well as concentrations of carbon monoxide (CO), ozone (O3) and sulphur dioxide (SO2) (Schumann et al.,
15
2011). Also the French Service des Avions Franc¸ais Instrument ´es pour la Recherche en Environnement (SAFIRE) ATR 42 and Falcon20 aircrafts, the British Facility for Airborne Atmospheric Measurements (FAAM) BAe146 and Natural Environment Re-search Council (NERC) Dornier Do228 aircrafts, the Netherlands National Aerospace Laboratory (NLR) Citation II aircraft, the Swiss METAIR Dimona motor glider, the
Span-20
ish CASA 212 aircraft and a number of smaller aeroplanes conducted measurement flights over Europe during the 2010 Eyjafjallaj ¨okull eruption.
The Civil Aircraft for the Regular Investigation of the Atmosphere Based on an Instru-ment Container (CARIBIC) project investigates the physical and chemical processes in the Earth’s atmosphere using a Lufthansa Airbus A340-600 long-distance passenger
25
ACPD
11, 16693–16744, 2011CARIBIC measurements of
Eyjafjallaj ¨okull plumes
A. Rauthe-Sch ¨och et al.
Title Page
Abstract Introduction
Conclusions References
Tables Figures
◭ ◮
◭ ◮
Back Close
Full Screen / Esc
Printer-friendly Version Interactive Discussion
Discussion
P
a
per
|
Dis
cussion
P
a
per
|
Discussion
P
a
per
|
Discussio
n
P
a
per
|
telescopes of a multi-axis differential optical absorption spectrometer (MAX-DOAS) system and a forward looking video camera. During routine operations, the CARIBIC container is installed once per month into the forward cargo compartment of the air-craft where it is connected to the inlet system. It then makes measurements during four consecutive routine passenger flights of the aircraft. Lufthansa has been
sup-5
porting the CARIBIC project since 2004. Between May 2005 and February 2011, more than 220 measurement flights were carried out with the CARIBIC container (see http://www.caribic-atmospheric.com/). The original suite of instruments onboard the CARIBIC container has been described in detail by Brenninkmeijer et al. (2007), but has been upgraded since then (see Sect. 2).
10
CARIBIC has already measured effects of volcanic eruptions on atmospheric trace gases and aerosols on previous occasions. For instance, after the Kasatochi volcano
erupted in 2008, plumes of SO2were found over Europe (Heue et al., 2010) and the
change in elemental composition of lower stratospheric aerosol particles before and after this eruption was analysed (Martinsson et al., 2009).
15
The most relevant instruments for the investigation of the 2010 Eyjafjallaj ¨okull vol-canic plumes are the new optical particle counter (OPC) briefly described here in Sect. 2.1, the particle sampler (Nguyen et al., 2006), the improved MAX-DOAS system for remote detection of trace gases (Dix et al., 2009) and the whole air sampler (Bren-ninkmeijer et al., 2007). The air samples are analysed after each flight sequence in
20
the laboratory for greenhouse gases (Schuck et al., 2009) and a suite of non-methane hydrocarbons (Baker et al., 2010) and halocarbons (O’Sullivan, 2007).
Directly after the first closure of the air space above Germany, Lufthansa approached the CARIBIC team with the suggestion for a special volcano flight mission as infor-mation about the ash clouds was scarce. With a lead time of only two days, the
25
ACPD
11, 16693–16744, 2011CARIBIC measurements of
Eyjafjallaj ¨okull plumes
A. Rauthe-Sch ¨och et al.
Title Page
Abstract Introduction
Conclusions References
Tables Figures
◭ ◮
◭ ◮
Back Close
Full Screen / Esc
Printer-friendly Version Interactive Discussion
Discussion
P
a
per
|
Dis
cussion
P
a
per
|
Discussion
P
a
per
|
Discussio
n
P
a
per
|
The immediate goal of these special measurement flights was to collect as much information as possible regarding the number, size and concentration of the ash par-ticles as well as their composition. The main hazard from volcanic ash clouds to jet aircraft arises from the high temperatures inside aircraft turbines which lead to melting of glassy volcanic particles. The melted ash can cover parts of the inside of the
tur-5
bines and lead to a loss of power or even flame-out of the engines. The sharp volcanic ash particles combined with the high air speed of jet aircraft can lead to sand-blasting of the cockpit windows and even to a complete blinding (e.g. Casadevall, 1993; Prata and Tupper, 2009). The ash particles can also clog aircraft openings like pitot tubes, corrupting speed and pressure readings, or air filters. In severe cases, corrosion by
vol-10
canic sulphuric acid can inflict damage to the aircraft fuselage and turbines (Casade-vall, 1993). Assessment of such hazards and ultimately decisions about the closure of air space therefore requires detailed knowledge of the ash cloud’s composition, particle sizes and mass concentrations.
This paper discusses the results from the three special mission CARIBIC volcano
15
flights. It starts with an overview of the instruments inside the CARIBIC measure-ment container in Sect. 2, including a description of the new OPC deployed for the first time during the CARIBIC volcano measurement flights. The three flights are de-scribed in Sect. 3 and Sect. 4 summarises the results from the flights. Comparisons of the CARIBIC ash measurements with predictions from the NILU FLEXPART model
20
are presented in Sect. 5. The different aspects of the measurement results from the CARIBIC volcano flights are discussed in Sect. 6. A short summary of this study is given in Sect. 7.
2 CARIBIC instruments
The particle detection and sampling uses air collected via the aerosol inlet probe which
25
ACPD
11, 16693–16744, 2011CARIBIC measurements of
Eyjafjallaj ¨okull plumes
A. Rauthe-Sch ¨och et al.
Title Page
Abstract Introduction
Conclusions References
Tables Figures
◭ ◮
◭ ◮
Back Close
Full Screen / Esc
Printer-friendly Version Interactive Discussion
Discussion
P
a
per
|
Dis
cussion
P
a
per
|
Discussion
P
a
per
|
Discussio
n
P
a
per
|
(Brenninkmeijer et al., 2007). During the CARIBIC container upgrade in autumn 2009, a new optical particle counter (OPC) was constructed by the Leibniz Institute for Tro-pospheric Research (IfT, Leipzig) to measure the sub-micrometre aerosol particle size distribution. This OPC was flown for the first time during the CARIBIC volcano flights. A detailed description of the new OPC will be published by Weigelt (2011). The
fol-5
lowing section contains a short overview of the instrument, its characteristics and the OPC data analysis.
2.1 The new CARIBIC optical particle counter
The small, lightweight and very robust KS-93 OPC from RION Co., Ltd. (Japan) was
chosen as basis instrument for the CARIBIC OPC unit. Housed inside a 19′′ 5U
10
(221 mm height) rack unit, a computer controlled gas flow system with two mass flow controllers (MKS, Germany) and a fully automated data acquisition (PXI, National In-struments) were arranged around the KS-93. To reduce wrong particle size classifica-tion due to laser field inhomogeneities, the measurement air is focused to the centre of the optics by applying particle-free sheath air in front of the optics. This sheath air
15
is filtered air drawn in from inside the CARIBIC container. Sensitivity studies indicated the best signal to noise ratio for a sheath air to measurement air ratio of 9:1.
To avoid contamination by strongly polluted air around the airport, the OPC unit is set into stand-by mode by the CARIBIC master computer during takeoffand landing. In this stand-by mode the tubes inside the OPC unit are flushed with filtered air provided
20
by a small diaphragm pump. When the aircraft reaches a pressure altitude of 700 hPa, the CARIBIC master computer sets the OPC unit into measurement mode. In this mode 15 cm3min−1 of measurement air and 135 cm3min−1 of sheath air are drawn through the KS-93 optics. The pressure inside the measurement cells changes with ambient pressure. But tests have shown that the KS-93 response is very stable in a
25
ACPD
11, 16693–16744, 2011CARIBIC measurements of
Eyjafjallaj ¨okull plumes
A. Rauthe-Sch ¨och et al.
Title Page
Abstract Introduction
Conclusions References
Tables Figures
◭ ◮
◭ ◮
Back Close
Full Screen / Esc
Printer-friendly Version Interactive Discussion
Discussion
P
a
per
|
Dis
cussion
P
a
per
|
Discussion
P
a
per
|
Discussio
n
P
a
per
|
analyse even the form of individual particle pulses. Furthermore, the time resolution for the particle size distribution can be varied and chosen case-by-case during data analysis. For statistical reasons, three minutes are used in this study. All other data needed to calculate the particle concentration (volume flow, pressures and tempera-tures) are recorded with 10 Hz resolution.
5
For calibration of the OPC unit different kinds of aerosols encountered in the various CARIBIC flight regions have to be considered. Depending on their refractive indices, particles of identical particle diameter and shape cause different scattering signals. At mid-latitudes the CARIBIC aircraft flies quite often in lowermost stratospheric air (van Velthoven, 2011). For such air masses the particle composition is dominated
10
by sulphuric acid (Murphy et al., 2007). In contrast, in the mid-latitude upper tropo-sphere (UT) and tropical middle tropotropo-sphere (MT), besides sulphuric acid, also ammo-nium sulphate, different organics (organic carbon), as well as soot (elemental carbon) become important (Dibb et al., 1999; Kojima et al., 2004; Schwarz et al., 2006; Froyd et al., 2009; Morgan et al., 2009; Pratt and Prather, 2010; Schwarz et al., 2010). Upper
15
tropospheric particles are usually dominated by sulphurous and carbonaceous material (Nguyen et al., 2008; Martinsson et al., 2009).
To obtain a uniform and consistent OPC data analysis for CARIBIC, a refractive index sensitivity study was carried out using three internal mixed aerosols representative of (a) the mid-latitude lowermost stratosphere (LMS), (b) the mid-latitude UT and (c) the
20
tropical MT (Table 1). Using volume mixing rules for particle refractive index and den-sity as well as a Mie scattering code for spherical particles, the OPC response curve was calculated for each of the three characteristic aerosol compositions. As an exam-ple, the calibration curve for the mid-latitude UT particles is shown in Fig. 2a. Using the three calibration curves and measured particle size distributions from a CARIBIC
25
ACPD
11, 16693–16744, 2011CARIBIC measurements of
Eyjafjallaj ¨okull plumes
A. Rauthe-Sch ¨och et al.
Title Page
Abstract Introduction
Conclusions References
Tables Figures
◭ ◮
◭ ◮
Back Close
Full Screen / Esc
Printer-friendly Version Interactive Discussion
Discussion
P
a
per
|
Dis
cussion
P
a
per
|
Discussion
P
a
per
|
Discussio
n
P
a
per
|
calibration 8.3 % higher than the mass obtained from the mid-latitude UT aerosol cali-bration. Consequently, the systematic uncertainty of the average particle masses de-rived by using the CARIBIC OPC size distributions with one fixed average refractive index for all flight regions is in the order of ±10 %. Depending on the exact type of
aerosol present, the error for single measurements may be larger. However, for the
5
case of the Eyjafjallaj ¨okull volcanic ash particles, the refractive index is not the main source of uncertainty in deriving particle mass concentrations from the OPC measure-ments (see discussion below).
For the CARIBIC volcanic ash flights the OPC data were analysed using two diff er-ent aerosol types, namely volcanic ash and ammonium sulphate aerosol. OPC
mea-10
surements most likely obtained inside the ash plume were analysed using a refrac-tive index ofn=1.54–0.003i at the OPC wavelength of 830 nm and a particle density ofρ=2.65 g cm−3. This is within the range of values found by Schumann et al. (2011) during measurement flights with the DLR Falcon. Because most volcano flight mea-surements were obtained at altitudes lower than the normal CARIBIC cruise altitudes,
15
all data outside the ash plume were analysed using the ammonium sulphate calibration (n=1.52–1.41×10⁻⁷i,ρ=1.83 g cm−3). Furthermore, due to the different refractive
in-dices in combination with saturation of the OPC photodiode, the upper detection limit is particle material dependent. For the mid-latitude UT aerosol, the volcanic ash and the ammonium sulphate aerosol, the upper detection limits in terms of particle
diame-20
ter are 1.31 µm, 1.06 µm and 1.09 µm, respectively. All particle diameters measured by the OPC are derived from the amount of light scattered by the particle using Mie theory and assuming a spherical shape of the particles.
Even if the uppermost OPC size channel has a nominal upper diameter size limit of 1.06 µm for volcanic ash, larger ash particles are still counted in that size channel
25
ACPD
11, 16693–16744, 2011CARIBIC measurements of
Eyjafjallaj ¨okull plumes
A. Rauthe-Sch ¨och et al.
Title Page
Abstract Introduction
Conclusions References
Tables Figures
◭ ◮
◭ ◮
Back Close
Full Screen / Esc
Printer-friendly Version Interactive Discussion
Discussion
P
a
per
|
Dis
cussion
P
a
per
|
Discussion
P
a
per
|
Discussio
n
P
a
per
|
ash mass (Schumann et al., 2011; Stohl et al., 2011). To account for these large par-ticles the individual particle number size distributions were fitted in the diameter range 450 nm–1.0 µm (excluding the uppermost size channel) with an exponential function of the form 10c0+c1p, wherep is the particle size range in nanometres andc
0 andc1
are the fit parameters. To improve the fit, only size channels with a count rate larger
5
than 3×10⁻²particles cm−3 are included in the fit because of the counting statistics.
This fit is then used to extend the OPC size range with additional “virtual” size chan-nels until the number of particles is reached that the OPC has counted in its uppermost channel or the centre diameter of the virtual channel exceeds 10 µm. At a particle diam-eter of 5 µm the inlet efficiency has dropped to∼50 % and for particles larger than 10 µm
10
in diameter the inlet efficiency is zero, i.e. they are not collected by the inlet or are lost in the sampling lines to the OPC. In that case, the slopec1 of the extrapolated size distribution is increased iteratively until the sum of the particles in the virtual size chan-nels reaches the number of particles counted in the uppermost OPC channel. The particle mass is then calculated with the appropriate particle density for ammonium
15
sulphate (background aerosol) or volcanic ash (plume aerosol). As will be shown later, the unknown shape of the size distribution for particle diameters larger than 1.0 µm is the major source of uncertainty for the derived aerosol mass concentrations.
After implementing the sheath air technique, the maximum counting efficiency of the OPC unit increased from∼50 % (manufacturer value) to∼89 % (see Fig. 2b). The
rela-20
tively large error bars represent mainly the volume flow uncertainties, as the OPC vol-ume flow is obtained by subtracting two roughly equal mass flow controller readings. Like for the size calibration, all calibration points were transferred to mid-latitude UT aerosol. The 50 % lower detection limit is calculated to be 143 nm, 137 nm and 139 nm in diameter for mid-latitude UT aerosol, volcanic ash and ammonium sulphate,
respec-25
ACPD
11, 16693–16744, 2011CARIBIC measurements of
Eyjafjallaj ¨okull plumes
A. Rauthe-Sch ¨och et al.
Title Page
Abstract Introduction
Conclusions References
Tables Figures
◭ ◮
◭ ◮
Back Close
Full Screen / Esc
Printer-friendly Version Interactive Discussion
Discussion
P
a
per
|
Dis
cussion
P
a
per
|
Discussion
P
a
per
|
Discussio
n
P
a
per
|
2.2 Condensation particle counters and particle sampler
In addition to the OPC, the CARIBIC container equipment includes three condensa-tion particle counters (CPC, modified TSI model 7610) with lower threshold diameters (50 % counting efficiency) of 4 nm, 12 nm and 18 nm, respectively, at 200 hPa operating pressure (Hermann and Wiedensohler, 2001). The upper detection limit of all CPCs is
5
estimated to be about 2 µm in diameter.
Besides the four particle counting instruments, there is a particle sampler with 16 im-pactor chambers and an upstream cyclone separator covering the particle diameter
range from 80 nm to 2 µm (50 % counting efficiencies, Nguyen et al., 2006). The
sampler employs sampling substrates of polyimide film (0.2 µm thickness) which are
10
analysed post flight at the University of Lund (Sweden) for the elemental composition of the aerosol particles. Particle Elastic Scattering Analysis (PESA) is used for the elements H, C, N and O, and Particle Induced X-ray Emission (PIXE) for the heavier elements, including Si, S, K, Ca, Ti, Mn, Fe and Ni (Nguyen and Martinsson, 2007).
2.3 The new high resolution whole air sampling system
15
The new whole air sampling system comprises a unit with two stainless steel bel-lows pumps, two units with 14 glass sampling flasks (2.7 l) each and a large unit with 88 stainless steel sampling cylinders (1.0 l) (Schuck et al., 2011). The latter were in-corporated into the CARIBIC container in autumn 2009 and were flown for the first time during the CARIBIC volcano flights. Flasks and cylinders are filled to ∼4.5 bar
20
according to a pre-defined schedule with regular sampling intervals during the flight. While the actual time required for filling the sampling flasks or steel cylinders depends on the ambient pressure and lies in the range of 30 s–90 s, the sampling interval is chosen to achieve a regular sampling over the entire flight. For the volcano flights, which were shorter than the regular CARIBIC flights, this meant a spacing of 8 min for
25
ACPD
11, 16693–16744, 2011CARIBIC measurements of
Eyjafjallaj ¨okull plumes
A. Rauthe-Sch ¨och et al.
Title Page
Abstract Introduction
Conclusions References
Tables Figures
◭ ◮
◭ ◮
Back Close
Full Screen / Esc
Printer-friendly Version Interactive Discussion
Discussion
P
a
per
|
Dis
cussion
P
a
per
|
Discussion
P
a
per
|
Discussio
n
P
a
per
|
were analysed after each flight in the laboratory for the greenhouse gases carbon diox-ide (CO2), methane (CH4), nitrous oxide (N2O) and sulphur hexafluoride (SF6) with a
HP 6890 gas chromatograph equipped with a flame ionisation detector for CO2 and
CH4 and an electron capture detector for N2O and SF6 (see details in Schuck et al.,
2009). The precision of the greenhouse gas measurements are 0.08 %, 0.17 %, 0.15 %
5
and 1.5 % for CO2, CH4, N2O and SF6, respectively. A suite of non-methane
hydro-carbons (NMHCs) including ethane (C2H6), ethyne (C2H2), propane (C3H8), butanes
(C4H10), pentanes (C5H12) and benzene (C6H6) were measured using cryogenic pre-concentration and focusing of the NMHCs in combination with a second HP 6890 gas chromatograph equipped with a flame ionisation detector (see details in Baker et al.,
10
2010). This analysis gives a precision of better than 5 % and lower detection limits of 1 pptv–3 pptv.
2.4 Other instruments
The CARIBIC Multi-AXis Differential Optical Absorption Spectrometer (MAX-DOAS)
system is connected to the three DOAS telescopes in the CARIBIC inlet system via
15
three quartz fibre bundles. It observes the atmosphere under elevation angles of−82◦
(nadir), −10◦ and +10◦ relative to the horizon (for details see Dix et al., 2009; Heue
et al., 2010). The DOAS system has also been upgraded in autumn 2009. The three new CTF60 spectrometers (omt – optische messtechnik, Germany) cover the wave-length range of 290 nm to 430 nm with a spectral resolution of 0.5 nm (Heue et al.,
20
2010). During the CARIBIC volcano flights on 20 April and 16 May 2010, the nadir and the−10◦ DOAS channels gave a signal large enough for the derivation of SO2 slant
column densities. On 16 May, BrO and O4as proxy for the aerosol optical depth were
retrieved in addition (see details in Heue et al., 2011). During the last volcano flight on 19 May 2010, the MAX-DOAS system unfortunately failed.
25
ACPD
11, 16693–16744, 2011CARIBIC measurements of
Eyjafjallaj ¨okull plumes
A. Rauthe-Sch ¨och et al.
Title Page
Abstract Introduction
Conclusions References
Tables Figures
◭ ◮
◭ ◮
Back Close
Full Screen / Esc
Printer-friendly Version Interactive Discussion
Discussion
P
a
per
|
Dis
cussion
P
a
per
|
Discussion
P
a
per
|
Discussio
n
P
a
per
|
has an excellent linearity and a precision of 3.5 ppb when the signal is integrated over 1 second. In-flight calibrations are performed every 25 min using a calibration air mix-ture (see details in Scharffe et al., 2011).
For ozone (O3), two different instruments are used. The absolute O3 mixing ratio is
measured with a custom-made, light-weight and accurate dual-beam UV photometer
5
with a time resolution of 4 s. As light source a UV-LED at 255 nm (bandwidth∼6 nm) is
used. The total accuracy is∼2 % or 1 ppbv, whatever is higher. In addition, a very fast
and precise solid-state chemiluminescence detector measures O3with a measurement
frequency of 10 Hz equivalent to a horizontal resolution of 30 m–40 m at normal cruising
speeds (Zahn et al., 2011). The absolute O3measurements of the UV photometer are
10
used to calibrate the fast chemiluminescence data (Brenninkmeijer et al., 2007). The overall system control in the CARIBIC container is achieved through the CARIBIC master computer which communicates with all instruments via an internal bus system. It also records once per second the flight position, flight altitude, airspeed, outside air pressure, air temperature and wind speed received from the aircraft via its
15
ARINC-428 bus system.
The Royal Netherlands Meteorological Institute (KNMI) supports the CARIBIC project with trajectory calculations (up to 8-day backward and 2-day forward) and fur-ther meteorological data (including potential vorticity) from the European Centre for Medium Range Forecasts (ECMWF) for all flights (van Velthoven, 2011). The
trajec-20
tory model used is the KNMI TRAJKS model which applies the Petterssen integrating scheme using an integration step of 10 min (Scheele et al., 1996; Stohl et al., 2001). The meteorological input data is taken from the ECMWF with a vertical resolution of 90 levels (uppermost level at 0.01 hPa), 316 spherical harmonics for a horizontal resolution of less than 1◦ and a time step of 6 h between consecutive meteorological
25
ACPD
11, 16693–16744, 2011CARIBIC measurements of
Eyjafjallaj ¨okull plumes
A. Rauthe-Sch ¨och et al.
Title Page
Abstract Introduction
Conclusions References
Tables Figures
◭ ◮
◭ ◮
Back Close
Full Screen / Esc
Printer-friendly Version Interactive Discussion
Discussion
P
a
per
|
Dis
cussion
P
a
per
|
Discussion
P
a
per
|
Discussio
n
P
a
per
|
3 CARIBIC volcano flights
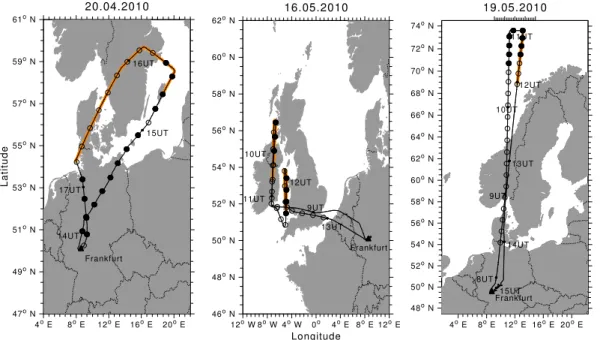
The explosive phase of the 2010 eruption of the Eyjafjallaj ¨okull volcano began on 14 April 2010 and lead to the subsequent partial closure of European airspace. As insufficient information was available, Lufthansa offered the CARIBIC consortium the possibility of conducting a volcano measurement flight on 20 April (takeoff13:47 UTC,
5
landing 17:33 UTC) from Frankfurt airport (Germany), the home base of the Lufthansa CARIBIC aircraft. Heading northeastward from Frankfurt the flight track crossed North-Eastern Germany and continued over the Baltic Sea and the island of Gotland before turning northwest and passing Stockholm. Crossing Southern Sweden and Denmark the CARIBIC aircraft returned via Northern Germany to Frankfurt (left panel of Fig. 1).
10
Between Frankfurt and Gotland island the aircraft descended and ascended repeat-edly thus measuring ten vertical profiles between 3700 m and 8000 m with the aim to increase the chance of intercepting the ash cloud (see flight profile in the upper panel of Fig. 3). Another descent down to 6000 m followed around 16:45 UTC over the German Bight. Throughout this paper, all flight altitudes mentioned are pressure altitudes with
15
respect to the International Standard Atmosphere (ISA, e.g. Airbus Customer Services, 2002) as reported by the aircraft via the ARINC-428 bus system.
As the volcanic eruption continued and the situation regarding air space closures remained unclear, a second CARIBIC flight from Frankfurt took place on 16 May 2010 (takeoff08:08 UTC, landing 13:49 UTC). For this day, several volcanic ash dispersion
20
models (see below) had predicted ash clouds over Northern Ireland and Scotland. Therefore the CARIBIC aircraft flew two south-north transects over Ireland and over the Irish Sea (middle panel of Fig. 1). Flying further north was not possible as the airspace was being closed just when the aircraft arrived there. The transfer flights to this region were carried out at cruise altitude around 12 km. During the south-north
25
ACPD
11, 16693–16744, 2011CARIBIC measurements of
Eyjafjallaj ¨okull plumes
A. Rauthe-Sch ¨och et al.
Title Page
Abstract Introduction
Conclusions References
Tables Figures
◭ ◮
◭ ◮
Back Close
Full Screen / Esc
Printer-friendly Version Interactive Discussion
Discussion
P
a
per
|
Dis
cussion
P
a
per
|
Discussion
P
a
per
|
Discussio
n
P
a
per
|
The right panel of Fig. 1 shows the flight route of the third and final CARIBIC volcano flight which left Frankfurt on 19 May 2010 (takeoff07:43 UTC, landing 15:38 UTC) and headed north over the Norwegian Sea to (75◦N, 10◦E) where the dispersion models had forecast volcanic ash clouds with areas exceeding 4 mg m−3 of ash which at that time was the limit for no-fly zones (European Commission, 2010). The transfer flights
5
were again carried out at a cruise altitude of around 12 km to save time and fuel. Once at destination, the altitude was stepwise reduced from 5200 m to 3700 m while flying east to 15◦E and from there turning south again. When leaving the area of forecast ash clouds, the aircraft climbed again to cruise altitude for the return flight (lower panel of Fig. 3). The stepwise descent at the end of this flight was due to a required holding
10
pattern before landing in Frankfurt.
During flight planning for the three CARIBIC volcano flights, ash dispersion forecasts from several sources were used. The Volcanic Ash Advisory Centre (VAAC) London issued official Volcanic Ash Advisories for three altitude regions (surface to flight level (FL) 200 (20 000 ft), FL200–350 and FL350–550) and three steps for the maximum
15
ash concentration of 200 µg m−3, 2 mg m−3 and 4 mg m−3, the latter defined as the absolute no-fly zone at that time by the civil aviation authorities (European Commis-sion, 2010). Additional ash dispersion predictions from the UK MetOffice (which also runs the VAAC forecast) with finer concentration steps were obtained from the Ger-man Weather Service (DWD). Also ash dispersion forecasts from the EURAD model
20
(University of Cologne) and the SILAM modelling framework (Finnish Meteorological Institute) were used. The Norwegian Institute for Air Research (NILU) offers a web in-terface for its FLEXPART dispersion model which produces plot with a vertical resolu-tion of one kilometre. These plots were used to determine the best flight altitude pattern for intercepting the ash clouds. In addition to dispersion models, freely available
satel-25
ACPD
11, 16693–16744, 2011CARIBIC measurements of
Eyjafjallaj ¨okull plumes
A. Rauthe-Sch ¨och et al.
Title Page
Abstract Introduction
Conclusions References
Tables Figures
◭ ◮
◭ ◮
Back Close
Full Screen / Esc
Printer-friendly Version Interactive Discussion
Discussion
P
a
per
|
Dis
cussion
P
a
per
|
Discussion
P
a
per
|
Discussio
n
P
a
per
|
The flight tracks in Fig. 1 and the flight altitude profiles in Fig. 3 also include the lo-cations and altitudes of the whole air glass flask samples. Open circles mark samples that were not influenced by the volcano and hence constitute background conditions. Solid circles show samples for which the backward trajectories analysed after each flight at KNMI had passed over Iceland at altitudes below 9 km, which was the
max-5
imum altitude the eruption reached during the relevant days according to Schumann et al. (2011, their Fig. 2). The parts of the flight tracks and flight profiles highlighted in orange mark the collection intervals of those aerosol particle samples for which the elemental composition clearly indicates a volcanic origin (see next section).
The transit times of the volcanic plumes, i.e. the age of the released volcanic ash,
10
were estimated from the KNMI backward trajectory analysis. The mean transport time from the Eyjafjallaj ¨okull volcano to the CARIBIC sampling location was 15 h–29 h for the flight on 20 April, 34 h–53 h for 16 May and 19 h–24 h for the flight on 19 May 2010. For each whole air sample 8-day backward trajectories were calculated starting at the sampling location. To assess the uncertainty of the calculated backward trajectories,
15
the starting point is shifted in latitude and longitude by±0.4◦and in pressure by±3 %.
If all of these 15 back trajectories stay close together, the trajectory is viewed to be well defined. In contrast, if the 15 back trajectories separate after a short time the origin of the sampled air has a large uncertainty which makes it difficult to determine whether it had been in contact with the Eyjafjallaj ¨okull eruption or not. Therefore a contact of the
20
sampled air with the Eyjafjallaj ¨okull eruption is assumed if at least 7/15 back trajectories pass within 200 km from the volcano at an altitude of 9 km or less. The results from the trajectory analysis confirm the results obtained from the CARIBIC measurements in separating air masses that are influenced by the Eyjafjallaj ¨okull volcano from those that are not even though the calculations did not take into account sedimentation of volcanic
25
ACPD
11, 16693–16744, 2011CARIBIC measurements of
Eyjafjallaj ¨okull plumes
A. Rauthe-Sch ¨och et al.
Title Page
Abstract Introduction
Conclusions References
Tables Figures
◭ ◮
◭ ◮
Back Close
Full Screen / Esc
Printer-friendly Version Interactive Discussion
Discussion
P
a
per
|
Dis
cussion
P
a
per
|
Discussion
P
a
per
|
Discussio
n
P
a
per
|
4 Results
The following sections present the results from the three CARIBIC volcano flights in April and May 2010. The aerosol impactor samples indicated volcanic origins of the probed air masses for all three measurement flights. However, for the first flight the signal was less clear than for the subsequent flights. Therefore the focus of this paper
5
will be on the two subsequent flights in May 2010. However, some useful results could also be derived from the flight on 20 April and are presented first.
4.1 20 April 2010: Baltic Sea
During this first CARIBIC volcano flight, the OPC found enhancements in particle mass concentrations over the Baltic Sea (not shown) that coincided with air masses that
10
the trajectory analysis traced back to the Eyjafjallaj ¨okull volcano (see filled dots in left panel of Fig. 1). Enhancements were found over North-Eastern Germany at an alti-tude of around 4 km, close to Gotland island at 3.5 km altialti-tude and over North-Western Germany around 7 km. The sub-micrometre ash particle mass concentrations within the sampled size range found in those air masses that were identified as being of
vol-15
canic origin were in the range of 2.1 µg m−3–70 µg m−3 (10 %–90 % percentiles) with
a median of 22 µg m−3. The highest value observed in the 180 s binning time was
240 µg m−3
at 14:26 UTC and 4.5 km altitude over North-Eastern Germany. For the non-volcanic aerosol measurements, the range was 0.8 µg m−3–22 µg m−3with a me-dian of 1.5 µg m−3. All particle number and mass concentrations in this study are given
20
for ambient pressure and temperature conditions.
For technical reasons, the aerosol sampler collected only one sample during the first volcano flight on 20 April 2010 (integration time 15:20–16:48 UTC; orange highlighted part of flight track in left panel of Fig. 1). This sample had an exceptionally high iron content of 2.4 % of the total particle mass. In fact, this is the highest iron fraction
25
ACPD
11, 16693–16744, 2011CARIBIC measurements of
Eyjafjallaj ¨okull plumes
A. Rauthe-Sch ¨och et al.
Title Page
Abstract Introduction
Conclusions References
Tables Figures
◭ ◮
◭ ◮
Back Close
Full Screen / Esc
Printer-friendly Version Interactive Discussion
Discussion
P
a
per
|
Dis
cussion
P
a
per
|
Discussion
P
a
per
|
Discussio
n
P
a
per
|
most of which contained less than 0.5 % of silicon. The low mass ratios of silicon (Si), potassium (K) and calcium (Ca) to iron (Fe) of 1.0, 0.2 and 0.2, respectively, confirm the high iron content of the sampled aerosol particles during this flight.
The whole air samples during the 20 April 2010 flight did not show any peculiari-ties that would point to a volcanic origin of the sampled air. The MAX-DOAS system
5
measured a small enhancement of SO2 close to Gotland island around 15:15 UTC.
Unfortunately, the DOAS signal during this flight was very low and the enhancement did not rise substantially over the signal noise. The DOAS BrO signal did not show any increase. Also the in situ trace gas samplers did not show any peculiarities.
4.2 16 May 2010: Ireland and Irish Sea
10
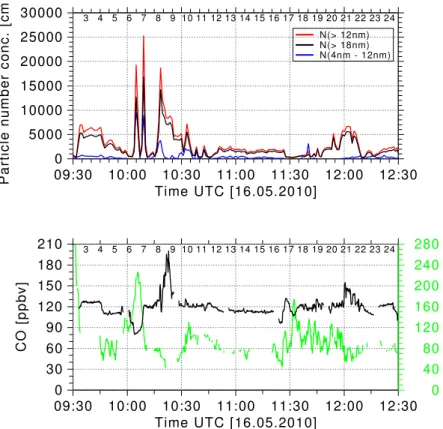
The CPC particle number concentrations at ambient pressure and temperature dur-ing the second CARIBIC volcano flight on 16 May are shown in the upper panel of Fig. 4. They show an increase in the number of particles with diameters larger than 12 nm (red line) and larger than 18 nm (black line) from∼1.5×10³particles cm−3
up to 1.8×10⁴particles cm−3during 10:17–10:40 UTC when the aircraft turned around
15
north of Ireland and descended into the volcanic plume (see middle panels of Figs. 1 and 3). Unfortunately, the brand-new OPC, employed in airborne measurements for the first time during the CARIBIC volcano flights, did not work during this second flight. Therefore no continuous particle mass concentrations are available for this flight.
The aerosol impactor sampler was set to an integration time of 50 min during this
20
flight and elemental analyses gave clear indications of volcanic ash for samples no. 4 (sampling interval 09:59–10:49 UTC) and no. 6 (sampling interval 11:38–12:27 UTC, see orange highlighted parts of the flight track in middle panel of Fig. 1). Both samples showed high silicon and iron fractions of 10.0 % Si and 1.3 % Fe for sample no. 4 and 9.1 % Si and 2.1 % Fe for sample no. 6, which is much higher than the fractions
25
ACPD
11, 16693–16744, 2011CARIBIC measurements of
Eyjafjallaj ¨okull plumes
A. Rauthe-Sch ¨och et al.
Title Page
Abstract Introduction
Conclusions References
Tables Figures
◭ ◮
◭ ◮
Back Close
Full Screen / Esc
Printer-friendly Version Interactive Discussion
Discussion
P
a
per
|
Dis
cussion
P
a
per
|
Discussion
P
a
per
|
Discussio
n
P
a
per
|
K/Fe and Ca/Fe were 5.2 & 4.4, 0.42 & 0.44 and 0.59 & 0.56, respectively.
The MAX-DOAS system measured strong enhancements of SO2 (up to 49 ppb)
and BrO (up to 6 ppt) during those parts of the flight on 16 May where the air was of volcanic origin (see filled dots in Fig. 1). While the CARIBIC aircraft flew north over the Irish Sea it encountered once again air of volcanic origin (11:55–12:10 UTC)
5
with an increase in SO2 but not in BrO. Also the CPCs detected again increased
particle number concentrations, e.g. of the particles with diameters larger than 12 nm with 7×10³particles cm−3. A detailed discussion of the MAX-DOAS measurements
during this flight has been published in a companion article in this special issue by Heue et al. (2011).
10
The CO measurements during this flight are shown in the lower panel in Fig. 4 (black line). The background CO concentration outside the volcanic air is 120 ppbv, a usual background value for this region in May. When the aircraft descended into the vol-canic plume around 10:17 UTC, the CO concentration rose to 200 ppbv but shortly after returned to the background value although the aircraft was still inside the volcanic
15
plume according to the CPC measurements and the backward trajectories. A smaller increase to 155 ppbv was detected at 12:00 UTC when the aircraft measured the sec-ond volcanic plume over the Irish Sea. The measured ozone concentrations (green line in lower panel of Fig. 4) did not show a significant change of the ozone inside the volcanic plumes.
20
The whole air samples, analysed for a suite of non-methane hydrocarbons, showed a clear decrease of ethane, ethyne, propane, butanes and pentanes in those air sam-ples that were affected by volcanic emissions (samples no. 8–10 and no. 18–21, see filled symbols and numbers close to upper margin in Fig. 5) compared to background air samples (see open symbols and dashed lines indicating the mean background
con-25
ACPD
11, 16693–16744, 2011CARIBIC measurements of
Eyjafjallaj ¨okull plumes
A. Rauthe-Sch ¨och et al.
Title Page
Abstract Introduction
Conclusions References
Tables Figures
◭ ◮
◭ ◮
Back Close
Full Screen / Esc
Printer-friendly Version Interactive Discussion
Discussion
P
a
per
|
Dis
cussion
P
a
per
|
Discussion
P
a
per
|
Discussio
n
P
a
per
|
analysis in Baker et al., 2011). Using transport times from the backward trajectories, the estimated mean chlorine radical concentration during the transport to the British Isles was 1.3–6.4×10⁴Cl cm−3with a mean of 3.0×10⁴Cl cm−3.
4.3 19 May 2010: Norwegian Sea
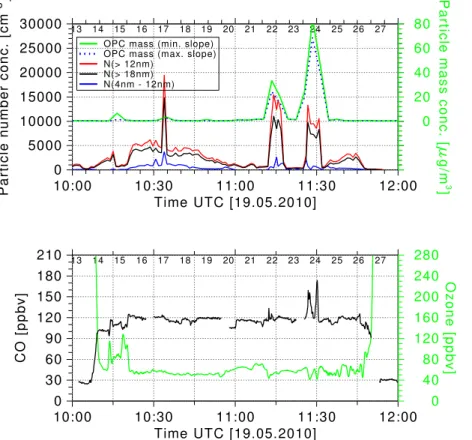
During the final CARIBIC volcano flight on 19 May 2010, the aircraft sampled between
5
10:15 UTC and 11:45 UTC in a region with predicted volcanic ash in the middle tro-posphere over the Norwegian Sea. Like during the previous flights, the aircraft ap-proached and left this region flying at cruise altitude (see lower panel of Fig. 3). The OPC worked well during this flight and the inferred particle mass concentrations are shown in the upper panel of Fig. 6 (solid green and dotted blue lines, right scale). The
10
solid and dotted line differ in the assumed slope for the extrapolation of the size distri-bution for particles larger than 1.0 µm in diameter (see also description of OPC analysis in Sect. 2.1). The OPC derived particle mass and diameter size distribution are used to distinguish background air from the volcanic plume. The aerosol background is de-termined from the measurements during 10:37–10:59 UTC, i.e. before the double peak
15
in the derived particle mass concentration. The fitted slopes for the extrapolation of the size distribution during that time span the range−1.91 to+0.17 (see Sect. 2.1). During
the volcanic ash encounter at 11:01–11:38 UTC, the maximum fitted slope is+1.36.
A constant extension of the size distribution (slope=0.0) is assumed as the minimum slope based on the individual 180 s particle number size distributions.
20
The green solid line in Fig. 6 shows the calculated mass concentration for the mini-mum slope while the blue dotted line is calculated using the maximini-mum slope for back-ground aerosols and volcanic ash. A smaller slope in the extrapolation extends the size distribution to larger particle diameters before the number of particles counted is reached. Therefore the derived particle mass is higher for the smaller slope (green
25
solid line) than for the larger slope (blue dotted line) of the extrapolation. There are two peaks in the OPC mass concentrations: a maxima of 33 µg m−3(for minimum slope) or
ACPD
11, 16693–16744, 2011CARIBIC measurements of
Eyjafjallaj ¨okull plumes
A. Rauthe-Sch ¨och et al.
Title Page
Abstract Introduction
Conclusions References
Tables Figures
◭ ◮
◭ ◮
Back Close
Full Screen / Esc
Printer-friendly Version Interactive Discussion
Discussion
P
a
per
|
Dis
cussion
P
a
per
|
Discussion
P
a
per
|
Discussio
n
P
a
per
|
slope) at 11:28 UTC (again all values given are for ambient pressure and tempera-ture). A third much smaller increase was measured at 10:34 UTC with a mass con-centration of 3.6 µg m−3(2.7 µg m−3for maximum slope) coinciding with a narrow peak in the CPC particle number concentrations. The mean aerosol background is
deter-mined from the measurements during 10:37–10:59 UTC and found to be 0.61 µg m−3
5
(0.46 µg m−3for maximum slope). The average particle mass concentration during the ash encounter at 11:01–11:38 UTC is 16.7 µg m−3(13.5 µg m−3for maximum slope).
The CPCs detected maxima in the number concentration of particles with diameters larger than 12 nm (N12) and 18 nm of up to 1.6×10
4
particles cm−3(Fig. 6, red and black solid lines, left scale). For nucleation mode particles (blue line) there is a maximum
10
around 11:15 UTC coinciding with the first peak in the OPC particle mass and the other CPC particle ranges, while for the second particle mass maximum the peak for the nucleation mode particles occurs at the beginning when the concentrations in the other two CPC particle size ranges are just starting to increase.
The measured particle mass size distributions averaged over the background and the
15
volcanic ash periods of the flight on 19 May 2010 are shown in the upper panel of Fig. 7. The blue bars represent the mean background size distribution while the red bars show the mean size distribution for the volcanic ash. Error bars indicate the 1-σ variability during the two averaging periods. Inside the volcanic ash cloud, all size channels have higher particle masses than in the background air. But the most pronounced difference
20
is found for particle diameters larger than 450 nm where the mass per size channel increases strongly with particle size for the volcanic ash while it stays more or less constant for the background aerosol. The solid bars for the uppermost size interval are calculated using the smallest slope for the extrapolation of the size distribution. The dotted bars are calculated using the largest slope as described above.
25
ACPD
11, 16693–16744, 2011CARIBIC measurements of
Eyjafjallaj ¨okull plumes
A. Rauthe-Sch ¨och et al.
Title Page
Abstract Introduction
Conclusions References
Tables Figures
◭ ◮
◭ ◮
Back Close
Full Screen / Esc
Printer-friendly Version Interactive Discussion
Discussion
P
a
per
|
Dis
cussion
P
a
per
|
Discussion
P
a
per
|
Discussio
n
P
a
per
|
background air. Another sample collected earlier from 10:22–11:12 UTC is a mixture of background aerosols and volcanic ash which contained less silicon and less iron (e.g. K/Fe ratio 1.4 vs. 0.5 for later sample).
The continuous measurements of CO (black line, left scale) and O3(green line, right scale) are shown in the lower panel of Fig. 6. During the flight section of interest
5
between 10:15 UTC and 11:45 UTC, the CO concentration stays fairly constant at around 120 ppbv while the O3 concentration is ∼60 ppbv (a typical value for the
mid-troposphere in May at 75◦N, Fortuin and Kelder, 1998). After 11:45 UTC the aircraft climbed to cruise altitude and entered the lower stratosphere (according to ECMWF potential vorticity). This explains the high O3and low CO values at this time. During the
10
first aerosol peak around 11:13 UT, there is only a very short and small increase in CO and a small decrease in O3. However during the second aerosol peak around 11:28 UT,
there are clearly two strong CO peaks of up to 179 ppbv (an increase of 60 ppbv or 50 % over the background).
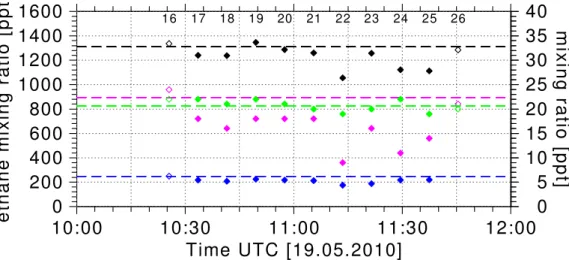
The non-methane hydrocarbons for the 19 May 2010 flight showed similar systematic
15
decreases as during the second volcano flight on 16 May and the volcanic signature was even more clear. The chlorine radical concentration estimated from whole air samples no. 17–25 (see filled symbols and numbers close to upper margin in Fig. 8) is 2.0–5.7×10⁴Cl cm−3 (see detailed discussion in Baker et al., 2011). The new
im-proved MAX-DOAS system was not working during this flight so there is no information
20
about the SO2or BrO concentration available.
5 Comparison to the FLEXPART dispersion model
FLEXPART is a widely used Lagrangian dispersion model in ongoing development at the Norwegian Institute for Air Research (NILU) that obtains its meteorological input data from the European Centre for Medium-Range Weather Forecasts (ECMWF). It
25
ACPD
11, 16693–16744, 2011CARIBIC measurements of
Eyjafjallaj ¨okull plumes
A. Rauthe-Sch ¨och et al.
Title Page
Abstract Introduction
Conclusions References
Tables Figures
◭ ◮
◭ ◮
Back Close
Full Screen / Esc
Printer-friendly Version Interactive Discussion
Discussion
P
a
per
|
Dis
cussion
P
a
per
|
Discussion
P
a
per
|
Discussio
n
P
a
per
|
ash tracer subject to dry deposition, wet deposition and gravitational settling but ig-noring ash aggregation processes. This model run uses the ash source information and initial size distribution determined via inverse modelling by Stohl et al. (2011). The inverse modelling merged a priori information on the ash emission strength, sensitiv-ity calculations with FLEXPART and satellite retrievals of total atmospheric columns
5
of volcanic ash to obtain optimised time- and height-resolved volcanic ash emissions. Emissions and thus modelled ash dispersion patterns are well constrained by the satel-lite observations for strong ash plumes. The satelsatel-lite measurement constraint is less good for ash plumes with lower ash loadings or for defining the plume edges because of the limited sensitivity of the satellite retrievals. Thus, the model performance for the
10
relatively weak plumes sampled by the CARIBIC aircraft may be not as good as for stronger plumes.
In the model run used for the comparison to the CARIBIC measurements 24 million volcanic ash particles were released in 22 size classes between 250 nm and 250 µm to obtain vertically resolved ash concentrations (Stohl et al., 2011). The gravitational
15
settling of the particles was calculated using an ash particle density of 3.0 g cm−3. For a consistent comparison to the OPC mass concentrations, all FLEXPART ash concen-trations shown here have been scaled to an ash particle density of 2.65 g cm−3as used in the OPC analysis, i.e. the particle mass was decreased by 12 %. The FLEXPART model output has a spatial resolution of 0.25×0.25◦. The vertical resolution is 250 m
20
from the ground up to 7 km altitude, 500 m up to 10 km altitude, 1000 m up to 13 km plus an additional stratospheric layer at 20 km. The ECMWF meteorological input data is available every three hours at a spatial resolution of 0.18×0.18◦ and 91 model
lev-els (further details on the model simulations are available in Stohl et al. (2011)). For comparison of FLEXPART predictions and CARIBIC aerosol measurements, vertical
25
ACPD
11, 16693–16744, 2011CARIBIC measurements of
Eyjafjallaj ¨okull plumes
A. Rauthe-Sch ¨och et al.
Title Page
Abstract Introduction
Conclusions References
Tables Figures
◭ ◮
◭ ◮
Back Close
Full Screen / Esc
Printer-friendly Version Interactive Discussion
Discussion
P
a
per
|
Dis
cussion
P
a
per
|
Discussion
P
a
per
|
Discussio
n
P
a
per
|
The FLEXPART model results for the CARIBIC flight on 16 May 2010 are shown in the lower panel of Fig. 9. The total ash particle mass in all size classes is colour-coded in µg m−3at ambient pressure and temperature. The CARIBIC flight altitude is indicated by the magenta line. Qualitatively the simulated volcanic aerosol concentration fits well to the CPC measurements on 16 May (upper panel of Fig. 9) with a strong peak around
5
10:20 UTC and a second smaller maximum around 12:00 UTC. Since the OPC had not been working during this flight, the mass concentrations cannot be compared.
Notice that the two ash encounters simulated by FLEXPART for the CARIBIC flight on 16 May 2010 occurred in close proximity to each other and resulted from sampling the model output of a single simulated plume, seen also by the mirrored appearance
10
of the plume in Fig. 9. This is the result of the aircraft turning north of Ireland around 10:15 UTC and flying back almost along the same route but at a lower altitude and shifted ∼14 km to the east (see Figs. 1 and 3). The fact that the measurements
ob-served volcanic ash only on the return leg shows that the aircraft sampled the western edge of the plume, which was displaced slightly further to the west by FLEXPART.
15
The same kind of plot is shown in the lower panel of Fig. 10 for the third CARIBIC vol-cano flight on 19 May 2010. The large modelled ash concentration at 10:30–10:46 UTC was not measured with the CARIBIC OPC (green line in upper panel of Fig. 10). Considering the vertical distribution, it seems that the CARIBIC aircraft missed this plume because it flew just above it or around it. The simulated second ash encounter
20
at 11:10–11:35 UTC fits in time to the volcanic ash observed with the CARIBIC OPC. The lower panel in Fig. 7 shows the simulated ash particle size distributions for the first (orange bars) and second (red bars) volcanic ash encounter on 19 May 2010. The error bars indicate the 1-σ variability during the ash encounters. The size distribu-tions qualitatively agree with the measured OPC volcanic aerosol size distribution (red
25
ACPD
11, 16693–16744, 2011CARIBIC measurements of
Eyjafjallaj ¨okull plumes
A. Rauthe-Sch ¨och et al.
Title Page
Abstract Introduction
Conclusions References
Tables Figures
◭ ◮
◭ ◮
Back Close
Full Screen / Esc
Printer-friendly Version Interactive Discussion
Discussion
P
a
per
|
Dis
cussion
P
a
per
|
Discussion
P
a
per
|
Discussio
n
P
a
per
|
with diameters above 12 µm (first ash encounter) and 14 µm (second ash encounter), the mass size distributions decrease by nearly two orders of magnitude. These very large particles were present in ash emitted by Eyjafjallaj ¨okull but were removed from the ash plume during the transport (Stohl et al., 2011).
A direct comparison of simulated and measured particle mass concentrations on
5
19 May is shown in Fig. 11 for the flight section 10:00–12:00 UTC. The black solid line shows the total volcanic aerosol concentration in all size classes from the FLEXPART simulations. The red solid line is restricted to the seven FLEXPART size classes be-tween 250 nm and 4.5 µm that overlap with the maximum size range of the OPC. The black and red dashed lines are the FLEXPART results for the altitude bin below the
10
CARIBIC flight altitude. The total aerosol concentration derived from the OPC mea-surements using the smallest slope for the size distribution extrapolation is given by the green solid line. The blue dotted line is calculated using the largest slope (see also discussion in Sect. 4.3). Comparing OPC measurement and FLEXPART simula-tion, the timing of the ash plumes seems to agree slightly better for the bin below the
15
CARIBIC flight altitude (dashed red line) while the ash mass concentration agrees best in the actual altitude bin of the model (solid red line).
The FLEXPART simulation predicts a first ash encounter during 10:35–10:45 UTC with a maximum ash concentration of 379 µg m−3 (287 µg m−3 for particles smaller than 5 µm in diameter). At that time, the OPC only measured a very small increase
20
in the uppermost channel as indicated by the green dashed line at 10:35 UTC. This probably indicates an ash cloud that is very variable with patches of higher con-centrations and patches of ash-free air. A slight error of the modelled plume
posi-tion and plume edges could explain that the difference between measurement and
FLEXPART model results. Later both OPC and FLEXPART simulations indicate
vol-25
canic ash with maxima around 11:13 UTC and 11:28 UTC. While the timing is very similar in OPC measurement and FLEXPART simulation for these maxima, the ash mass concentrations are somewhat different but agree within their uncertainties. The
ACPD
11, 16693–16744, 2011CARIBIC measurements of
Eyjafjallaj ¨okull plumes
A. Rauthe-Sch ¨och et al.
Title Page
Abstract Introduction
Conclusions References
Tables Figures
◭ ◮
◭ ◮
Back Close
Full Screen / Esc
Printer-friendly Version Interactive Discussion
Discussion
P
a
per
|
Dis
cussion
P
a
per
|
Discussion
P
a
per
|
Discussio
n
P
a
per
|
than 5 µm). The corresponding numbers for the OPC particle mass are 84 µg m−3
(69 µg m−3 for maximum slope). Using the altitude bin below the CARIBIC flight alti-tude (black and red dashed lines) improves the temporal agreement but worsens the quantitative agreement. Considering the uncertainties of the OPC mass concentra-tions and the FLEXPART simulaconcentra-tions, this is a good agreement of FLEXPART model
5
and OPC measurements.
6 Discussion
The three Eyjafjallaj ¨okull volcanic flights were the first flights with the brand-new OPC system described in this article and the first flights with the new improved DOAS spectrometers (see Heue et al., 2011). Most equipment functioned well, but because
10
of the upgrade and extension of the CARIBIC container with new or improved instru-ments, there were gaps in the observations. Nevertheless, the CARIBIC results shown here add significantly to the modest amount of measurements that could be collected during the Eyjafjallaj ¨okull eruption in 2010. The CARIBIC aircraft collected a compre-hensive suite of measurements in volcanic plumes of variable age during the three
15
flights.
6.1 Volcanic aerosol composition and concentrations
On 20 April 2010 the volcanic ash cloud had descended from its initial altitude of∼7 km
to around 3 km or below over Europe (Ansmann et al., 2010; Flentje et al., 2010). At these low altitudes the ash blended into the planetary boundary layer in which it is
20
difficult to distinguish the normal boundary layer aerosol from volcanic ash particles. During the subsequent flights in May 2010, the volcanic plumes were found in the free troposphere well separated from the planetary boundary layer.
The particle impactor sampler collected a total of 13 samples during the three
CARIBIC volcano flights. Four of the samples were found to have an elemental
25
ACPD
11, 16693–16744, 2011CARIBIC measurements of
Eyjafjallaj ¨okull plumes
A. Rauthe-Sch ¨och et al.
Title Page
Abstract Introduction
Conclusions References
Tables Figures
◭ ◮
◭ ◮
Back Close
Full Screen / Esc
Printer-friendly Version Interactive Discussion
Discussion
P
a
per
|
Dis
cussion
P
a
per
|
Discussion
P
a
per
|
Discussio
n
P
a
per
|
the surface in Iceland (see Supplement of Sigmundsson et al., 2010) and to precipita-tion samples collected on Hohenpeißenberg in southern Germany (Flentje et al., 2010). Of those four samples the highest iron fraction was found in the sample collected on 20 April 2010 over the Baltic Sea. Silicon was enhanced in that sample as well but not as much as in the volcanic samples from the later two flights which showed silicon
5
fractions of up to 10.0 %. Together with the OPC observations (not shown) that indi-cated enhanced particle concentrations only during the first part of the particle sampler integration time for that sample, this is a hint that the sample from 20 April represents a mixture of volcanic and non-volcanic air. The aerosol elemental composition of the samples collected on 19 May 2010 over the Norwegian Sea is very similar to that found
10
three days earlier over Northern Ireland and the Irish Sea but with a little more iron and less calcium.
Ash samples collected on the ground in the vicinity of the volcano (see details in the supplement to Sigmundsson et al. (2010)) have a similarly high Si/Fe ratio of 3.5 as was found in the CARIBIC volcanic particle samples but have even higher relative
15
amounts of Si, Ca and Fe with 26.5 %, 4.15 % and 7.7 %, respectively. The elemental composition of the aerosol samples together with the back trajectories clearly showed that the measured particles had their origin at the Eyjafjallaj ¨okull volcano on Iceland.
The decision to open or close airspace is based on measurements of the total ash mass concentration with a threshold of 4 mg m−3 below which safe aircraft operation 20
is deemed possible (European Commission, 2010). The Eyjafjallaj ¨okull eruption pro-duced massive amounts of small ash particles, around half of them being smaller than 100 µm in diameter during the first days of the eruption and less later on when all the ice had melted (Sanderson, 2010). However, particles of 20 µm diameter have a sedimentation velocity of∼130 m h−1or 3.1 km day−1(Ginoux, 2003; Schumann et al.,
25