A Review on the Dynamics of Water
Milton T. Sonoda, Ney H. Moreira, Leandro Mart´ınez, Frank W. Favero,
S´ergio M. Vechi, Lucimara R. Martins, and Munir S. Skaf
Instituto de Qu´ımica, Universidade Estadual de Campinas, Cx. P. 6154, Campinas, SP, 13084-971, Brazil
Received on 17 October, 2003.
We present a review on the intermolecular dynamics of liquid aqueous systems focusing mainly on Molecu-lar Dynamics simulation work that has been carried out at the State University of Campinas in recent years. Emphasis is given on simulation results that are more directly related to modern experimental spectroscopic measurements.
1
Introduction
Water is by far the most important, most ubiquitous, most studied, and yet one of the least understood liquids on Earth. The strength and high directionality (anisotropy) of the in-termolecular interactions in water lead to highly peculiar thermodynamic and structural properties [1-4]. The na-ture of the intermolecular interactions allied to water’s low molecular weight and small moments of inertia, allow for a complex pattern of intermolecular force fluctuations in both length and time scales, promoting a dynamical behavior that is unique to water[3, 4]. At the heart of water’s intrigu-ing behavior lies the network of hydrogen (H) bondintrigu-ing. In addition, manifestations of inherently quantum mechanical effects on water’s macroscopic behavior brings in an addi-tional degree of challenge, and fascination, to this field of research[5].
The intermolecular dynamics of liquid water has long been subject of intense experimental and theoretical re-search. Numerous experimental studies have been re-ported on the dynamics of this liquid using a variety of different techniques, including microwave dielectric relaxation[6], far-infrared[7], Raman[8] and light scatter-ing spectroscopies[9], NMR[10], and small angle neutron scaterring[11] in the last two or three decades. More recently, new experimental developments based on ultra-fast laser techniques have made it possible to investi-gate intermolecular dynamical processes of water at much shorter timescales with substantially higher level of detail. Among these, terahertz spectroscopy[12] and nonlinear op-tical methods such as Raman echo[13] and opop-tical Kerr ef-fect (OKE)[14] spectroscopies stand out for providing re-markably valuable information directly in the time domain.
Parallel to these developments, advances in molecular dynamics (MD) computer simulations have markedly en-riched our views on the dynamics of water, both at ambient and extreme conditions of temperature and pressure[3, 4]. A variety of MD simulation studies have been performed on liquid water aiming to understand different aspects of its dynamics by means of interaction potentials of distinct
com-plexity. In particular, detailed simulation analyses have been reported for the dielectric relaxation, depolarized Raman or light scattering, time resolved fluorescence spectroscopy[3], and nonlinear optical Kerr response for bulk phases[15], as well as second harmonic generation and vibrational sum frequency[16] signals for studying interfacial systems more specifically. In this work, we present a nonpretentious re-view on the dynamics of liquid water and other aqueous sys-tems that focuses especially on our own recent work with an emphasis on simulations of physical observables of spectro-scopic relevance. Some of the results presented here have not heretofore been published. We shall not discuss any as-pects related to techniques of MD simulation and will not review the numerous Hamiltonian models available for wa-ter nor the description they provide for the physicochemical properties of the fluid. The purpose here is to provide an overall physical picture for the underlying water dynamics within different contexts, as obtained from MD simulations. The paper evolves from a tutorial review on the funda-mental characteristics of the dynamics of liquid water de-scribed in terms of single-particle motions to an abriged presentation of MD studies of distinct spectroscopic prop-erties of selected aqueous systems including: i) Dielec-tric relaxation and far-infrared spectroscopies of water, water-methanol and water-dimethylsulfoxide (DMSO) bi-nary mixtures, and supercritical water; ii) Ultrafast time-resolved spectroscopy of coumarin dyes in water and water-DMSO mixtures, and of excess hydrated electrons; iii) Non-linear optical spectroscopy of water; iv) Vibrational dephas-ing of the squarate anion in water; and v) Water near inter-faces. The paper concludes with a brief description of the role of water in the dissociation of the retinoic acid from its nuclear hormone receptor.
2
Single-particle dynamics
translational motions of individual atoms or the molecule as a whole, as well as the molecular rotational motions is most commonly described in terms of the time correlation functions (TCF),CO(t) =hO(t)· O(0)i/|O(0)|2®, with
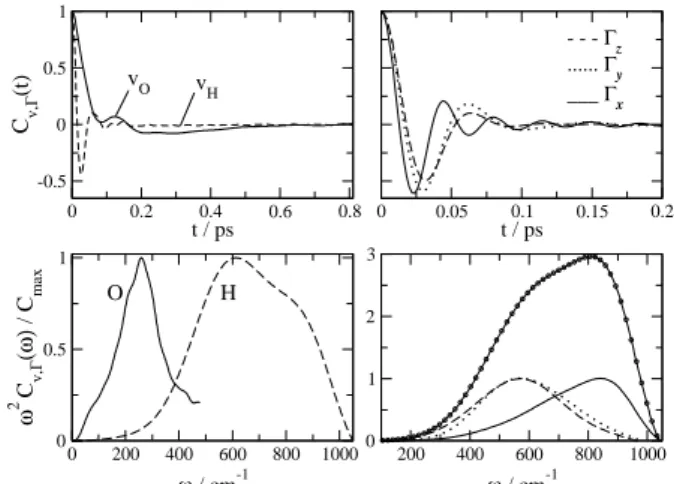
the dynamical variable O(t)being the linear velocities of individual atoms (vO, vH) or the molecular angular velocity components (Γx,y,z). Linear and angular velocity TCFs ob-tained from MD simulations using the SPC/E model[18] are depicted in Fig.1 (upper panels) along with their frequency spectra obtained from the cosine Fourier transforms (lower panels). The dynamics we see here refer to intermolecu-lar motions only. Intramolecuintermolecu-lar vibrational motions are not portraied in Fig.1 because the SPC/E model lacks internal degrees of freedom. Notice how the TCFs rapidly converge to vanishing amplitudes within 100 – 500 fs. This gives an idea of how fast are the collision rates in liquid water. The short-time dynamics of the O and H atoms are suggestive of damped oscillatory motions and result from the interactions (“collisions”) with neighboring molecules. These features resemble somewhat the dynamics of solids. The transla-tional velocity TCF of the O atoms exhibits a negative por-tion due to the back scattering mopor-tions of the molecule in-side the H-bonded cage of neighbors. The dynamics of the H atoms in this time scale is much faster because of their small masses. Translational motions of H atoms is highly correlated to rotations of the molecule as a whole around the center of mass and this is why theCvH(t)andCΓ(t)
func-tions are similar. TheCΓ(t)TCFs indicate very clearly the
existence of small amplitude, hindered or damped rotational oscillations known as librations. The librational period lies between 20 and 40 fs. These fast rotational oscillations ap-pear so prominently in water because of the small moments of inertia and the existence of high molecular torques due to H-bonding restoring forces[3, 17]. The differences observed between the angular velocity components correlate with the magnitude of the moments of inertia, Ixx = 1.0×10−47 kg/m2
(parallel to the HH vector),Iyy = 1.9×10−47kg/m2 (main symmetry axis), andIzz = 2.9×10−47kg/m
2
(nor-mal to plane): S(nor-maller moment means faster rotation about the corresponding principal axis.
The characteristic frequencies associated with these mo-tions are reflected in the Fourier spectra. The hindered trans-lational motions of the molecule (O atom) inside the cage of neighbors have a main frequency component around 250 cm−1. A small shoulder can be seen around 60 cm−1. The
spectral characteristics of the librations consist of a broad band between 400 and 1000 cm−1, which is composed by the librations around the y and z axes peaked at ∼ 600 cm−1and around the xaxis, peaked near 850 cm−1. The large width of the librational band reveals the structural in-homogeneity of the H-bond network and the importance of
thermal fluctuations at ambient conditions. These molecular motions can be directly or indirectly captured by a variety of spectroscopic measurements.
0 0.2 0.4 0.6 0.8
t / ps
-0.5 0 0.5 1
Cv,
Γ
(t)
0 0.05 0.1 0.15 0.2
t / ps
0 200 400 600 800 1000
ω / cm-1
0 0.5 1
ω
2 C
v,
Γ
(
ω)
/ C
max
200 400 600 800 1000
ω / cm-1
0 1 2 3
vO vH ___ Γ
x
- - - Γz ... Γy
O H
Figure 1. Normalized time correlation functions for the linear and angular velocities of water obtained from MD simulations using the SPC/E model and the corresponding frequency spectra. a) TCFs for the velocities of the oxygen and hydrogen atoms; b) TCFs for angular velocities; c) Frequency spectra for the atom velocity TCFs; Frquency spectra for the angular velocity TCFs (the line with symbols is the sum of the individual spectra).
3
Dielectric Response
Dielectric relaxation techniques are among the oldest and most popular methods to extract information about the sys-tem’s dynamics over a wide range of frequency values. The keen interest in the dielectric behavior of polar liquids is largely due to the fact that these properties are essential to characterize the liquid as a reactional medium for chemi-cal processes involving ionic or polar species[19]. Dielec-tric properties such as dielecDielec-tric constants, dielecDielec-tric relax-ation times, frequency dependent far infrared (FIR) absorp-tion coefficients, and longitudinal dielectric relaxaabsorp-tion times are key ingredients to the description of a variety of physic-ochemical phenomena, specially solvation dynamics and charge transfer reactions[20]. In very simple physical terms, the dielectric response relies on the absorption of radiation by matter that occurs when the frequency of the incident ra-diation matches the dynamical fluctuations of the sample’s total dipole moment. Within a linear response framework, the frequency dependent complex dielectric permittivity is related to the Fourier transform of the system’s collective dipole moment TCF:
⌋
ǫ(ω)−ǫ∞= 1 3V kBT ǫ0
·
h|M(0)|2i+i ω
Z ∞
0
dthM(t)·M(0)ieiωt
¸
Such time correlation functions can be computed from lengthy molecular trajectories generated from an MD simu-lation and then Fourier transformed to yieldǫ(ω). One of the earliest and most complete set of MD simulations aimed at the dielectric response of water is reported by Neumann[21] using the TIP4P water model[22]. The real and imaginary parts ofǫ(ω)as function of frequency up to2×1014
Hz (∼
1000 cm−1) are depicted in Fig.2 by the upper and lower
curves. Solid and dotted lines correspond, respectively, to simulation and experimental results, obtained from differ-ent spectroscopic measuremdiffer-ents[6, 7]. Starting from upper frequencies, one notices in Imǫ(ω) sharp absorption fea-tures due to the internal molecular vibrations, followed by a broader band around 1014 Hz which is due to the inter-molecular librational motions. Next to it, atω ∼3×10¹³
Hz (150-200 cm−1) there is another resonance which it not captured by the TIP4P simulations. At much lower frequen-cies, a broad absorption band appears in the microwave re-gion resulting from the rotational-diffusion reorientational motions of the water molecules with a typical dielectric re-laxation or Debye time around 10 ps. This dynamics is well described by the simulations, although not apparent in the results shown in Fig.1 because these TCFs wane long before the onset of slow molecular reorientational processes. Over-all, the simulations describe very well the dielectric spec-trum of water. The internal vibrations are easily reproduced using a flexible model for water. The absorption at 150-200 cm−1 was later shown to stem from hindered translational vibrations of the molecule in the cage formed by its neigh-bors, just as portraied by the dynamics of the O atoms shown in Fig.1. Indeed, purely translational motions in a system of nonpolarizable molecules such as TIP4P water have only an indirect influence on the fluctuations of the total dipole
M(t). When polarizability is taken into account, the
trans-lational resonance is well reproduced[23].
Figure 2. Real and imaginary parts of the frequency dependent di-electric permittivity of water obtained from MD simulations on the TIP4P model (solid lines; Ref.[21]) and experimental data obtained for different regions of the spectrum (dotted lines; Refs.[6, 7])
3.1
Water in DMSO
Dimethylsulfoxide (DMSO) is a highly polar (µ ≈ 4.3D) aprotic solvent which mixes with water in all proportions at ambient conditions. The DMSO molecule has an exposed sulfonyl oxygen which acts as a strong hydrogen bond ac-ceptor. For more than forty years, a keen interest has grown over this substance because of its many practical applica-tions in biomedical sciences, industry, and as a medium for chemical reactions[24] Upon mixing, water and DMSO exhibit interesting changes in thermodynamical, structural, dynamical, and H-bond network properties. In particular, these mixtures present very large deviations from ideal mix-ing behavior near the composition 33% DMSO, which has been attributed to the formation of strong H-bond aggre-gates composed of one DMSO and two water molecules (1DMSO:2water). These changes and their molecular origin have been the subject of several MD simulation studies[25]. Analyses of the structure and hydrogen (H)-bond distri-butions reveal different types of molecular associations, with the prevalence of 1DMSO:2water H-bond aggregates of nearly tetrahedral ordering for water-rich mixtures and 2DMSO:1water linkages for DMSO-rich solutions[26]. The translational and reorientational dynamics of these mixtures investigated through MD simulations are in good agreement with experimental NMR data[27], showing minima for the self-diffusion coefficients and slowest reorientational dy-namics for mixtures with composition near 33% DMSO. Simulation studies of the dielectric relaxation[28] over the whole composition range yield results consistent with avail-able measurements[29] and unveils important microscopic details about the behavior of these mixtures.
One of the most interesting MD results on DMSO/water mixtures is the prediction of stable aggregates of compo-sition 2DMSO:1water in DMSO-rich mixtures[26]. While the existence of 1DMSO:2water aggregates seems self-evident in view of the mixing behavior exhibited by sev-eral physcochemical properties, unambiguous experimental evidence for the 2DMSO:1water aggregates found in the simulations is still lacking. One of the most conspicuous characteristic of the 2DMSO:1water molecular aggregate is that the central water molecule is flanked by two massive DMSO molecules which strongly interact with it through H-bonding. This “bound” water molecule, being situated in a DMSO-rich microenvironment, is expected to present very different short-time, librational dynamics than that found in pure water. Indeed, our simulations[26, 28] of the far-infrared absorption coefficient for the pure liquids and for mixtures of different compositions predicts an “splitting” of water’s librational band (600-800 cm−1) for DMSO-rich
in Fig.4 (a schematic drawing of the 2DMSO:1water ag-gregate is presented on top). The spectrum for pure water consists of the overlap of the individual spetra for each prin-cipal component, was mentioned before. In a DMSO-rich environment the spectrum for the angular velocity decon-volutes into two submaxima due to the narrowing of each contribution. The peak in the spectrum forΓx shifts from about 850 in pure water to 750 cm−1 in the 80% DMSO mixture, indicating that the rapid small-amplitude rotations of the water molecule about thexaxis is less hindered in the mixture. This has been rationalized in terms of the aggregate drawn in Fig.4, in which the H-bonding donor character of the water molecule is similar to that in pure water, whereas its acceptor character is very distinct. With practically no H-bonding to its oxygen atom in these environments, the water molecules experience very little restoring forces off the plane of the sheet, thus rendering librations about thex
axis less hindered[28].
Figure 3. Simulated far-IR spectra for pure DMSO, pure water and two selected DMSO/water mixtures, indicated by the mole fraction of DMSO. The spectrum for pure water has been divided by 3 to fit the scale of the figure.
3.2
Supercritical water
Supercritical states of water provide environments with spe-cial properties where many reactive process with important technological applications take place[30]. To give just one example, water under supercritical conditions (T > Tc = 647K) is an extremely powerful, and environmentally be-nign, oxydizing agent with important applications in the treatment of industrial toxic wastes. Two key aspects com-bine to make chemical reactivity under these conditions so peculiar: The solvent high compressibility, which allows for large density variations with relatively minor changes in the applied pressure, and the drastic reduction of bulk polarity, clearly manifested in the drop of the macroscopic dielec-tric constant from ǫ ≈ 80 at room temperature to ǫ ≈ 6 at near-critical conditions. From a microscopic perspective, the unique features of supercritical fluids as reaction media
are associated with density inhomogeneities present in these systems[31].
Figure 4. Frequency spectra for the normalized time correlation functions for the principal components of the water molecules’ an-gular velocity in pure water (thick lines) and in an aqueous mix-tures with 81% DMSO (thin lines). The drawing is a schematic of the 2DMSO:1water H-bonded aggregate predicted by MD.
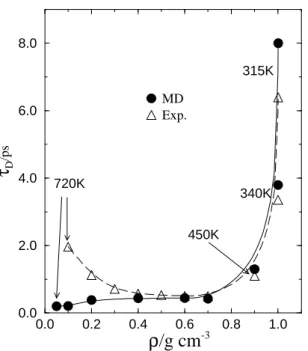
Recently, microwave spectroscopy measurements have been reported for SCW at several different densities rang-ing from ρ = 1 down to 0.1 g/cm3
, in an attempt to pro-vide valuable characterization of the dynamical nature of such reaction media[32]. By fitting the measured frequency-dependent dielectric permittivity with a single Debye disper-sion relation, Okada et al.[32] have found that the dielectric relaxation timeτDpresents a non-monotonic density depen-dence, with an unexpected branch forρ <0.4g/cm3
, show-ing a rapid increase ofτDwith decreasing density. This in-teresting feature could lead to distinctive dynamical solvent effects on molecular or ionic probes in solution. This results is surprising because one expects faster, not slower, dipole reorientation as the intermolecular interactions get weaker with decreasing bulk density. In order to investigate the molecular origin of this intriguing effect, we carried out a series of MD simulations for several supercritical thermo-dynamic states of water with densities ranging from 0.05 up to 1.0 g/cm3
density decreases below this value. The origin of such dis-crepancy is still not entirely clear, but our analysis indicate that the behavior of the dielectric relaxation time is consis-tent with the theoretical free-rotor limit asρ→0. The MD analyses[33] also show that the dielectric response is highly nonexponential in the low density regime, which then indi-cates that the experimental estimates forτDobtained from a single Debye fit to the spectra may be highly uncertain. Interestingly, another simulation work, using a much more sofisticated, polarizable water model, was latter published corroborating our results[34]. We believe that further inves-tigations in this area are surely needed.
0.0 0.2 0.4 0.6 0.8 1.0
ρ
/g cm
-30.0 2.0 4.0 6.0 8.0
τ
D/ps
MD Exp.
315K
340K
450K 720K
Figure 5. MD and experimental Debye dielectric relaxation times for supercritical water as functions of density. When not indicated, the temperature is 650 K. The lines are drawn as guides to the eye.
4
Time resolved fluorescence
Considerable experimental and theoretical efforts have been devoted to the study of molecular mechanisms of solvation dynamics, that is, the relaxation of the surrounding solvent molecules in response to sudden changes in the spectro-scopic solute probe’s charge distribution, which are usually brought about a photoinduced transfer of electronic charges from one side of the probe molecule to the other[35, 36]. The study of solvation dynamics at a molecular level com-prises an important step towards obtaining a deeper under-standing of the dynamical effects of the solvent environment on electron and other charge transfer reactions in solution, and in broader sense of the effects of solvent dynamics on chemical reactions.
Time-dependent Stokes shift spectroscopy provides one means to experimentally access the dynamics of solvation, specially for macroscopically homogeneous environments[35, 36]. In these experiments, the data are usually reported in terms of normalized spectral response
functions describing the temporal evolution of S(t) = [ν(t)−ν(∞)]/[ν(0)−ν(∞)], whereν(t)refers to the max-imum of the emission band at timet. In MD simulations, the photoexcitation is treated within the Frank-Condon ap-proximation, in which the solute’s ground and excited states usually differ only by their charge distributions. The corre-sponding solvation response function is given by
S(t) = h∆E(t)−∆E(∞)ine
h∆E(0)−∆E(∞)ine (2)
where∆E(t) =US1
el (t)−U S0
el (t)is the difference between
the S1and the S0Born-Oppenheimer potential energy
sur-faces andh...inedenotes an average taken over the nonequi-librium trajectories. This requires knowledge of the excited and ground state charge distributions of the solute probe, which is usually obtained from quantum chemical electronic structure calculations. The family of organic dyes known as coumarins are among the most popular chromophores used to investigate solvation dynamics in liquids. Coumarin 153 (C153) is one of them.
4.1
Binary aqueous mixtures
0 0.2 0.4 0.6 t (ps)
0.0 0.2 0.4 0.6 0.8 1.0
S(t)
water xD=0.25 xD=0.50 xD=0.75 DMSO
0 2 4 6
t(ps) 0
1 2 3 4 5 6
S(t)
exp MD
1.00 0.75 0.50 0.32 0.25
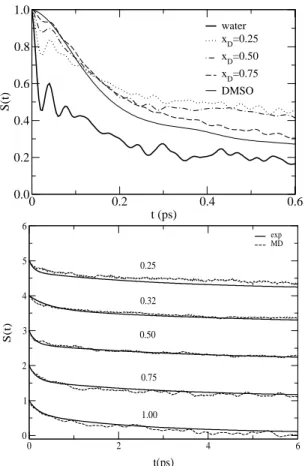
Figure 6. Nonequilibrium solvation responses for pure water and DMSO and selected DMSO/water mixtures obtained from MD simulations using an all-atom model for the coumarin C153.
4.2
Hydrated electrons
The hydrated electron (an excess electron trapped into the solvent) is an excellent probe for time-dependent spectro-scopies because of its large optical cross-section and the suf-ficiently long lifetime of the first excited state[41]. From the theoretical viewpoint, the solvated electron is also the pro-totype system for mixed quantum-classical (MQC) simula-tions and has been extensively used in the development of new computational methodologies and the exploration of a variety of new physical phenomena in condensed media[42]. In such MQC simulations the dynamics of the quantum par-ticle (the electron) is fully described within the bath of clas-sical solvent molecules. Previous simulation studies of the nonadiabatic relaxation from excited states[43] and the dy-namics of solvent reorganization in response to the photoex-citation of a self-trapped electron in aqueous solution[44] have revealed that the dynamical behavior of this system is extremely rich. In summary, the solvation dynamics re-sponse resembles that of classical solutes in polar liquids, with an initial Gaussian decay characterized by a∼ 17fs decay time, followed by a slower (250 fs) exponential decay comprising roughly 60% of the relaxation. However, unlike most classical perturbations, the solvation mechanisms in-volve considerable solvent translational motions in order to accommodate the changes in shape and size of the electronic wavefunction upon photoexcitation (from ans−like ground
state to ap−like first excited state) or after a nonadiabatic transition (fromp−tos−like states). The relative impor-tance of fast solvent librations in comparison with transla-tional motions to the different stages of solvation process was not entirely clear for the hydrated electron.
0 100 200 300 400
t (fs)
0.3 0.4 0.5 0.6 0.7 0.8 0.9 1
Cd
(t)
0.6 0.7 0.8 0.9 1
Cd
(t) (a)
(b)
Figure 7. Comparison between simulation and experimental sol-vation responses for C153 in DMSO/water mixtures (thick lines) after convolution of the MD response with a Gaussian function rep-resenting the instrument time resolution. The Gaussian is centered at 200 fs for pure DMSO and thexD =0.75 solution, and at 140
fs for the other mixtures.
response of the hydrated electron. Moreover, the character-istics of the diffusive contributions are distinct from those of the librational and single-molecule internal modes. In the phenomenological Brownian oscillator picture, the former behaves like an overdamped oscillator, whereas the behav-ior of the librations and intramolecular vibrations is typi-cally underdamped. From the viewpoint of the INM theory, these features stem from the different degrees of localization of the diffusive, librational, and internal motions. Further comparison of panels (a) and (b) of Fig.7 suggests that both librational and diffusive contributions are slightly larger for the downward than for the upward transition. This differ-ence is clearly associated with the spatial shrinkage of the electron wavefunction for the downward transition which creates a void readily occupied by the neighboring solvent molecules, starting with the rapid dragging in of the light hydrogen atoms.
4.3
Electrons in supercritical water
Another interesting problem where mixed quantum-classical simulations contributed with new physical insights is that of the quantum states of excess electrons solvated in supercritical fluids. In normal dense fluids, the ground and first few excited state wavefuctions for the solvated elec-tron are spatially localized in a roughly spherical region not much larger than a halogen anion due to the interactions with the surrounding solvent molecules. In a hypothetical situa-tion in which the number density of the solvent environment is gradually reduced down to nearly zero, one would expect the excess electron wavefunction to change from a spatially localized to a delocalized, quasifree state over the entire vol-ume nearρ= 0, resembling the text-book problem of a par-ticle in a box. With supercritical fluids, this situation can in principle be materialized since the density can be drastically varied by small variations of the external pressure[31].
For many years, a series of pulse radiolysis experiments has provided evidence that electronic states can be supported in aqueous supercritical environments[46, 47, 48] and that the spectral characteristics of solvated electrons can be used to investigate the structure of the local inhomogeneities in supercritical systems[49]. It is generally believed that a gradual transition from localized states, typical of dense po-lar fluids, to quasifree electronic states under supercritical conditions leads to the observed red shifts in the optical ab-sorption spectra and to significant changes in the dynamical behavior of the electron, most notably a dramatic increase in its drift mobility[50]. However, experimental[46] absorp-tion spectra of nearly supercritical water atT = 623K ex-hibit a weak density dependence of the spectral shift over a wide interval ranging from 1 g cm−3down to 0.05 g cm−3, thus suggesting that the electron localization in aqueous su-percritical environments persists at density as low as 0.05 g cm−3.
Laria and Skaf[51] recently addressed this problem by simulating an excess quantum electron in a bath of classi-cal water using Feynman Path Integral MD techniques. This formalism explores the well-known isomorphism between the statistical mechanics of the quantum electron path and
that of a classical cyclic polymer containing pseudoparticles (“beads”) with harmonic nearest neighbor interactions. The most direct route to analyze the extent of the electronic lo-calization is by examining the behavior of the mean square correlation function for the solvated electron-polymerR2
(t) defined by:
R2(t−t′) =h|r(t)−r(t′)|2i, 0≤t−t′≤β~; (3) wherer(t)represents the electron position at imaginary time
tandβ−1
is Boltzmann constant times the temperature. At low densities (ρw < 0.1 g cm−3), the correlation func-tions (Fig. 8, left panel) look similar to those correspond-ing to Gaussian free polymers: Interparticle distances along the electron polymer are characterized by a wide variety of lengthscales, up to roughly half the de Broglie thermal wavelength,λdB(T = 645K)≈12 ˚A. As we move towards
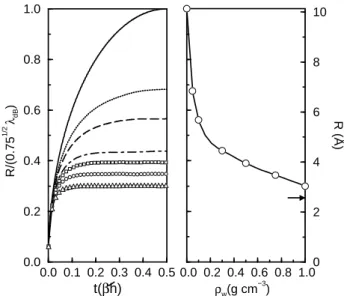
the density regime of typical dense fluids, there is a qualita-tive change in the temporal behavior of the curves. After a short transient lasting≈0.1β~, the curves level off at practi-cally plateau values. This time independence has been inter-preted as a signature of statistical dominance of the ground state on the behavior of the electron. Expressed in terms of the spectrum of instantaneous electron eigenvalues, this sit-uation corresponds to large energy gaps (≫kBT) between the ground and the manifold of excited states. More di-rect evidence of this transition is acquired by inspecting the density dependence of the correlation length for the elec-tron polymerR = R(β~/2), shown in the right panel of Fig.8. The sudden drop to practically half of the ideal, non-interacting,ρw = 0value within a narrow density interval and an abrupt change in the slope of the curve, reveal the on-set of the electronic localization atρw≈0.15g cm−3. For densities well below the localization threshold, one can see the electron wavefunction tunneling across the surrounding water molecules.
0.0 0.1 0.2 0.3 0.4 0.5
t(βh)
0.0 0.2 0.4 0.6 0.8 1.0
R/(0.75
1/2
λdB
)
0 2 4 6 8 10
R (Å)
0.0 0.2 0.4 0.6 0.8 1.0
ρw(g cm
−3
)
Figure 8. Left: Root mean square correlation function for the ex-cess electron in supercritical water along theT = 645K isotherm.
Lines from top to bottom correspond toρw =0.0 (free electron),
0.05, 0.1, 0.3, 0.5, 0.7, and 1.0 g cm−3, respectively. Right:
The optical absorption spectra for supercritical states of water were also computed from our simulations and they re-produce the experimental values reasonably well, although the density dependence of the spectral red shift in the range 0.1 g cm−3 ≤ ρ
w ≤ 0.5 g cm−3 is somewhat more pro-nounced than that experimentally measured. Interestingly, there are apparently no noticeable changes in the density de-pendence of the spectral band maximum as the localization transition is crossed.
5
Ultrafast optical Kerr effect
The optical Kerr effect (OKE) ultrafast laser spectroscopy is part of a large family of multiple-wave mixing processes that exploits nonlinear optical responses of the material to ex-tract information on its ultrarapid intra- and intermolecular dymamics directly in time domain[14]. OKE spectroscopy has been successfully applied to extract dynamical informa-tion of a large variety of pure liquis, mixtures, and confined fluids[52]. In liquid water, the nonlinear optical signal is dominated by the electronic polarizability response, as the motion of the nuclei provides less than 5% of the total re-sponse. This increases the degree of uncertainty in obtain-ing the dynamics of water and here is where MD simulations come in.
The optically heterodyne-detected OKE signal in the time domain reflects the third order electric susceptibility of the sample and provides valuable information about the intermolecular dynamics through the nuclear response func-tion,Rnuc
(t). This quantity is experimentally obtained from the raw OKE transients after removal of the instantaneous electronic response and deconvolution from the instrument function[53].Rnuc
(t)can also be fairly easily obtained from a sufficiently long set of MD trajectories by simply comput-ing the time derivative of the anisotropy collective polariz-ability TCF through:
Rnuc
(t) =−Θ(t)
kBT
∂Ψ(t)
∂t , (4)
where Θ(t) is the Heaviside step function and Ψ(t) ∝ hΠxz(t) Πxz(0)i is the TCF of the polarizability anisotropy, with
Π=X
i
αi=ΠM +ΠI , (5)
where the total polarizability has been separated into intrin-sic (molecular),ΠM, and induced,ΠI contributions. The intrinsic part is the sum of unperturbed, gas phase molecular polarizabilities properly rotated into the lab frame of ref-erence, while the induced counterpart is computed through some induction or modulation scheme such as the dipole-induced-dipole mechanism.
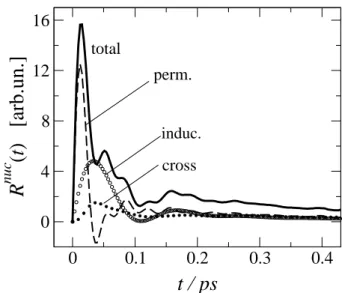
We have studied the OKE response for pure water and also in water-DMSO mixtures using molecular polarizabil-ity and hyperpolarizabiliy tensors obtained from electronic structure calculations at the MP2/6-311++G(d,p) level in our MD simulation analysis[54]. The results for Rnuc
(t)
of liquid water are shown in Fig.9, along with the perma-nent or molecular polarizability autocorrelation, induced po-larizability contributions and the cross-correlation between permanent and induced anisotropies. The simulated OKE nuclear response exhibits a very rapid rise within the ini-tial stages, showing local maxima near 15, 50, and 180 fs, followed by a diffusive tail which has been fitted by a bi-exponential with time constants∼0.2 and 2.0 ps. The short time features are in good agreement with previous simula-tions as well as with experimental results reported by Cast-ner et al.[55], which shows peaks at ∼20, 57, and 197 fs. The agreement with experiments is less satisfactory for the diffusive components. Figure 9 also shows that the first peak is almost entirely given by fast molecular reorientational that clearly associated to librational motions, while the subse-quent maxima stem from a combination of permanent and induced contributions. The maximum near 180 fs seems to have important contributions from translational dynam-ics as indicated by the amplitude of the induced term around that time window. The hindered translational motions of the O atoms comprise the underlying molecular mechanism for this feature.
0
0.1
0.2
0.3
0.4
t / ps
0
4
8
12
16
R
nuc
(t
) [arb.un.]
total
induc.
cross
perm.
Figure 9. The OKE nuclear response function for water obtained from MD simulations. The total response and the separate contri-butions are as indicated.
6
Vibrational Dephasing
Vibrational dephasing refers to the lost of coherence by a collection of oscillators coupled to a solvent bath[56]. Imag-ine an oscillator whose vibrational motion is being perturbed by the fluctuating interactions with the surrounding solvent. The phase of the oscillations will soon go random due to the fluctuations in the intermolecular potential. In this phe-nomenon, both the timescale and magnitude of the force fluctuations are important[57]. Valuable information about the solvent dynamics can be extracted from a vibrational de-phasing analysis of Raman lineshapes if a sensitive Raman probe is used. In recent years, vibrational dephasing have also been investigated directly in the time domain using ul-trafast laser spectroscopies such as Raman echo or Raman free-induction decay[13].
The monocyclic dianions, CnO2−n (3≤n≤6), known as oxocarbon dianions comprise a family of excellent Ra-man probes[58]. The squarate (n = 4) and croconate (n = 5) ions exhibit unusually high Raman intensities for both totally symmetric and non-totally symmetric modes, with relatively well-separated bands. Such a distinctive property has been used to examine the Raman lineshapes of modes of different symmetries in aqueous solutions, thus providing an experimental route the reorientational dynam-ics about the in-plane and out-of-plane symmetry axes of the oxocarbons[58]. Detailed analyses based on the isotropic and anisotropic components of the totally symmetric ring breathing mode, along with the anisotropic parts of the non-totally symmetric C-C stretching and ring bending modes, indicate that reorientation of the oxocarbon anions is very hindered in water, with comparable decay rates for spinning and tumbling of the main symmetry axis. Vibrational de-phasing analysis predicted small relaxation times (∼0.1 ps) of the vibrational frequency fluctuations. This fast modu-lation together with the observed slow rotational-diffusion dynamics suggests a picture where the ions undergo rapid librational motions inside solvent cages, which are continu-ally formed and disrupted on a timescale that should exceed several times the characteristic librational period.
Indeed, our recent MD simulation studies of the squarate in water show the existence of a well-defined hydration shell, composed of an average of 12 water molecules H-bonded to the carbonyl oxygens (three water molecules per oxygen atom) which is preserved for more than 20-30 ps[59, 60]. The dynamics is isotropic and the anion librates at 70 and 250 cm−1[60]. In a separate MD study, we have
also investigated more closely the features of the vibrational dephasing of this species in water. Within the classical the-ory of vibrational dephasing, the instanteneous shift in the vibration frequency of modeαis related to solvent resultant forces along the coordinates of the normal mode of interest during the simulations, the anharmonicity constants,φαβγ, and the atomic displacements of each mode,Lα
m, which are obtained from a quantum chemical vibrational analysis of the isolated molecule[56]:
δωα(t) = modes
X
β
φααβ
soluteatoms
X
m
Lβ
mFm(t) (6)
The quantity of interest is the frequency shift dynamical fluctuations:
χα(t) =h∆ωα(t)∆ωα(0)i ; ∆ωα(t) =δωα(t)− hδωαi (7) from which one can compute the dephasing time1/Tα
2 =
R∞
0 χ
α(t)dtfor direct comparison with experimental mea-surements.
Out of all normal modes of the squarate dianion, the C=O stretching (ν1) and ring breathing (ν2) modes are
par-ticularly interesting because their use in the experimental analysis. The ring breathing dephasing time obtained from the simulations (0.08 ps) is in close agreement with the ex-perimental estimates (0.06 ps). The frequency shift corre-lation function separated in terms of the purely Coulom-bic, χC(t), and short-ranged dispersive (Lennard-Jones) forces,χLJ(t), for these two vibrational modes are shown in Fig.10. The results show that the electrostatic forces contri-butions to the dephasing exhibit fast dynamics at early times, clearly associated to the rapid motions of water hydrogen atoms, that is, solvent librations, but also present a slower component at longer times due to long-range nature of the Coulombic interactions. The dispersive contributions, on the other hand, fluctuates with larger timescales because it envolves motions of the oxygen atoms (the hydrogens have vanishing dispersive interactions), but show no long-time tail sinceχLJ(t)is essentially determined by the short-range structure of the liquid. Fig. 10 also shows the dephasing re-sponses for each mode with (thin lines) and without (thick lines) the anharmonic couplings between modes (cf. Eq.6). One sees that mode coupling affects essentially the LJ part of the dephasing correlation function for the C=O stretching, leaving the other correlations practically unaltered.
7
Water near interfaces
0.0 0.2 0.4 0.6 0.8 1.0
χ C
(t)
ν2
ν1
ν2acopl ν1acopl
0 0.2 0.4 0.6 0.8
t(ps) -0.2
0.0 0.2 0.4 0.6 0.8 1.0
χ LJ
(t)
Figure 10. Dephasing responses obtained for the C=O stretching (ν1 and ring breathing (ν2) modes of the squarate anion in water. The upper and lower panel depicts the Coulombic and dispersive contributions, respectively.
Of particular interest, the water/carbon tetrachloride (H2O/CCl4) interface emerges as an important prototype for
hydrophobic interacting systems that grossly mimic biolog-ical membranes, and as a natural support media for surfac-tant systems in molecular simulation studies. In addition, the CCl4 molecules are quite insensitive to infrared
radia-tion absorpradia-tion, eliminating possible interferences in non-linear spectroscopy of interfacial water molecules. Very re-cently, we have performed extensive MD simulations for the H2O/CCl4liquid/liquid interface aiming at elucidating the
general structural and dynamical features of this interface at a microscopic level[63]. We present next MD results regard-ing the orientation of water molecules near the interface and how it influences the dynamics of interfacial water. The sim-ulations were performed using models that include internal vibrations.
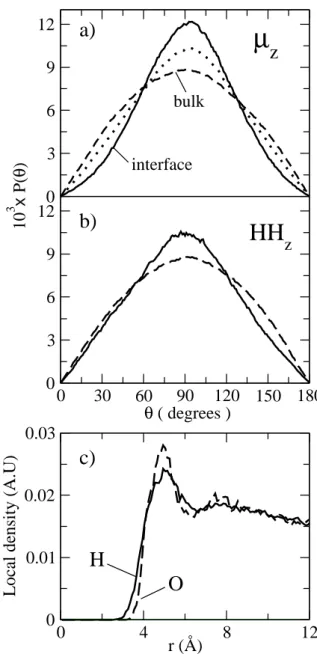
The average orientation of the water molecules with re-spect to the plane of the interface is an important structural feature that can be determined from the normalized proba-bility distribution for the angle between the water dipole and the Z axis (normal to the interface), and also for the angle be-tween the Z axis and the vector joining the hydrogen atoms of a given molecule. For clarity, we denoteµzandHHzthe Z components of the unitary dipole and HH vectors, respec-tively. The results are depicted in Fig.11a and 11b for bulk (dashed lines) and interfacial (solid lines) water molecules. For comparison, Fig.11a also shows the distribution of the dipoles’ Z components for an intermediate region between
0
3
6
9
12
0
30
60
90
120
150
180
θ
( degrees )
0
3
6
9
12
10
3
x
P(
θ
)
0
4
8
12
r (Å)
0
0.01
0.02
0.03
Local density (A.U)
µ
z
HH
z
bulk
interface
H
O
a)
b)
c)
Figure 11. Probability distributions for the angle between the Z axis (normal to interface) and the unit dipole (panel a) and HH vectors (panel b) for bulk and interfacial regions obtained from MD simulations of a water/CCl4liquid/liquid interface.
bulk and interface (dotted line). For an isotropic environ-ment such as bulk liquid, the orientation of any molecular vector follows an uniform distribution, which in polar coor-dinates is simply given byPiso
of this interface, although in less detailed molecular terms. Further support to this observation is provided by the local density of hydrogen and oxygen atoms as measured from the center of masses of CCl4molecules located at the interface.
Fig. 11c shows the local density for the H (solid line) and O (dashed line) atoms in arbitrary units. The local density of H atoms is divided by two, such that at larger distances it coincides with the local density of O atoms. Fig. 11c clearly shows that in going from the organic to the aqueous phase one would encounter a water hydrogen first. Analysis of the H-bond distribution shows that, near the interface, the average number of H-bonds per water molecule is only 2.7, indicating the presence of “free” OH bonds.
0
1
2
3
4
0
0.5
1
ω
2
C
vH
(
ω
)
3.2
3.4
3.6
3.8
4
ω
/ 10
3x
cm
-10
0.5
1
ω
2
C
vH
(
ω
)
bulk
interface
Figure 12. Frequency spectra for the water hydrogen atoms veloc-ity time correlation for molecules in the bulk phase (upper panel) obtained from MD simulations. The lower band (<1000cm−1)
is due to intermolecular librations and the two upper bands reflect the bond bending and stretching modes. The lower panel shows the spectrum in the region of stretching modes for water near the CCl4 interface.
The dynamics of the water molecules in the vicinity of the CCl4 interface can be investigated in several different
ways. One of the simplest and most elucidating form of unveiling this dynamics is through the frequency spectrum of the hydrogen velocity TCF,CvH(t). Fig. 12 shows the
˜
CvH(ω) spectra of the hydrogen dynamics for bulk water molecules. The intermolecular, librational band discussed before that appears below 1000 cm−1is clearly seen for both
bulk and interface water. The sharp peaks near 1500 and 3600 cm−1stand for the bond bending and stretching inter-nal modes (symmetric and antisymmetric altogether). The
lower panel shows the spectrum in the region of the stretch-ing modes for water near the interface with CCl4. The
spec-trum is remarkably similar to that obtained experimentally through VSF spectroscopy of this interface[61], thus rein-forcing the view that near these interfaces there should exist “free” OH bonds. Further research in this direction is cur-rently being conducted.
8
Ligand-protein dissociation
Water has also a fundamental role on the structure and dy-namics of biomolecules, particularly proteins. From the point of view of molecular dynamics simulations, this intro-duces significant challenges, since the complete solvation of a large biomolecule requires tens of thousands of water molecules, increasing by orders of magnitude the computa-tional demand. Thus, it is common to neglect the effect of water molecules, even without rigorous studies on the role of water in the simulations being performed.
One of the main fields where molecular dynamics simu-lations is able to provide valuable insights is the association and dissociation pathways of ligands into or from their re-ceptors. Among these receptors a very important class is the Nuclear Hormone Receptor Superfamily, which controls the activity of the most important hormones in vertebrates, such as the Retinoic Acid (Vitamin A), Estrogen and Thy-roid hormones, for example. The pathways of dissociation of the Retinoic Acid from its receptor RAR-γwere accessed through molecular dynamics simulations by Karplus and co-workers by a technique known as Enhanced Sampling Molecular Dynamics (ESMD) which is designed, basically, to reduce the potential barriers for ligand escape increasing the dissociation rates [64]. This is achieved by simulating a collection of hormone replicas in the presence of a unique protein in such a way that the replicas do not interact with each other while the interaction with the protein is scaled by the number of hormone replicas being used in the simula-tion. This permits the simulation of the dissociation path-ways in time scales accessible for MD simulations.
The simulations of Karplus and co-workers where per-formed without any water molecule due to the computa-tional cost of simulating the solvent. This was consistent with the use of a technique where the potential parameters of interactions are approximated with the goal of increas-ing dissociation rates. They observed a mechanism that was already suggested in the literature [65] known as “mouse trap”, which is represented in Fig.13 and consists basically on the movement of the Helix 12 apart from the body of the protein, forming a cavity through which the hormones scape. They observed this pathway in less than 100 ps, as is shown in Fig.13.
Figure 13. Dissociation pathway of the retinoic acid from its receptor resembling the “mouse trap” mechanism obtained from ESMD simulations in the absence of solvent molecules.
Figure 14. Detail of the dissociation pathway of the retinoic acid from its receptor showing stabilization of the protein structure through a H-bond network promoted by the presence of structural water molecules.
the sense that their residence time in the corrsponding po-sitions relative to the protein structure is very long com-pared water diffusion in bulk solvent [66]. We then per-formed ESMD simulations with the same protein, hormone and techniques used by Karplus and co-workers to access the role of structural water molecules in the dissociation pathways proposed[67]. We performed four independent simulations with 20 and 50 retinoic acid replicas, with and without the presence of crystallographic water molecules, for 200 ps each. The first simulation reproduced part of the results presented in [64], revealing, indeed, the “mouse trap” mechanism in the same time scale as shown in Fig.13.
However, the simulation with 20 hormone replicas in the presence of structural water molecules did not lead any hor-mone dissociation within 200 ps, which is more than twice the time needed to dissociate in the absence of water. The detailed observation of the dynamics of the water molecules in the region where the Helix 12 should loose its interactions to the protein leading to dissociation in the 20 copies sim-ulation unveils important information about the interaction of water with key aminoacids. As shown in Fig.14, while the Serine in the bottom of the Figure belongs to the protein body, the Proline and Leucine at the top belong to the Helix 12. Clearly, the water molecules form bridges of three or four hydrogen bonded molecules between these aminoacids
throughout the course of the simulation. This restrains the movement of the Helix 12 and, thus, hinders hormone es-caping from the receptor’s cavity.
This result has shown that while the structural water molecules did not promote a different pathway for disso-ciation, they significantly decrease the dissociation rate by stabilizing the protein structure. This is a novel and inter-esting example of the very important role that water plays to biomolecular structure and dynamics, and that it has an active role on the functionality of protein structures.
9
Concluding Remarks
We have presented a review on the dynamical properties of several aqueous systems focused largely on computer simu-lation work performed in our lab at the State University of Campinas. With this mosaic, hope to have given the reader, specially the nonexpert in this field, a glimpse at the fasci-nating dynamical behavior of water.
Acknowledgements
Daniel Laria, Mauro Ribeiro, Branka Ladanyi, Peter Rossky, and Igor Polikarpov for their wonderful collaboration.
References
[1] F. H. Stillinger, Adv. Chem. Phys. 31, 1 (1975); Science 209, 451 (1980). Over the years, there have been inumerous ex-cellent reviews on water and aqueous systems. These and the next three references serve as a starting point to the literature and reflects the authors personal choice. More recent review articles can be found by a quick bibliographic search over the Internet.
[2] P. J. Rossky, Annu. Rev. Phys. Chem. 36, 321 (1985).
[3] B. M. Ladanyi and M. S. Skaf, Annu,. Rev. Phys. Chem. 44, 335 (1993).
[4] I. Ohmine and H. Tanaka, Chem. Rev. 7, 2545 (1993).
[5] K. Liu, M. G. Brown, C. Carter, R. J. Saykally, and D. C. Clary, Nature 381, 501 (1996); F. N. Keutsch, and R. J. Saykally, Proc. Nat. Acad. Sci. (USA) 98, 10533 (2001).
[6] U. Kaatze and V. Uhlendorf, Z. Phys. Chem. N. F. 126, 151 (1981).
[7] M. N. Afsar and J. B. Hasted, J. Opt. Soc. Am. 67, 902 (1977); J. B. Hasted, S. K. Husain, F. A. M. Frescura, and J. R. Birch, Chem. Phys. Lett. 118, 622 (1985); A. N. Rusk, D. Williams, and M. R. Querry, J. Opt. Soc. Am. 61, 895 (1971).
[8] A. de Santis, M. Sampoli, V. Mazzacurati, and M. A. Ricci, Chem. Phys. Lett. 133, 381 (1987); A. de Santis, R. Frattini, M. Sampoli, V. Mazzacurati, M. Nardone, M. A. Ricci, and G. Ruocco, Mol. Phys. 61, 1199 (1987).
[9] C. J. Montrose, J. A. Bucaro, J. Marshall-Coakley, and T. A. Litowitz, J. Chem. Phys. 60, 5025 (1974).
[10] J. Jonas, T. DeFries, and D. J. Wilbur, J. Chem. Phys. 65, 581 (1981).
[11] A. K. Soper and A. Luzar, J. Phys. Chem. 100, 1357 (1996); J. Chem. Phys. 97, 1320 (1992).
[12] J. E. Bertie and Z. Lan, Appl. Spectrosc. 50, 1047 (1996); J. T. Kindt, and C. A. Schmuttenmaer, J. Phys. Chem. 100, 10373 (1996).
[13] M. Berg and D. A. Vanden Bout, Acc. Chem. Res. 30, 65 (1997).
[14] S. Palese, L. Schilling, R. J. D. Miller, P. R. Staver, and W. T. Lotshaw, J. Phys. Chem. 98, 6308 (1994); E. W. Castner Jr., Y. J. Chang, Y. C. Chu, and G. E. Walrafen, J. Chem. Phys.
103, 653 (1995); K. Winkler, J. Lindner, H. B ¨ursing, and P.
V¨ohringer, J. Chem. Phys. 113, 4674 (2000); C. J. Fecko, J. D. Eaves, and A. Tokmakoff, J. Chem. Phys. 117, 1139 (2002).
[15] S. Saito and I. Ohmine, J. Chem. Phys. 106, 4889 (1997); I. Ohmine and S. Saito, Acc. Chem. Res. 32, 741 (1999); B. D. Bursulaya and H. J. Kim, J. Chem. Phys. 109, 4911 (1998).
[16] A. Perry, H. Ahlborn, B. Space, and P. B. Moore, J. Chem. Phys. 118, 8411 (2003).
[17] A. Rahman and F. H. Stillinger, J. Chem. Phys. 55, 3336 (1971).
[18] H. J. C. Berendsen, J. R. Grigera, and T. P. Straatsma, J. Phys. Chem. 91, 6269 (1987).
[19] The Chemical Physics of Solvation, edited by R. Dogonadze, E. Kalman, A. Kornyshev, and J. Ulstrup (Elsevier, Amster-dam, 1985), Part A.
[20] F. O. Raineri, H. Resat, B.-C. Perng, F. Hirata, and H. L. Friedman, J. Chem. Phys. 100, 1477 (1994); H. L. Friedman, F. O. Raineri, F. Hirata, and B.-C. Perng, J. Stat. Phys. 78, 239 (1995).
[21] M. Neumann, J. Chem. Phys. 85, 1567 (1986).
[22] W. L. Jorgensen, S. Chandrasekhar, J. D. Madura, R. W. Im-pey, and M. L. Klein, J. Chem. Phys. 79, 926 (1983).
[23] P. A. Madden and R. W. Impey, Chem. Phys. Lett. 123, 502 (1986); B. Guillot, J. Chem. Phys. 95, 1543 (1991); B. D. Bursulaya and H. J. Kim, J. Chem. Phys. 109, 4911 (1998).
[24] D. Martin, H. Hanthal, Dimethyl Sulfoxide (Wiley, New York, 1975); J. C. De la Torre, Ann. N. Y. Acad. Sci. 411, 1 (1983); Biological Actions of Dimethyl Sulfoxide; New York Academy of Sciences, vol. 243, edited by S. W. Jacob and R. Herschler (New York, 1975).
[25] I. I. Vaisman and M. L. Berkowitz, J. Am. Chem. Soc. 114, 7889 (1992); A. Luzar and D. Chandler, J. Chem. Phys. 98, 8160 (1993); A. Vishnyakov, A. P. Lyubarsev, and A. Laak-sonen, J. Phys. Chem. A 105, 1702 (2001).
[26] I. A. Borin and M. S. Skaf, Chem. Phys. Lett. 296, 125 (1998); J. Chem. Phys. 110, 6412 (1999).
[27] K. J. Packer and D. J. Tomlinson, Trans. Faraday Soc. 67, 1302 (1971).
[28] M. S. Skaf, J. Phys. Chem. A 103, 10719 (1999).
[29] U. Kaatze, R. Pottel, and M. Sch¨afer, J. Phys. Chem. 93, 5623 (1989); S. M. Puranik, A. C. Kumbharkhane, and S. C. Mehrotra, J. Chem. Soc., Faraday Trans. 88 433, (1992).
[30] Innovations in Supercritical Fluids, Science and Technology; K. W. Hutchenson and N. R. Foster, ACS Symposium Series 608; (American Chemical Society, Washington DC, 1995); P. B. Balbuena, L. W. Flanagin, K. P. Johnston, and P. J. Rossky, in Physical Chemistry of Aqueous Systems: Meet-ing the Needs of Industry, H. J. White, J. V. Sengers, D. B. Neumann, and J. C. Bellogs, Eds. (Begell House, New York, 1995); C. A. Eckert, B. L. Knutson, and P. G. Debenedetti, Nature, 383, 313 (1996); See also the thematic issue on su-percritical fluids, Chem. Rev. 99, 353 (1999).
[31] S. C. Tucker, Chem. Rev. 99, 391 (1999); G. Goodyear, S. C. Tucker, J. Chem. Phys. 111, 9673 (1999); S. C. Tucker, M. W. Maddox, J. Phys. Chem. B 102, 2437 (1998).
[32] K. Okada, M. Yao, Y. Hiejima, H. Kohno, and Y. Kajihara, J. Chem. Phys. 107, 9302 (1997); 110, 3026 (1999).
[33] M. S. Skaf and D. Laria, J. Chem. Phys. 113, 3499 (2000).
[34] C. Yang and H. J. Kim, J. Chem. Phys. 113, 6025 (2000)
[36] For reviews emphasizing theoretical aspects see: R. M. Stratt and M. Maroncelli, J. Phys. Chem. 100, 12981 (1996); B. M. Ladanyi and R. M. Stratt, J. Phys. Chem. 99, 2502 (1995); J. Phys. Chem. 100, 1266 (1996); H. L. Friedman, F. O. Raineri, F. Hirata, and B.-C. Perng, J. Stat. Phys. 78, 239 (1995); F. O. Raineri and H. L. Friedman, Adv. Chem. Phys. 107, 81 (1999); B. Bagchi and R. Biswas, Adv. Chem. Phys. 109, 207 (1999).
[37] M. S. Skaf and B. M. Ladanyi, J. Phys. Chem. 100, 18258 (1996); J. Molec. Struct. (THEOCHEM) 335, 181 (1995); M. S. Skaf, I. A. Borin, and B. M. Ladanyi, Molec. Eng. 7, 457 (1997);
[38] D. Laria and M. S. Skaf, J. Chem. Phys. 111, 300 (1999).
[39] L. R. Martins, A. Tamashiro, D. Laria, and M. S. Skaf, J. Chem. Phys. 118, 5955 (2003).
[40] B. M. Luther and N. E. Levinger, unpublished; B. M. Luther, PhD. Thesis, Colorado State University (2000).
[41] P. J. Rossky and J. D. Simon, Nature 370, 263 (1994).
[42] P. J. Rossky, in Classical and Quantum Dynamics in Con-densed Phase Simulations, edited by B. J. Berne, G. Cicotti, and D. F. Coker (World Scientific, Singapore, 1998), p. 515.
[43] O. V. Prezhdo and P. J. Rossky, J. Phys. Chem. 100, 17094 (1996).
[44] B. J. Schwartz and P. J. Rossky, J. Chem. Phys. 101, 6902 (1994); J. Chem. Phys. 105, 6997 (1996).
[45] C. Y. Yang, K. F. Wong, M. S. Skaf, and P. J. Rossky, J. Chem. Phys. 114, 3598 (2001).
[46] Gaathon, A.; Czapski, G.; Jortner, J. J. Chem. Phys. 58, 2648 (1972); Jortner, J.; Gaathon, A., Can. J. Chem. 55, 1801 (1977).
[47] Michael, B. D.; Hart, E. J.; Schmidt, K., J. Phys. Chem. 75, 2798 (1971).
[48] Wu, G.; Katsumura, Y.; Muroya, Y.; Li, X.; Terada, Y., Chem. Phys. Lett. 325, 351 (2000); Radiat. Phys. Chem. 60, 395 (2001).
[49] (a) Bartels, D. M.; Cline, J. A.; Jonah, C. D.; Takahashi, K. Abstract Am. Chem. Soc. Meeting, 222:263-PHYS, Part 2 (Washington, August, 2001); (b) Cline J. A.; Jonah, C. D.; Bartels, D. M. The Solvated Electron in Supercritical Water: Spectra, Yields, and Reactions, Proceedings of the 1st Inter-national Symposium in Supercritical Water-cooled Reactors,
Design, and Technology – SCR-2000 (Nov. 6-9,2000, Tokyo, Japan); Dimitrijevic, N. M.; Takahashi, K.; Bartels, D. M.; Jonah, C. D., J. Phys. Chem. A 105, 7236 (2001).
[50] Giraud, V.; Krebs, P., Chem. Phys. Lett. 86, 85 (1982); Krebs, P.; Heintze, M., J. Chem. Phys. 76, 5484 (1982).
[51] D. Laria and M. S. Skaf, J. Phys. Chem. A 106, 8066 (2002).
[52] R. A. Farrer and J. T. Fourkas, Acc. Chem. Res. 36, 605 (2003).
[53] D. McMorrow, W. T. Lotshaw, and G. Kenney-Wallace, IEEE J. Quantum Electron. QE-24, 443 (1988); S. J. Rosenthal, N. F. Scherer, M. Cho, X. Xie, M. E. Schmidt, and G. R. Fleming, in Ultrafast Phenomena, edited by J.-L. Martin, A. Migus, G. A. Mourou, and A. H. Zewail (Springer, Berlin, 1993); R. Righini, Science 262, 1386 (1993).
[54] M. S. Skaf and S. M. Vechi, J. Chem. Phys. 119, 2181 (2003).
[55] E. W. Castner, Jr., Y. J. Chang, Y. C. Chu, and G. E. Walrafen, J. Chem. Phys. 103, 653 (1995).
[56] D. Oxtoby, Adv. Chem. Phys. 40, 1 (1979); P.-O. Westlund and R. M. Lynden-Bell, Mol. Phys. 60, 1189 (1987).
[57] K. S. Schweizer and D. Chandler, J. Chem. Phys. 76, 2296 (1982); R. F. Loring and S. Mukamel, J. Chem. Phys. 83 2116 (1985).
[58] M. C. C. Ribeiro, L. F. C. de Oliveira, and P. S. Santos, Chem. Phys. 217, 71 (1997).
[59] L. R. Martins, P. A. M. Vazquez, and M. S. Skaf, J. Molec. Struct. (THEOCHEM) 580, 137 (2002).
[60] L. R. Martins, M. C. C. Ribeiro, and M. S. Skaf, J. Phys. Chem. B 106, 5492 (2002).
[61] G. L. Richmond, Annu. Rev. Phys. Chem. 52, 357 (2001); Chem. Rev. 102, 2693 (2002).
[62] K. B. Eisenthal, Chem. Rev. 96, 1343 (1996).
[63] N. H. Moreira, M.Sc. Thesis, State University of Campinas (2002).
[64] A. Blondel et al., J. Mol. Biol. 291, 101 (1999).
[65] W. Bourget et al., Nature 375, 377 (1995).
[66] Y. K. Cheng, P. J. Rossky, Nature 392, 696 (1998).
![Figure 2. Real and imaginary parts of the frequency dependent di- di-electric permittivity of water obtained from MD simulations on the TIP4P model (solid lines; Ref.[21]) and experimental data obtained for different regions of the spectrum (dotted lines;](https://thumb-eu.123doks.com/thumbv2/123dok_br/18980929.456996/3.892.101.438.751.1038/imaginary-frequency-dependent-electric-permittivity-simulations-experimental-different.webp)