Space Charge in Polymers, Particularly Polyethylene
R. J. Fleming
Department of Physics
Monash University, Clayton, Victoria 3168 Australia
Received 7 October, 1998
Electronic charge transport in insulating polymers is briey discussed, particularly the measurement of charge carrier mobility. The more frequently used techniques of space charge prole measurement in dielectrics are then described, and data for polyethylene published during the last 5-6 years are reviewed.
I Introduction
Although dielectric loss measurements on insulating polymers were reported as early as 1941 [1], rela-tively little fundamental research aimed at understand-ing charge transport and trappunderstand-ing in these materials appeared in the literature until the mid-1950s. By that time it had been established that their dc dark conduc-tivities usually increase by several orders of magnitude under the inuence of low level ionizing radiation [2,3], and workers in the eld then used the concepts of car-rier excitation, trapping and recombination developed earlier for inorganic insulators to interpret their data. Our present day understanding of the eects of ioniz-ing radiation on charge transport and trappioniz-ing in di-electrics owes much to the sustained work of Gross and his colleagues over a period of at least 25 years [4-10].
A fairly satisfactory semi-quantitative model for charge injection, trapping and transport in polymers has gradually evolved [11,12]. In this model, electrons move through crystalline regions of the material with high mobilities (of order 1-10 cm2 V,1 s,1), occupy-ing extended states originatoccupy-ing in the covalent bondoccupy-ing between repeat units on the backbone of a single long chain molecule; this is intramolecular motion. Electron transport through the amorphous regions is achieved by hopping between localized states in which the elec-trons are immobilized for varying times; this involves both intra- and intermolecular motion, and is charac-terized by much lower mobilities (10,11-10,12cm2V,1 s,1). (See however the discussion of eld-dependent \mobilities" below). Electron transfer between local-ized states probably occurs mainly via tunnelling,
pre-ceded by phonon-driven excitation of the electron to a state from which tunnelling is more likely.
This model is consistent with macroscopic mea-surements such as (a) time-dependence of the current ow following application and removal of a dc volt-age, i.e. absorption and resorption current respectively, (b) eld-dependence of the steady-state current, (c) temperature dependence of the current ow when the sample is heated in short circuit after voltage applica-tion at a higher temperature and cooling with the eld still applied, i.e. thermally stimulated discharge cur-rent (TSDC) and the many possible variations thereof, and the inuence of the choice of electrode material on charge injection and conductivity.
Two other sets of data are required in order to raise the level of our understanding of the electrical proper-ties of polymer dielectrics to that of our understanding of the electrical properties of metals and semiconduc-tors. They are (i) electronic drift mobility values, over a wide range of temperature and electric eld, and (ii) the density, polarity and spatial distribution of space charge accumulating within polymer dielectric sheets subjected to dc elds at temperatures from room tem-perature upwards.
The latter is the main topic of this paper, and is discussed in sections III and IV. As a preliminary we consider electronic mobility briey.
II Electronic mobility
frequently obliterates the knee or peak in the current-time plot which is taken as marking the arrival of the leading edge of the injected carrier sheet at the dis-tant electrode. Thus mobility values can usually be obtained in this way only for very thin samples. The situation is complicated by the fact that the measured mobilities usually increase with increasing applied eld [14], whereas mobility as conventionally dened is eld-independent.
Most of the reported mobility measurements on polymers using the time-of-ight technique are for polyethylene (PE). The earliest values reported for low density polyethylene (LDPE) fall into two groups, one around 10,4cm2V,1s,1at room temperature [15,16], and the other in the range 10,10to 10,11cm2V,1 s,1 at room temperature and at 80-95oC [17,18]. The rst group of authors appear to be reporting mobilities unaf-fected by trapping. Some remarkable data of this type obtained by Gross et al. [19] for electron-beam irra-diated polytetrauoroethylene (Teon) samples should be mentioned; they observed a knee in the current-time plot as long as 10s after the 1s long electron irradiation pulse which generated the excess carriers, and deduced a eld-independent hole mobility of 210
,9 cm2V,1 s,1 at room temperature.
A variation on the time-of-ight technique was in-troduced by Fischer and Rohl [20]. They observed max-ima in current-time plots for oxidized LDPE samples at times around 103s after application of dc elds of or-der 100kV/cm. They interpreted these maxima as the transit times of charge carriers between the electrodes under a space-charge-limited-current (SCLC) regime. The calculated mobilities at 71oC were in the range 2,710
,11 cm2 V,1 s,1. Similar data for LDPE at 70oC under high pressure (15-50MPa) [21] suggest eld- and pressure-dependent electronic charge carrier mobilities in the range 510
,11to 7 10
,10cm2V,1 s,1. The temperature dependence of electron mobility in LDPE has also been reported [22] ; again an SCLC regime was assumed, and values of 4:210
,11 and 2:310
,10cm2V,1s,1 were deduced at 50 and 70oC respectively, both for an applied eld of 24kV/mm. A lower bound of 1:410
,10 cm2 V,1 s,1 for cross-linked polyethyene (XLPE), based on space charge pro-le measurements, has been suggested [23].
An alternative technique, ideally suited to the mea-surement of very low mobilities, uses the decay of charge on the surface of a dielectric, as a result of its transport into the bulk or its neutralization by other carriers
mov-ing up from the bulk [24]. The surface charge is usually generated by bringing the dielectric surface into con-tact with a metal, or exposing it to a corona discharge. This technique would be expected to yield reliable data, yet very few workers seem to have adopted it [25,26]. It may be that the diculty sometimes encountered in distinguishing between electronic and ionic carriers is regarded as too great a disadvantage. Mobility values obtained for PE using this method are 10,9 cm2V,1 s,1 for electrons at 80oC, and 2
10
,10cm2V,1 s,1 for unspecied carriers at room temperature [24].
III Space charge measurement
3.1General
In the context of dielectrics, the term \space charge" is usually taken to mean uncompensated real charge generated in the bulk of the sample as a result of (a) charge injection from the electrodes, driven by a dc eld not less than approximately 10kV/mm, (b) eld-assisted thermal ionization of impurities in the bulk of the dielectric, and (c) application of a me-chanical/thermal stress, if the material is piezoelec-tric/pyroelectric. One must also remember that a bound (or apparent) volume charge density -r P, where P is the polarization vector, will be generated by partial alignment of permanent dipolar molecules distributed through the bulk [27]. Such polarization also generates a bound surface charge P a
n, where a
n is a unit vector normal to the dielectric surface, directed outwardly. Clearly there will be no volume bound charge unless the polarization is inhomogeneous, i.e. -rP 6= 0 Charge densities accumulating in poly-meric dielectrics as a result of one or more of these processes are typically in the range 0.1 to 1 c/cm
3 [28].
It is of interest to note that space charge may ac-cumulate in a block of dielectric even if none of the three charge generating processes listed above occurs [29,30]. Specically, space charge with equilibrium den-sity=J r(=) will appear in the bulk, where J is the steady state volume current density, is the ab-solute permittivity of the dielectric (=
r
0) and is its conductivity. Clearly6= 0 provided a steady-state current is owing and=is not constant. A signicant dependence ofon temperature and electric eld is to be expected in a polymeric insulator [29]; the corre-sponding variation in
500MW XLPE-insulated cable yields space charge den-sities of order 10nC/cm3[30], about two orders of mag-nitude smaller than those commonly reported. Coelho et al. [31,32] arrive at a gure one order of magni-tude larger, based on a slightly dierent choice of cable parameters, and point out that such densities are mea-surable using state-of-the-art equipment.
3.2 Space charge measurement techniques
The evolution of space charge measurement tech-niques has been described in detail by Lewiner [33], and those now in common use have been extensively documented very recently by Ahmed and Srinivas [34]. Consequently only the techniques most frequently used at the present time will be discussed here.
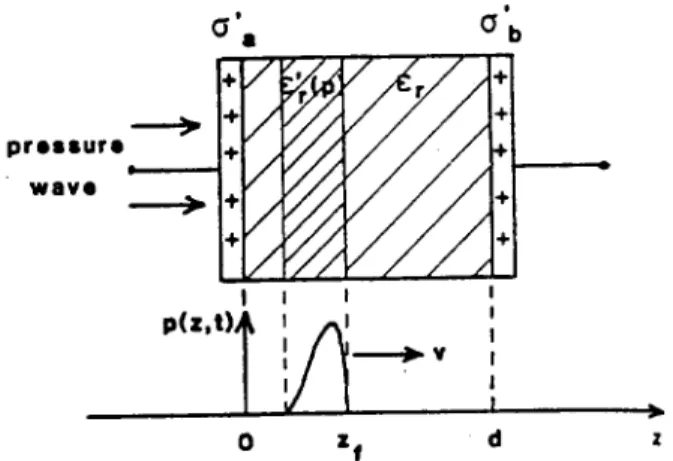
Today's successful non-destructive space charge measurement techniques are essentially adaptations and improvements of the technique introduced by Collins in the mid-1970s [35]. The common charac-teristic is a temporary, non-destructive displacment of the space charge in the bulk of the sample created by a travelling disturbance, such as a thermal or pressure wave, leading to a time-dependent change in the charge induced on the electrodes by the space charge (Fig.1).
Figure 1. Principle of the thermal/acoustic wave techniques for measuring space charge prole. The travelling wave (speed v) temporarily displaces the charge in the bulk, and changes the relative permittivity of the dielectric from
r
to r
0. The resulting changes in the charge induced on the
electrode toward which the disturbance is travelling are an-alyzed to obtain the space charge prole in the bulk. From Ref. [33].
Compression or expansion of the sample will also con-tribute to the change in induced charge on the elec-trodes, through a change in relative permittivity. The change in electrode charge is analyzed to yield the space charge distribution. (It has been shown however that
the thermal pulse technique, as originally implemented by Collins [35], yields only the rst moment of the charge distribution and its rst few Fourier coecients, since small errors (<1%) in the measured open-circuit voltage signalV(t) can cause large errors in the deduced distribution [36]). A comprehensive account of the ba-sic phyba-sics underlying the pressure wave techniques will be found in [37].
3.2.1 Thermal techniques
Two major developments of Collins' approach, also involving heating of the sample, are the laser-intensity-modulation-method (LIMM) [38] and the thermal step method [39]. In the former, both surfaces of a thin lm sample are exposed to a sinusoidally-modulated laser beam (usually red) which is heavily absorbed by the electrodes. The resulting sinusoidal variation in the temperature of the electrodes generates periodic tem-perature uctuations throughout the sample volume, which interact with the space charge to generate a py-roelectric current. This current is determined by the modulation frequency and the space charge distribu-tion; measurements are taken at several frequencies. A deconvolution procedure is required to extract the dis-tribution from the data. The best attainable spatial resolution is about 2m, but the resolution is of course much better near the sample surfaces than in the inte-rior, because of the attenuation and dispersion of the heat waves in transit. (The corresponding degradation occurs in the other techniques described below). The maximumsample thickness is determined largely by the frequency range of the lock-in amplication equipment used; with commercially available equipment operat-ing between 10mHz and 1MHz, polymeric samples with thicknesses between 1m and 2mm can be investigated, assuming a (typical) thermal diusivity value around 10,3 cm2/s.
samples, say between 2 and 20mm, because there is essentially an unlimited amount of heat available and useful data can be collected until the temperature dis-tribution across the sample has equilibrated. However the spatial resolution, about 150m, is much inferior to that of the LIMM methods. A recent paper [40] de-scribes how deconvolution can be achieved using a ma-trix inversion technique, yieding much improved spatial resolution and requiring less computation time.
3.2.2 Acoustic techniques
A temporary displacement of space charge can also be achieved using a pressure pulse in the form of a longitudinal sound wave. Such a wave is gen-erated, through conservation of momentum, when a small volume of a target attached to the sample is ab-lated following absorption of energy delivered in the form of a short laser pulse. Two laboratories de-veloped this approach, naming it the pressure-wave-propagation (PWP) method [41] and the laser-induce-pressure- pulse (LIPP) method [42]. Although these names are nowadays synonymous, implying the use of laser- generated pressure pulses, the earliest PWP re-sults were obtained using pressure pulses generated by shock wave tubes [43]. The great advantage of the LIPP (or PWP) method is that, since the pressure pulses are short (typically 5ns), the space charge prole in a poly-meric sample (speed of sound 2000m/s) can be ob-tained without deconvolution, with a spatial resolution of at worst 10% of the sample thickness, provided the sample thickness is not less than approximately 100m. Alternatively, a pressure pulse may be generated electro-acoustically by applying a short voltage pulse across the sample. The resulting electric eld exerts a force on the whole space charge distribution, thereby generating acoustic pulses over the entire sample vol-ume with pressure proportional to the local charge den-sity [44]. Those pulses propagate through the sam-ple towards both electrodes, and are detected by a grounded piezoelectric transducer attached to one of them. While deconvolution was initially required to ex-tract the space charge distribution from the transducer output, even in thin samples, the use of thin transducers based on polyvinylidene uoride has now largely elimi-nated the need for deconvolution. This method is com-monly called the pulsed-electro-acoustic (PEA) or the electrically-stimulated-acoustic-wave (ESAW) method. Assuming no instrumentation limitations, the spa-tial resolution of the acoustic techniques is, for
practi-cal purposes, the product of the pressure pulse dura-tion and the speed of sound in the sample. The pres-sure pulse duration in LIPP meapres-surements depends on the laser pulse duration, and to some extent this can be chosen to suit the sample thickness, i.e. the thin-ner the sample the shorter should be the laser pulse. Considering a PE sample with aerosol graphite elec-trodes a few m thick, a 1ns laser pulse will generate a pressure pulse of approximately 5ns duration; tak-ing the speed of sound as 2km/sec in polyethylene, we calculate a theoretical spatial resolution of 10m. In the PEA method the pressure pulse duration will equal the voltage pulse duration, but the latter is usually not less than 20ns for the 3-4kV pulse heights customar-ily employed. Consequently a theoretical resolution of about 40m is expected for polyethylene. However the thickness of the piezoelectric transducer must also be considered, since the practicable resolution improves with decreasing transducer thickness. A resolution of approximately 3m has been claimed recently for a 100m thick polyethyleneterephthalate sample [45], us-ing a 4m thick PVDF transducer, a 5ns long voltage pulse with 100-300V amplitude, an impedance match-ing circuit to reduce degradation of the voltage pulse wave form by reection, and FFT deconvolution of the output signal to compensate for the frequency charac-teristics of the transducer.
The minimum sample thickness for the acoustic techniques is around ten times the spatial resolution, and the maximum sample thickness is determined by attenuation and dispersion of the pressure pulse in tran-sit. Correction for attenuation and dispersion of the pressure pulse in transit across the specimen should be made for polymeric samples more than approximately 100m thick, but few authors do so. A suitable proce-dure has been outlined [46]. In a polyethylene sample, correction of LIPP and PEA data for attenuation and dispersion becomes inaccurate at thicknesses beyond 4-5mm. However, PEA measurements on samples more than 5mm thick have been reported [47].
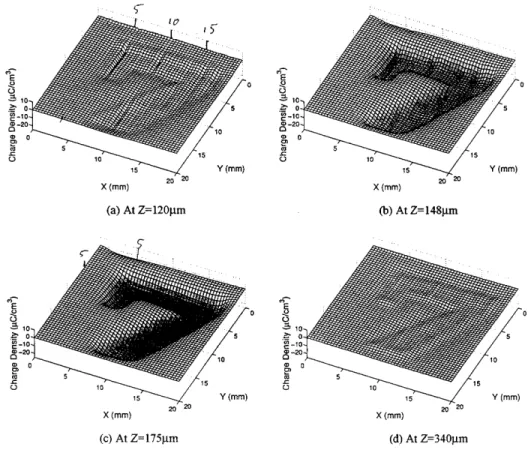
in the XY plane over an area of 2020 mm 2. The resolution in the z-direction is of course determined as described above. Data from a 0.5mmthick polymethyl-methacrylate sample, which had been exposed to an
electron beam through a lead plate in which a slot in the form of the digit 7 had been cut, provide convincing evidence of the viability of this technique (Fig.2).
Figure 2. Space charge proles in the XY plane of a 500m thick polymethylmethacrylate sample, which had been exposed
to an electron beam (200keV) through a lead plate in which a slot in the form of the digit 7 had been cut. (a) at depth 120m
below the irradiated surface (Z-direction), (b) at depth 148m, (c) at depth 175m, (d) at depth 340m. The maximum
trapped electron density was around 175m. From Ref. [48]. Of the techniques discussed above, LIPP and PEA are by far the most frequently used nowadays. The complementary nature of the LIMM and PWP tech-niques has been discussed recently [49].
IV Space charge in polymers
4.1 General
During the last fteen years or so a vast body of ex-perimental data on space charge accumulation in poly-meric materials has been published. These data, or at least those for commercially important polymers such as polytetrauoroethylene (PTFE), the copolymer uo-rinated ethylene- propylene (FEP), polyimide (PI) and polypropylene (PP) have been reviewed recently [28]. PE was deliberately omitted from that review. Since (a) space charge in PE has not been reviewed recently, (b) the topic is of considerable importance to the power
cable manufacturing industry, and (c) probably more space charge measurements have been made on PE than on any other polymer, measurements reported during the last 5-6 years are reviewed below. An excellent ac-count of the various forms of PE, its morphology and the associated manufacturing techniques will be found in [50].
4.2 PE
It is convenient to discuss low density polyethylene (LDPE), high density polyethylene (HDPE) and cross-linked polyethylene (XLPE) separately.
4.2.1 LDPE
in ac cables operating at 420kV and higher [51]. How-ever, attempts over the last 25 years to use LDPE in high voltage dc cables have been largely unsuccessful, because the accumulation of space charge in the insula-tion distorts the electric eld prole, causing the local eld strength to exceed the breakdown value at partic-ular points and so leading to cable failure.
4.2.1.1 Role of low molecular mass species
Lee et al (22( used the PEA method to investi-gate space charge accumulation, and the dependence of conductivity on applied eld and sample thickness, in three types of sample. These were single layers with dierent number-average/weight-average molecu-lar weight ratios, 2- and layer laminates, and 2- and 3-layer LDPE/(maleic anhydride-LDPE graft) laminates. The molecular weight ratios were varied by immers-ing the base LDPE in p-xylene at various temperatures between 53 and 73oC. The semiconducting electrodes were vacuum-degassed for 100hr at 80oC before being attached with a hot iron. Heterocharge was observed in all the single layer samples, with decreasing density in samples from which increasing fractions of the \low molecular mass" species had been removed (Fig.3). The term \low molecular mass species" is not specically de-ned, but appears to include very short -CH2- chains, ketonic carbonyl groups, and various types of C=C bonds. The authors concluded that the heterocharge originated mainly in the low molecular mass species. The 2- and 3-layer laminates also showed heterocharge proles very similar to those of the single layer samples, prompting the deduction that there was little charge in-jection from the electrodes. The 2-layer LDPE/LDPE graft laminates developed negative charge at the in-ternal interface when the LDPE was the cathode, the charge density decreasing as the low molecular mass species were progressively removed (Fig.4). The 3-layer LDPE/LDPE graft/LDPE laminates developed nega-tive charge at the internal interface nearer the cath-ode, and positive charge at the other interface; again the charge density decreased as the low molecular mass species were progressively removed. The steady state conduction current density and the eective carrier mo-bility also decreased when the concentration of low molecular mass species in the LDPE was reduced, sug-gesting that these species facilitate charge transport through the bulk. A dependence of the steady state current densities on (sample thickness),3, and on (ap-plied voltage)n, where 2
<n<3 at all but the lowest voltages, strongly suggested an SCLC regime.
Figure 3. Space charge proles in an LDPE sample and various residues, recorded in short circuit using the PEA method. The label L53 indicates the residue after low-molecular-mass species had been partially extracted using p-xylene at 53oC. The traces show the charge in the bulk
(mainly heterocharge) and the charge induced on the elec-trodes by the bulk charge. From Ref. [22].
Figure 4. Space charge proles in double laminate layers based on LDPE, residue and maleic anhydride- LDPE graft, recorded in short circuit using the PEA method. (a) LDPE cathode / graft anode, (b) R53 cathode /graft anode, (c) R60 cathode / graft anode, (d) R70 cathode / graft anode. R53 indicates the residue after low-molecular-mass species had been partially extracted using p-xylene at 53oC. From
4.2.1.2 Inuence of chemical modication
The eects of grafting acrylic acid and n-butyl acry-late, and blending with copolymers of ethylene and n-butyl acrylate, have been reported [52]. The base ma-terial was additive-free, and the grafting reactions were initiated using dicumyl peroxide. The samples were typically 0.7mm thick, excluding the 0.2mm semicon electrodes fabricated from ethylene-vinyl-acetate and containing carbon black and antioxidants. The elec-trodes were vacuum-degassed for 100hr at 80oC be-fore being attached to the samples. The base material showed heterocharge close to the electrodes. The den-sity of the heterocharge decreased with increasing graft ratio of acrylic acid, and homocharge developed at graft ratios around 0.135 %wt. However the density of het-erocharge in the n-butyl-acrylate grafts exceeded that in the base material at all graft ratios (maximum 0.120 %wt). It was suggested that, in the acrylic acid grafts, the heterocharge decreases because the concentration of homocharge trapped at carbonyl groups increases. An anomalous result was observed in the LDPE/n-butyl-acrylate blends, namely that heterocharge increased in the blends up to 6 %wt of the ethylene/n-butyl acry-late copolymers, although the copolymers themselves developed homocharge.
The thermal step technique has been used to study the eect of adding 5 %wt of BaTiO3[53]. The BaTiO3 particle size was<7m, and the samples were approx-imately 1.9mm thick. They were polarized for 72hr at 50oC at a eld strength around 25kV/mm, and were immersed in paran oil during polarization in order to avoid ashover. The maximum space charge den-sity (0.4C/cm
3) in the BaTiO
3-doped samples with vacuum-evaporated gold electrodes was only about 11% of the corresponding maximum in undoped samples with the same electrodes, and 27% of that in undoped samples with aluminiumelectrodes. The undoped sam-ples showed dramatic alternation in space charge po-larity across their thickness. Since previous work had shown that BaTiO3 greatly increases the conductivity of the LDPE, it was suggested that the increased con-ductivity leads to a much decreased space charge den-sity. More specically, since BaTiO3 is strongly polar, it will aect the LDPE morphology and reduce the ex-tent of charge trapping.
4.2.1.3 Inuence of
-irradiation
Chen et al [54] used the LIPP technique to obtain some interesting data on space charge formation in -irradiated LDPE plaques, 350m thick with sputtered gold electrodes. The unirradiated samples developed negative space charge adjacent to the anode, with den-sity around 0.5C/m3, after a dc eld of 60kV/mm had
been applied for 6hr. This was attributed to the migra-tion of short charged LDPE chains. Samples irradiated in the absence of an applied eld did not develop space charge; in the presence of a eld the evolution of the prole was complex, depending on the eld strength, the time for which it was applied and the absorbed dose. The prole decayed little with time when the samples, irradiated with the eld applied, were short-circuited. The authors attributed the evolving proles to structural changes in the material with increasing dose, especially radiation-induced oxidation. They pre-sented IR spectra showing a detectable concentration of C=O groups after a 50kGy dose, but concluded that C=O dipoles did not contribute to the space charge prole.
4.2.1.4 Inuence of pumping and heating
Henriksen et al. [55] investigated 1.8mm thick sam-ples with 0.1mm thick semicon electrodes. They condi-tioned them in short-circuit at 80oC for 48hr at rotary pump pressure, and then followed the development of the space charge proles when dc elds of 20kV/mm were applied at room temperature. Comparing the re-sults with those for unconditioned samples, they found that the space charge was dominated by homocharge in the conditioned samples, and by heterocharge in the unconditioned samples. Conditioning tended to reduce the space charge density. The space charge proles varied little when the samples (conditioned and un-conditioned) were short-circuited, suggesting that elec-tron transport through the bulk occurred through eld-assisted thermal hopping between localized trapping sites.
4.2.1.5 Inuence of electrodes
in the electrode order sputtered aluminium, semicon-ductive XLPE and silicone oil, while the conductivity activation energies increased in the opposite order. Ac-tivation energy as a function of applied eld increased slightly with increasing eld for sputtered aluminium and semiconductive XLPE, but decreased markedly for silicone oil. The slopes of log-log plots of current den-sity against applied eld increased from 1.0 to 2.0 around 10kV/mm, for both sputtered aluminium and semiconductive XLPE, prompting the authors to sug-gest ohmic conduction at low elds and a space-charge-limited-current (SCLC) regime at higher elds. (How-ever, the current densities at higher elds were roughly two orders of magnitude larger for the semiconduc-tive electrodes than for the sputtered aluminium elec-trodes; equal densities would be expected in samples of the same bulk material under SCLC conditions). In the case of the silicone oil contacts, the corresponding slopes were 2.13 below 10kV/mm, 1.30 between 10 and 30kV/mm, and 1.86 above 30kV/mm. No explanation of the latter observation was oered.
4.2.2 HDPE
Very little work on high density polyethylene (HDPE) has been reported, although one might expect a comparison between it, LDPE and XLPE to prove informative. Toureille and Vella [57] found signicant charge densities in 2mm thick planar samples as pre-pared, i.e. before voltage had been applied. The sam-ples were compression moulded from extruded tapes of polyethylene base resins, in order to avoid the gran-ular faces which abound in compressed pellet samples and which could complicate the space charge behaviour by acting as electron traps. (The authors do not state specically that their samples were HDPE, but quoted crystalline fractions around 80% and densities around 960 kg/m3strongly suggest that they were). Four types of sample were prepared, with molecular weights (not precisely dened) of 48000, 59000, 71000 and 100000 g/mole, and with vacuum- evaporated aluminium elec-trodes. It was found that the higher the molecular weight, the greater the space charge density before ap-plication of voltage. If a sample was cooled symmetri-cally, i.e. at the same rate on both sides, positive charge appeared close to the electrodes and negative charge in the middle. One sample was cooled asymmetrically after moulding, and the resulting space charge prole compared with that in a symmetrically cooled sample. The latter showed a space charge density in the bulk adjacent to one of the electrodes approximately three times larger than that adjacent to the other electrode. The corresponding ratio in the asymmetrically cooled sample was around 12, with the larger density adjacent
to the more rapidly cooled face. A microscopic inspec-tion of the samples showed smaller spherulites in the more rapidly cooled sample, demonstrating the inu-ence of morphology on space charge accumulation. The authors chose to apply voltage across 1mm thick sam-ples (presumably of the same HDPE) with semiconduc-tor electrodes, rather than the samples described above. Prior to voltage application, the space charge proles in these thinner samples were similar to those in the other samples. Fields between 90 and 130 kV/mm were ap-plied at 50-60oC for several hours, with the samples im-mersed in a liquid paran bath in order to avoid ash-over. The proles tended to retain the same shape as before poling, but the space charge densities increased. The results were interpreted as consistent with electron injection (presumably from the cathode) and an electri-cal conductivity gradient in the bulk following mould-ing, the conductivity being lower in the centre than at the edges.
4.2.3 XLPE
4.2.3.1 Comparison of dierent cross-linking
methods
LIPP space charge proles in XLPE cross- linked by the long-established dicumyl peroxide method, and by the more recent vinyl silane grafting method [50], have been compared [23]. Planar samples 0.5mm thick were cut from power distribution cables, and self-fusing semiconducting polymeric tape was attached to both surfaces of each sample to form electrodes. DC elds up to 10kV/mm were applied at temperatures in the range 20-90oC. In both sample types nearly all the space charge accumulated within 100m of the elec-trodes, and the densities were very similar. However, heterocharge was favoured by the samples cross-linked using dicumyl peroxide, and homocharge by the others, independent of the polarity of the applied voltage.
4.2.3.2 Eects of reversing applied voltage
po-larity
Figure 5. Space charge proles for a planar XLPE sam-ple, recorded in short circuit using the LIPP method. (a) after poling at 10kV/mm with the target electrode as the anode (b) trace (a) after approximate correction for the -nite width, dispersion and attenuation of the pressure pulse (c) corrected trace after poling at 10kV/mm with the target electrode as the cathode. From Ref. [23].
Li and Takada [59] made measurements at room temperature on 2.5mm thick XLPE sheets, with vacuum-evaporated aluminium electrodes. As-received samples contained 0.37 wt% and 0.82 wt% of acetophe-none and cumyl alcohol respectively, while for samples which had been de-gassed for 4 days at 80oC under reduced pressure, the corresponding gures were 0.02 and 0.08 wt% respectively. Initially - 80kV was ap-plied for 48hr (pre-load) across all samples. This was followed, for degassed samples, by +80kV for 24hr, -80kV for 24hr, +60kV for 24hr, -60kV for 24hr and sim-ilarly for 40kV. As-received samples were subjected to the same voltage-time pattern, except that the voltages were 80, 40 and 20kV. Homocharge was dominantin the de-gassed samples, and heterocharge in the as-received samples. Homocharge was attributed to electronic in-jection/extraction at the electrodes, and heterocharge
to ionization and transport of cross-linking byproducts. It was found that, on reversing the polarity of the plied voltage, charge of the opposite sign began to ap-pear close to the electrodes within a few minutes, but complete disappearance of the original charge took sev-eral hours. The higher the applied voltage, the shorter the time to disappearance. It is dicult to gauge from the data presented how precisely the equilibrium charge proles were inverted when the applied voltage was re-versed, but the statement that \an interesting point is that the space charge distributions have rotary symme-try characteristics under +80kV and -80kV load" sug-gests fairly accurate inversion. However, assuming that the charge in the bulk was real charge, it is dicult to envisage a mechanism by which the net charge in any given small volume of the sample in equilibrium would be precisely reversed when the polarity of the applied voltage was reversed. The authors also commented that charges were readily tranported through the bulk and across the interfaces.
Some of the Li and Takada data [59] have been an-alyzed by Alison and Hill [60]. They carried out a computer simulation of charge transport in a planar sample with metallic electrodes, and adjusted trapping and recombination parameters to obtain the best t to the experimental space charge proles. They con-centrated on the charge distribution adjacent to the electrode nearer to the piezoelectric transducer, since reection of the pressure pulse from the other electrode made it dicult to obtain adequate accuracy in that re-gion. They concluded that electron and hole injection and recombination inuence the space charge patterns signicantly. More specically, injected homocharge re-combines with trapped heterocharge (injected during application of the opposite voltage polarity) or occu-pies empty traps immediately adjacent to the injecting electrode, until all such traps are lled. Thereafter, ll-ing of traps further away from the electrode occurs un-til the eld is reduced suciently to suppress injection. Alison and Hill [60] do not comment specically on the inversion of the prole following reversal of the applied voltage. However, perusal of some of the experimental space charge proles, which they presented in conven-tional graphical format rather than the colour-coded pictorial format of Li and Takada [59], suggests that the equilibrium proles under opposite applied voltage polarities were almost mirror images of each other.
-40kV for 2hr, at room temperature. The equilibrium space charge proles, measured with the eld applied, are shown in Fig.6. It will be seen that the proles are almost mirror images of each other in the horizon-tal axis. The authors noted this inversion, but did not oer any explanation. In work on cable samples [62] using the LIPP technique, a similar reversal of prole on reversing the polarity of the applied voltage was ob-served. The proles shown in Fig.7 (a) and (b) were recorded with the sample in short-circuit. The au-thors interpreted the reversal as evidence that the space charge originated mainly in inhomogeneous polariza-tion in the sample bulk, due to an inhomogeneous spa-tial distribution of permanent dipoles. In other words, the space charge was bound charge. Assuming an indi-vidual dipole moment of 2 Debye, they estimated that a dipole concentration of at least eight dipoles per hun-dred -CH2- groups would be required in some parts of the amorphous volume of the sample. This gure is con-sistent with a much earlier estimate based on a study of the piezoelectric eect in extruded polyethylene cable insulation [63].
Figure 6. Radial space charge proles in the XLPE insula-tion of a power cable, measured with voltage applied using the PEA method. (a) after +40kV had been applied for 2hr - 1: negative surface charge induced on cathode, 2: positive surface charge induced on anode, 3: positive space charge accumulating in XLPE, 4: negative space charge accumu-lating in XLPE. (b) after -40kV had been applied for 2hr - 5: positive surface charge induced on anode, 6: negative surface charge induced on cathode, 7: negative space charge accumulating in XLPE, 8: positive space charge accumulat-ing in XLPE. From Ref [61].
Figure 7. Radial space charge proles in the XLPE insu-lation of a length of power cable, measured in short circuit using the LIPP method. The sample had been held at 82oC
for 2hr at atmospheric pressure. (a) after +54kV had been applied for 24hr (b) after -54kV had been applied for 80hr. Vertical scale (a) and (b) 0.14C/cm
3 per division. From
Ref. [62].
4.2.3.3 Inuence of pumping and heating
Wang et al [61] found that previously accumulated space charge disappeared when the sample was held in short-circuit at temperatures in the range 25-80oC for 2hr in an air oven. However the charge re-appeared when the voltage was re-applied. On the other hand, holding the samples in short-circuit at 80oC and at pres-sures around 1.3 Pa for 10 days also removed any pre-existing space charge, and prevented its re-appearance for at least 2hr when the voltage was re-applied at room temperature. This result was attributed to removal of volatile impurities and modication of the crystalline-amorphous interfaces.
if the sample was then conditioned for 2hr at 82oC and atmospheric pressure, the charge re-appeared at much the same rate as after conditioning at 82oC and atmo-spheric pressure. Elaborating on their model of bound space charge associated with a spatially inhomogeneous distribution of molecular dipoles, the authors suggested that the dipoles were formed in the amorphous regions of the samples by the combined eect of oxygen, water vapour and increased temperature, water vapour acting as a catalyst for a process equivalent to non-permanent oxidation of XLPE. The bound charge prole would be determined largely by the distribution of large volume voids, since the dipoles would be bulky. The dipoles would be destroyed by the combined eects of heating and pumping, probably through removal of oxygen.
Sanden [64] used the PEA method to investigate the eects of conditioning samples in an air-ventilated oven at 90oC for 72hr. A twin-screw extruder was used to produce tape from cable quality XLPE granules. The tapes were then pressure moulded into cup-shaped sam-ples, the planar bases being 1mm thick with Rogowski-prole edges. The electrodes were 0.5mm thick, made from semiconducting cable screen material and con-taining the same crosslinking agent (dicumylperoxide) and antioxidant (Santonox R) as the XLPE. The elec-trodes were crosslinked to the XLPE during the pres-sure moulding. Space charge proles for unconditioned and conditioned samples, subjected to dc elds in the range 20- 70kV/mm at 40oC for various times, were compared. The main conclusions were that (a) hete-rocharge formation originating in bulk processes was dominant in unconditioned samples, (b) homocharge injection from the electrodes was dominant in the con-ditioned samples at elds up to 40kV/mm, but addi-tional heterocharge slowly accumulated near the cath-ode at higher elds, and (c) the space charge densities in the conditioned samples tended to saturate after the voltage had been applied for about 3 months. The ad-ditional heterocharge in (b) was attributed to electron extraction fromlow molecularweight polyethylene (pre-sumably at the anode) and drift of the resulting positive ions towards the cathode.
4.2.3.4 Inuence of impurities
The inuence of additives and cross-linking byprod-ucts on space charge formation in XLPE has been in-vestigated by Suh et al [65]. They produced XLPE sheets from LDPE containing Santonox R antioxi-dant, and attached ethylene-vinylacetate copolymer electrodes loaded with carbon black, wax and antioxi-dant. Measurements were made at room temperature on four types of sample, as follows:
(1) Type 1, as described immediately above.
(2) Type 2, obtained by holding Type 1 material at 80oC for 100hr at reduced pressure in order to re-move cross-linking byproducts such as acetophe-none, cumyl alcohol and-methylstyrene. These samples were considered to consist of a cross-linked XLPE volume, a non-cross-cross-linked LDPE volume and antioxidant additive.
(3) Type 3, obtained by subjecting Type 2 material to chloroform extraction for 48hr under ambient con-ditions, in order to remove the antioxidant. These samples were therefore considered to consist only of cross-linked XLPE and non-cross-linked LDPE. (4) Type 4, obtained by immersing Type 3 material in boiling xylene for 48hr in order to remove the non-cross-linked LDPE. The degree of cross-linking was 86%.
The main conclusions were that (a) homocharge tends to accumulate in \pure" XLPE, and heterocharge in LDPE, (b) Santonox R prevents the formation of heterocharge in both XLPE and LDPE, and (c) cross-linking byproducts encourage heterocharge formation in XLPE. It was suggested that, since the cross-linking byproducts are believed to be low molecular weight molecules, they may readily acquire a charge and mi-grate to the appropriate electrode under the applied eld. However, no explanation was oered for hete-rocharge formation in LDPE.
4.2.3.5 Inuence of electrodes
did not reverse direction unless the electrodes were par-tially blocking, and the times at which reversal occurred placed fairly strict limits on the charge carrier mobil-ities (in the range 10,11 to 10,9 cm2 V,1 s,1). No mechanism which would render the electrodes partially blocking was suggested. The calculated mobilities were found to increase with increasing temperature, pressure and applied eld.
A study of the dependence of the dc conduction current density on applied eld, temperature and sam-ple thickness, for fresh and de-gassed semiconductive XLPE electrodes, also led to the conclusion that the conductivity is inuenced by the composition of the electrodes [56]. The samples were prepared by mix-ing dicumylperoxide and Santonox R antioxidant with LDPE (2 parts peroxide and 0.4 parts antioxidant per 100 parts LDPE), and cross-linking under pressure at 180oC for 20 mins. The degree of cross-linking was 86%, and the sample thickness varied between 30 and 100m. The electrodes were of the same XLPE, with the addi-tion of carbon black. Measurements were made in the temperature range 25-100oC, at elds between 1 and 60 kV/mm, and the current density measured 40min after application of the eld was taken as the steady state value, since it varied little thereafter. Some sam-ples were vacuum de-gassed in order to remove residual byproducts of the cross-linking reaction such as ace-tophenone, cumyl alcohol and- methylstyrene. Log-log plots of steady-state current density J against elec-tric eld E, for samples in which one or both of the XLPE and the semiconductive electrodes had not been degassed, could be divided into three regions, labelled I, II and III in order of increasing eld strength (Fig.8). In region I the slopes of the three combinations ranged between 1.7 and 2.0, suggesting an SCLC conduction regime. In region II the slopes varied from 0.4 to 1.4, while in region III a much narrower range (2.2 to 2.3) was observed. A study of the dependence ofJ on sam-ple thickness d showed J / d
,n, with
n = 3 when neither electrodes nor XLPE had been degassed, and n= 2 when one of the two had been de-gassed. It was concluded that the SCLC regime dominated the con-duction in these samples, and that de-gassing probably introduced traps.
This study was extended by comparing the steady-state current densities in samples which had (i) been boiled in xylene in order to remove uncrosslinked LDPE, antioxidant and cross-linking residues, or (ii) chloroform-extracted to remove only antioxidant and cross-linking residues. The semiconductive XLPE elec-trodes were always vacuum de-gassed. In both types of sampleJ increased steadily with increasing E, with the slopes of log-log plots showing signicant increases at
eld strengths around 5 kV/mm. These slopes were in the range 2.6 to 3.5, for temperatures between 50 and 100oC. An investigation of the dependence of
Jon sam-ple thickness again showedJ /d
,n, with
nin the range 2 to 3, for both types of sample. The authors concluded that the conduction was probably dominated by the SCLC mechanism, with a range of trap depths. They also suggested that the reductions in the slopes of the log J v log E plots observed for untreated XLPE sam-ples were due to the inuence of low molecular weight species including cross-linking residues and byproducts.
Figure 8. Current density versus applied eld characteris-tics for XLPE samples with semiconductive electrodes at 90oC. The inset species the state of the XLPE and the
semiconductive electrodes, i.e. vacuum degassed or fresh (not vacuum degassed). From Ref. [56].
4.2.3.6 Formation and transport of charge
pack-ets
but values of order 10,4 cm/sec may be deduced from the mobility values assumed in charge transport sim-ulation calcsim-ulations included in the paper. It is dif-cult to extract accurate gures from the quasi-3D charge proles, but the packets appear to be up to 1mm wide with peak charge densities as high as 5C/cm
3. These charge densities decreased in successive pack-ets. Charge packet generation and transport were also observed in 2mm thick XLPE and LDPE sheets with aluminium/semiconducting rubber electrodes. Space charge proles in untreated sheets were compared with those in (a) sheets which had been dried for 5 days at 80oC and pressures less than 1 Torr, (b) sheets which had been immersed in acetophenone (a byproduct of dicumyl peroxide cross-linking) at 25oC for 1 day, and (c) sheets treated as in (b) and then held at 150oC for 1hr. The authors suggested that the likely mechanism of charge packet generation at high applied elds was ionization of impurities such as antioxidants following solvation in acetophenone.
V Conclusions
The inuence of conditioning procedures on the accu-mulation of space charge in polymers, and the depen-dence of the space charge density on the strength, po-larity and time of application of the eld, have been extensively investigated. There appears to be general agreement that vacuum de-gassing of samples and elec-trodes favours the formation of homocharge via charge injection from the electrodes, while impurities such as cross-linking residues and byproducts lead to greater heterocharge densities. However, the chemical identi-ties of the impuriidenti-ties involved in heterocharge forma-tion are rarely determined, and quantitative data such as charge carrier mobilities, trapping and recombina-tion cross- secrecombina-tions, and the eld-dependence of the injection rates at the electrodes, are infrequently ex-tracted. Part of the reason for this is that samples are often inadequately characterized, chemically and phys-ically. In the case of commercial material, e.g. power cable insulation, this is understandable. However, more carefully designed experimental sequences attempting to isolate a single experimental variable, e.g. a compar-ison of space charge proles in samples of the same poly-mer but with dierent electrode materials, would allow more detailed conclusions to be drawn with condence. Another important point is that space charge data are rarely collected at temperatures other than room tem-perature. LIPP measurements on heated samples are generally not any more dicult at elevated tempera-tures than at room temperature, and the use of lithium
niobate as a piezoelectric detector, with a stable re-sponse up to at least 120oC, should permit PEA mea-surements over a wide temperature range. Computer simulation of charge injection, transport and trapping is now readily achieved, and should be carried out in parallel with laboratory measurements. As always, the information which can be extracted from a single ex-perimental technique, even one as powerful as LIPP or PEA, should be conrmed as far as possible with other forms of experimental data, e.g. thermally stimulated conductivity and discharge.
Acknowledgments
I wish to thank Professors Guilherme Leal Ferreira, Roberto Faria and Reimund Gerhard-Multhaupt for their kind invitation to contribute to this special is-sue in honour of Professor Bernhard Gross. I rst met Bernhard in Miami in October 1972, at what was in eect the 2nd International Symposium on Electrets, although it went under another name at the time. I got to know him much better during the latter half of 1978, when we were both working as consultants at the then Bell Telephone Laboratories, Murray Hill, New Jersey.
Most of this paper was written while I was a guest Professor in the Department of Electric Power Engi-neering of the Technical University of Denmark. I wish to thank my hosts there for their unfailing hospitality, and the Tranes Foundation for nancial support.
References
1 R.M. Fuoss, J. Amer. Chem. Soc.63, 369 (1941).
2 J.F. Fowler and F.T. Farmer, Nature,175, 590 (1955).
3 J.F. Fowler, Proc. Roy. Soc. London, A236, 464 (1956).
4 B. Gross, J. Appl. Phys. 36, 1635 (1965).
5 B. Gross and M.M. Perlman, J. Appl. Phys. 43, 853
(1972).
6 B. Gross, G.M. Sessler and J.E. West, J. Appl. Phys.
45, 2841 (1974).
7 L. Nunes de Oliveira and B. Gross, J. Appl. Phys.46,
3132 (1975).
8 B. Gross, Radiation-Induced Charge Storage and Po-larization Eects, Ch.4 inElectrets,(Topics in Applied Physics, 33) ed. G.M. Sessler, Springer-Verlag, Berlin, 1980.
9 R. Gregorio Filho, B. Gross and R.M. Faria, IEEE Trans.Elec.Insul. EI-21, 431 (1986).
10 R. Hessel and B. Gross, IEEE Trans. Elec. Insul. EI-27,
831 (1992).
12 D.K. Das-Gupta, IEEE Trans. Diel. Elec. Insul.4, 149
(1997).
13 W.E. Spear, J. Non-Cryst. Solids,1, 197 (1969).
14 (a) B.G. Bagley, Solid State Comms.8, 345 (1970); (b)
R. Nath and M.M. Perlman, J. Appl. Phys. 65, 4854
(1989).
15 D.K. Das-Gupta and T. Noon, J. Phys. D: Appl. Phys.
8, 1333 (1975).
16 T. Tanaka and J.H. Calderwood, J. Phys. D: Appl. Phys.7, 1295 (1974).
17 H.J. Wintle, J. Appl. Phys.41, 4004 (1970).
18 E.H. Martin and J. Hirsch, J.Non-Cryst. Solids,4, 133
(1970).
19 B. Gross, G.M. Sessler, H.von Seggern and J.E. West, Appl. Phys. Lett.34, 555 (1979).
20 P. Fischer and P. Rohl, Progr. Colloid & Polymer Sci.
62, 149 (1977).
21 D. Malec, V.H. Truong, R. Essolbi and T.G. Hoang, IEEE Trans. Diel. Elec. Insul.5, 301 (1998).
22 S.H. Lee, J-K Park, C.R. Lee and K.S. Suh, IEEE Trans. Diel. Elec. Insul.4, 425 (1997).
23 K.R. Bambery and R.J. Fleming, IEEE Trans. Diel. Elec. Insul. 5, 103 (1998).
24 D.K. Davies, (a) Institute of Physics (UK) Conf. Ser. No. 4, Static Electrication, 1967, p.29; (b) J. Phys. D: Appl. Phys.5, 162 (1972).
25 T.J. Sonnonstine and M.M. Perlman, J. Appl. Phys.
46, 3975 (1975).
26 M.M. Perlman, T.J. Sonnonstine and J.A. St. Pierre, J. Appl. Phys.47, 5016 (1976).
27 M.N.O. Sadiku,Elements of Electromagnetics, Oxford University Press, New York, 2nd Edition, 1995, p.195. 28 G.M. Sessler, IEEE Trans. Diel. Elec. Insul. 4, 614
(1997).
29 I.W. McAllister, G.C. Crichton and A. Pedersen, Con-ference Record 1994 IEEE Inter. Symp. Elec. Insul. p.212.
30 I.W. McAllister, G.C. Crichton and A. Pedersen, Con-ference Record 1996 IEEE Inter. Symp. Elec. Insul. p.661.
31 R. Coelho, B. Aladenize and F. Guillaumond, IEEE Trans. Diel. Elec. Insul.4, 477 (1997).
32 B. Aladenize, R. Coelho, F. Guillaumond and P. Mire-beau, J. Electrostatics,39(4), 235 (1997).
33 J. Lewiner, IEEE Trans.Elec.Insul. EI-21, 351 (1986). 34 N.H. Ahmed and N.N. Srinivas, IEEE Trans. Diel. Elec.
Insul.4, 644 (1997).
35 R.E. Collins, (a) Appl Phys Letters,26, 675 (1975) (b)
J. Appl. Phys.48, 4804 (1976).
36 H. von Seggern, Appl. Phys. Letters,33, 134 (1978).
37 R. Gerhard-Multhaupt, (a) Phys. Rev. B, 27, 2494
(1983) (b) Ferroelectrics,75, 385 (1987).
38 (a) S.B. Lang and D.K. Das-Gupta, J. Appl. Phys.
59, 2151 (1986) (b) S.B. Lang, Ferroelectrics,118, 343
(1991).
39 A. Cheri, M. Abou Dakka and A. Toureille, IEEE Trans. Elec. Insul.EI-27, 1152 (1992).
40 M. Abou Dakka, S.S. Bamji and A.T. Bulinski, IEEE Trans.Diel.Elec.Insul. 4, 314 (1997).
41 C. Alquie, G. Dreyfus and J. Lewiner, Phys. Rev. Let-ters,47, 1483 (1981).
42 G.M. Sessler, J.E. West and G. Gerhard, Phys. Rev. Letters,48, 563 (1982).
43 P. Laurenceau, G. Dreyfus and J. Lewiner, Phys. Rev. Letters, 38, 46 (1977).
44 (a) Y. Li, M. Yasuda and T. Takada, IEEE Trans. Diel. Elec. Insul. 1, 188 (1994) (b) P. Morshuis and
M. Jeroense, IEEE Elec. Insul. Magazine, 13(3), 26
(1997).
45 T. Maeno and K. Fukunaga, IEEE Trans. Diel. Elec. Insul.3, 754 (1996).
46 T. Ditchi, C. Alquie and J. Lewiner, J. Acoust. Soc. Am.94, 3061 (1993).
47 J.B. Bernstein and C.M. Cooke, IEEE Trans. Elec. In-sul.EI-26, 1080 (1991).
48 X. Qin, K. Suzuki, M. Sazaki, Y. Tanaka and T. Takada, Proc.6th Int.Conf. on Conduction and Break-down in Solid Dielectrics, IEEE Dielectrics and Elec-trical Insulation Society, Vasteras, Sweden, June 1998, p.13.
49 C. Boue, C. Alquie and D. Fournier, Ferroelectrics,
193, 175 (1997).
50 A. Barlow, IEEE Elec. Insul. Magazine,7(1), 8 (1991).
51 M.S. Khalil, IEEE Elec. Insul. Magazine, 13(6), 35
(1997).
52 K.S. Suh, C.R. Lee, Y. Zhu and J. Lim, IEEE Trans. Diel. Elec. Insul.4, 681 (1997).
53 M.S. Khalil, A. Cheri, A. Toureille and J-P. Reboul, IEEE Trans. Diel. Elec. Insul.3, 743 (1996).
54 G. Chen, H.M. Banford and A.E. Davies, IEEE Trans. Diel. Elec. Insul.5, 51 (1998).
55 M. Henriksen, J.T. Holbll and R.J. Fleming, inSpace Charge in Solid Dielectrics,ed. J.C. Fothergill and L.A. Dissado, The Dielectrics Society, 1998, p.235.
56 K.S. Suh, C.R. Lee, J.S. Noh, J. Tanaka and D.H. Da-mon, IEEE Trans. Diel. Elec. Insul.1, 224 (1994).
57 A. Toureille and N. Vella, inSpace Charge in Solid Di-electrics, ed. J.C. Fothergill and L. A. Dissado, The Dielectrics Society, 1998, p.59.
58 T.J. Lewis, IEEE Trans. Elec. Insul.EI-21, 289 (1986).
59 Y. Li and T. Takada, J. Phys. D: Appl. Phys.25,
704-716 (1992).
60 J.M. Alison and R.M. Hill, J. Phys. D: Appl. Phys.27,
1291 (1994).
61 X. Wang, D. Tu, T. Muronaka, T. Takada, C. Shinoda and T. Hashizumi, IEEE Trans. Diel. Elec. Insul. 2,
62 F.N. Lim, R.J. Fleming and R.D. Naybour, Proc 3rd Inter. Conf. on Electric Charge in Solid Insulators, Tours, France, June-July 1998, ed. G.Damamme, Soci-ete Francaise du Vide, pp. 329-338.
63 R.W. Greaves, E.P. Fowler, A. Goodings and D.R. Lamb, J. Materials Sci.9, 1602 (1974).
64 B. Sanden, in Space Charge in Solid Dielectrics, ed.
J.C. Fothergill and L.A. Dissado, The Dielectrics
Soci-ety, 1998, p.225.
65 K.S. Suh, S.J. Hwang, J.S. Noh and T. Takada, IEEE Trans. Diel. Elec. Insul.1, 1077 (1994).
66 D. Malec, R. Essolbi, H. The-Giam, Bui-Ai and B. Gar-ros, IEEE Trans. Diel. Elec. Insul.3, 64 (1996).