409
REM: Int. Eng. J., Ouro Preto, 69(4), 409-416, oct. dec. | 2016Ulisses Miguel Correia Doutorando
Universidade Estadual de Campinas - UNICAMP Departamento de Geologia e
Recursos Naturais do Instituto de Geociências Campinas - São Paulo - Brasil
Alessandro Batezelli Professor Doutor
Universidade Estadual de Campinas - UNICAMP Instituto de Geociências
Campinas - São Paulo - Brasil [email protected]
Emilson Pereira Leite Professor Doutor
Universidade Estadual de Campinas- UNICAMP Instituto de Geociências
Campinas - São Paulo - Brasil [email protected]
3-D Geological modelling: a
siliciclastic reservoir case study
from Campos Basin, Brazil
Abstract
Reservoir static modelling plays a fundamental role in the evaluation phase of a petroleum ield. Integrated modelling allows a better understanding of how the local geology and depositional systems are related through the distribution of facies and petrophysical properties within the reservoir. In this study, geological static models of the siliciclastic Carapebus Formation of Campos Basin were built using subsur-face data. The applied methodology was divided into ive phases: (1) establishment of a conceptual model, (2) building of a structural model, (3) generation of 100 re-alizations of lithofacies using sequential indicator simulation, (4) generation of 100 realizations of porosity and permeability using sequential Gaussian simulation, and (5) validation of models by targeting both statistical and geological consistency. The obtained models are consistent and honor the conditioning data. A lithofacies con-straint is crucial to better characterize the petrophysical properties distribution of the reservoir. A Dykstra-Parsons coeficient of V=0.52 characterizes this reservoir as moderately homogeneous.
Keywords: Campos Basin, Siliciclastic Reservoirs, Carapebus Formation, Static Modelling.
Geosciences
Geociências
http://dx.doi.org/10.1590/0370-44672015690063
1. Introduction
The geological models, often called reservoir static models, play an essential role in the understanding of intrinsic spatial characteristics and features of the reservoirs. These models have been im-portant to predict reservoir performance because they incorporate several informa-tion, such as static petrophysical proper-ties within the stratigraphic layers and structural framework. Static models are also used to predict inter-well distributions of relevant properties, such as porosity and permeability. Furthermore, static reservoir models are improved through an iterative process in order to better quantify and assess uncertainty.
Cosentino (2001) and Deutsch (2002) point out that it is necessary to create consistent 3-D geological models.
Additionally, these authors suggest the application of geostatistical algorithms of sequential simulation, such as Gaussian and indicator to conduct the modelling process. Whereas sequential indicator simulation is suitable for categorical vari-ables, the sequential Gaussian simulation is applied to continuous variables.
Ravenne (2002) and Remacre et al. (2008) emphasize that proportion curves are powerful tools for reservoir charac-terization, because they provide a better understanding on how the facies propor-tions vary within and between the wells with respect to a stratigraphic datum. Furthermore, these authors highlight that petrophysical properties should be con-strained to facies proportions in order to get a better estimate of the petrophysical
distributions.
Dykstra and Parsons (1950) devel-oped a criterion for quantifying reservoir heterogeneity based on the permeability distribution and the well-known coefi-cient of variation. Dykstra-Parsons coef-icient takes values between 0 and 1 and, for most reservoirs this coeficient ranges between 0.5 and 0.9, from homogenous to heterogeneous.
Understanding the heterogeneities of the main reservoirs of the Campos Basin (Brazil), far from being a mature basin, has still been a challenge.
This study aims at building a 3-D geological model of the turbidite reservoir of the Carapebus Formation in the Cam-pos Basin, in order to better understand and characterize reservoir heterogeneities.
2. Case study: Carapebus siliciclastic reservoir
2.1 Campos Basin setting
Campos Basin lies between the updip limits of the turbidites to the
west, the Vitoria-Trindade Arch to the north, the Cabo Frio Arch to the
m to the east. The basin is approxi-mately 500 km long and 150 km wide encompassing nearly 120,000 km2 of
the Brazilian southeast offshore. It reaches up to 3,400 m of water depth.
Based on a compilation of previ-ous works on Campos Basin, Winter et al. (2007) divide its stratigraphic evolution into ive main chronostrati-graphic megasequences, from early Cretaceous to Tertiary, as follows: (1) continental megasequence with three
sin-rift phases where the irst and the second are characterized by eolian and alluvial fan deposits, and the third is characterized by extensive strata of coquinas, calcarenites, calcilutites and shales; (2) evaporitic transitional megasequence with conglomerates and sandstones, followed by the formation of an evaporitic sea in the southern part of the basin; (3) shallow carbonate platform which developed most of the basin’s shallow
carbon-ates; (4) transgressive marine mega-sequence composed by calcilutites, marl and shales; this transgressive megasequence registered a gradual increase in depth recorded by the de-position of deep water turbidites; and (5) regressive marine megasequence where a modification in the sedi-mentation regime occurred, with the development of deltaic, luvio-deltaic, terrigenous and carbonate platform depositional systems.
2.2 Carapebus reservoir description
According to Bruhn et al. (1998), the studied reservoir is part of the silici-clastic Carapebus Formation of Campos Group in Campos Basin. The age of the studied section of this reservoir ranges from Oligocene to Miocene. It was de-posited by several turbiditic events in a regressive marine megasequence of deep water unconined depositional systems
(water depths between 1,000 to 2,000 m), deining unconined sand lobes. In terms of grain size, medium to coarse sand are predominant. Porosity reaches 35% and permeability ranges roughly from 1,000 to 2,500 mD in the producing intervals, consisting of the most proliic turbidite reservoirs in the basin.
Bruhn (2001) measured porosity
and permeability of core samples which allowed distinguishing two deposits in the Carapebus Formation reservoir both from Oligocene-Miocene. The author obtained porosity and permeability values of (1) 32% and 574 mD for thicker and poorly sorted deposits, and of (2) 26% and 2,434 mD for thinner and moderately well sorted deposits.
2.3 Data set
The data set was provided by the Brazilian National Agency of Petroleum, Natural Gas and Biofuels
(ANP), and was comprised of four wells and eight 2-D seismic lines (Fig-ure 1). All wells included gamma ray,
density, sonic and resistivity logs, and descriptions of cores from two wells were available.
Figure 1
Data set location: study area is limited by
the polygon (black), 2D seismic lines (grey), and wells (black symbols).
3. Method
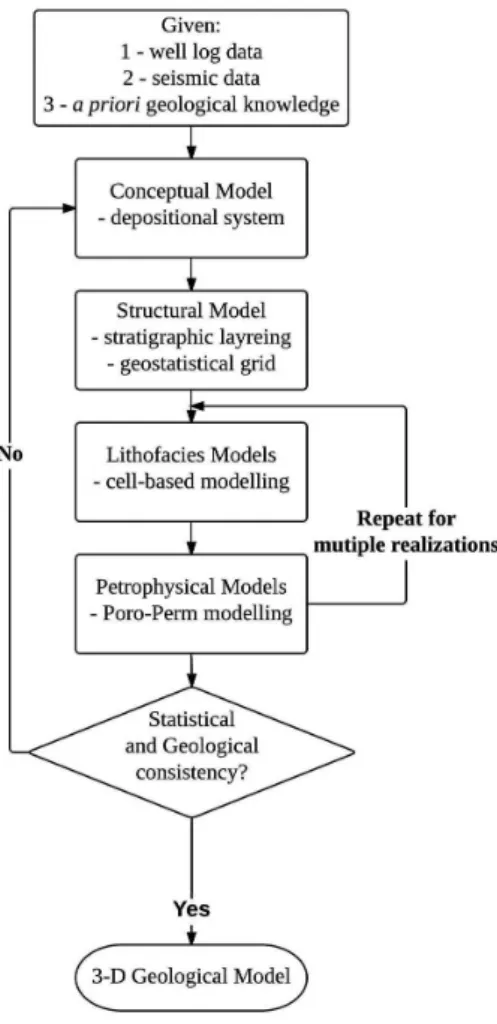
To conduct the 3-D geological modelling, the method proposed by Cosentino (2001) and Deutsch (2002) was applied using an academic license of Petrel 2013.1 software. It is a work-low where stratigraphy constrains the geostatistical grid geometry, which in turn supports the modelling (Figure 2). It comprises ive phases:
Phase 1: Development and estab-lishment of a consistent conceptual model emphasizing the depositional system, in order to identify the main expected scales and heterogeneities.
Phase 2: Structural modelling considering the stratigraphic layering, in order to get a suitable geostatistical grid which incorporates well-known
heterogeneities, and has an adequate size estimated based on the computa-tional power available. Well formation tops and interpreted seismic surfaces are used to deine the vertical boundaries of the layers, while fault structures deine lateral boundaries.
es-411
REM: Int. Eng. J., Ouro Preto, 69(4), 409-416, oct. dec. | 2016 Figure 23-D geological modelling flow chart.
4. Application
The ideal conceptual model used to guide the modelling phase was the unconined sand lobes deined by Bruhn et al. (1998).
Top and base reservoir surfaces were interpreted from the available seismic data, based on concepts of seis-mic stratigraphy and geomorphology (see e.g. Posamentier & Kolla, 2003).
Time-to-depth conversion was made using a simple layer cake velocity model built with well checkshots.
To establish lithofacies, a logic func-tion was applied to gamma ray logs, dis-tinguishing three main lithofacies: shale, sandstone and marl. These were derived from core samples which 12 well lithot-ypes were identiied and then resampled
to three representative lithofacies. The log-derived porosity was calcu-lated from the bulk density log based on Asquith & Gibson (1982) equation. For this calculation, it was considered that the siliciclastic rocks do not have signiicant shale content in their composition (lower than 15% within reservoir intervals). The used equation is deined as follows: tablished stratigraphic layer, using the
sequential indicator simulation algo-rithm. This should be performed for a number of realizations to ensure stabil-ity of the variance of the models. This geostatistical simulation uses vertical proportion curves taking into account facies distributions along stratigraphic layers (e.g. Ravenne, 2002; Remacre et al., 2008).
Phase 4: Petrophysical model-ling of porosity and permeability for each lithofacies realization, using the sequential Gaussian simulation algo-rithm. For the permeability modelling it might be necessary to develop a porosity-permeability transforma-tion (Phi-K) from core data, in order to get a permeability log in uncored intervals. Therefore, this implies
that permeability will follow the porosity distribution.
Phase 5: Validation of the models based on statistical and geological consistency. This validation is car-ried out by analyzing the statistical parameters of the simulated and origi-nal distributions and by comparing overall results to those available in the literature.
total porosity =
matrix density - density log
matrix density - fluid density
where, for this study, matrix density = 2.644 g/cm3 and luid density = 1.025 g/cm3.
The log-derived permeability curve was itted using core data and it reads as follows:
where, for this study, a correlation coef-icient of r = 0.82 was obtained.
The constructed geostatistical grid is a corner point with 2.5 million cells, deined by 400 x 400 m in the horizon-tal directions and 1.5 m in the vertical direction, with 123x121 cells and 170 cell layers.
It was required to upscale the mod-elled properties to the grid resolution us-ing averagus-ing methods: (1) for lithofacies, the “most of” was applied, (2) for the
log-derived porosity, the arithmetic mean was applied, and (3) for the log-derived permeability, the geometric mean was applied (see e.g. Durlofsky, 2005).
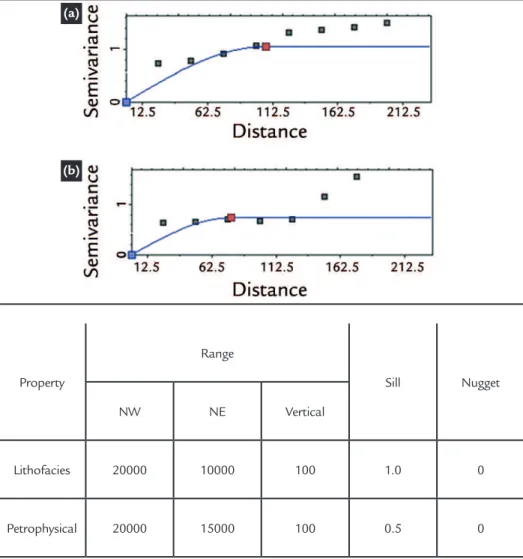
A structural analysis was carried out with the aid of experimental vario-grams. These variograms were computed along two horizontal directions, NW and NE and the vertical direction, as they are well-known as major Campos Basin’s turbidite deposition (Figure 3). It is pos-sible to verify the degree of uncertainty
in variograms owed to the lack of data. The spherical model was adopted for both lithofacies and petrophysical modelling, even if the proximity of data points to the origin was not linear. It was possible to infer that for the vertical direction, both properties are characterized by a high variability, and the data points of experi-mental variograms are distantly spaced. Table 1 shows the variogram parameters for the itted models of lithofacies and petrophysical properties.
Figure 3
Experimental (dots)
and modelled (curve) vertical
variograms: a - lithofacies; b - petrophysics.
Property
Range
Sill Nugget NW NE Vertical
Lithofacies 20000 10000 100 1.0 0
Petrophysical 20000 15000 100 0.5 0 Table 1Variogram model parameters for
lithofacies and petrophysical properties.
For the lithofacies modelling, 100 realizations of the sequential indicator simulation algorithm were performed. For the petrophysical models, 100 realizations of the sequential Gaussian simulation were performed, conditioned by the lithofacies models. Permeability was co-simulated with porosity as a secondary property by applying collocated co-kriging. A locally varying correlation coeficient from
poros-ity was used, assigning one value for each grid cell.
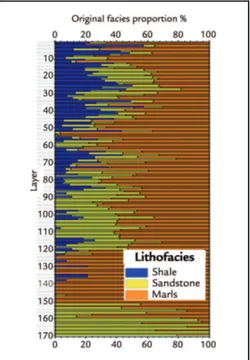
The global vertical proportion curve includes high percentages of marl, but low percentages of sandstone and shale. Em-phasis can be given to the top and central layers (10 to 50 and 80 to 120), deined by 50% to 70% of sandstone facies. These heterogeneities were characterized by a total of 170 stratigraphic layers with
thick-ness of 1.5 m each, in order to capture the vertical variation of the well logs (Figure 4).
According to Bruhn et al. (1998) and Machado et al. (2004), lobes deposited over several time events are a common feature of this reservoir in proximal areas.
The heterogeneity of this reservoir was quantiied by calculating the Dykstra-Parsons coeficient of permeability varia-tion, as follows:
V
=
Log (K)
50- Log (K)
84.1Log (K)
50where Log(K)50 - permeability mean; Log(K)84.1 - mean plus one standard deviation.
(a)
413
REM: Int. Eng. J., Ouro Preto, 69(4), 409-416, oct. dec. | 2016 Figure 4Global vertical proportion curve of lithofacies.
5. Results and discussion
One example of equiprobable realization of the obtained lithofacies and petrophysical models is shown in Figures 5 to 7.
Figure 5 Lithofacies model realization #37.
Figure 6 Porosity model realization #37.
The facies proportions obtained in the lithofacies models were in accordance with the global vertical proportion curve. The simulated proportion for the shale was 14%, for the sandstone was 26% and for the marl was 60% (Table 2).
The value of log-derived porosity
averages 25% and ranges from 0% to 40%. The simulated value averages 25% and ranges from 10% to 36% (Table 3).
Core-measured permeability ranges from 107 to 864 mD, the simulated log ranges from 51 to 610 mD and the geo-metric mean is 271 mD (Table 4).
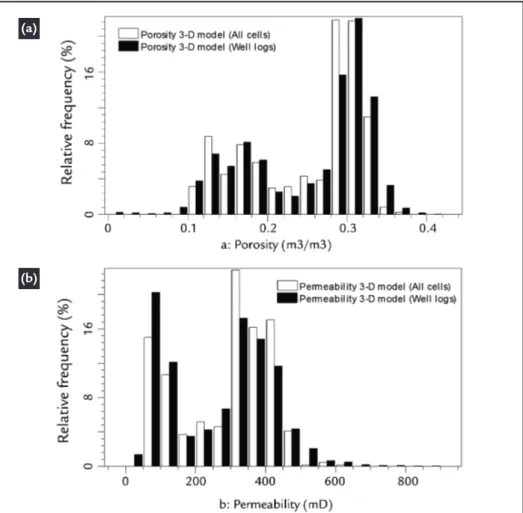
Both porosity and permeability are characterized by a bi-modal distribution. These bi-modal distributions helped to distinguish between reservoir and non-reservoir potential facies. By having bi-modal distributions, careful analysis of the descriptive statistics is required.
Table 2
Original lithofacies, simulated proportions and difference (delta) between proportions over 100 realizations.
Lithofacies models Original proportion (%) Simulated proportion (%) Delta (%) Shale 15.3 13.9 -9.2 Sandstone 25.9 26.1 0.8 Marl 58.8 60.0 2.0
Table 3
Descriptive statistics
of porosity from the well log data and from the 3-D model over 100 realizations.
Porosity (%) Min Max Mean Standard deviation Delta mean (%) 3-D models 9.9 36.3 24.7 7.3
-1.2 well logs 0.0 40.0 25.0 8.0
Table 4
Descriptive statistics of permeability from the well log data and from the 3-D model over 100 realizations.
Permeability
(mD) Min Max Mean Standard deviation Delta mean (%) 3-D models 51 610 271 138
1.5 well logs 20 898 267 148
Differences between original and simulated distributions are presented in Figures 8 and 9. These differences are caused by the employed upscaling proce-dure and by the spatial density of the data. For the proportions of the lithofacies models, there were differences of -9.2% for shale, +0.8% for sandstone, and +2.0%
for marl. For the mean of the porosity models, there was a difference of -1.2%. For the mean of the permeability models, there was a difference of +1.5%.
It is possible to assess the bi-modal distributions of the petrophysical param-eters by considering different sources of the turbidite depositional system, which
comprises at least ive different main fea-tures. According to Bruhn (2001) those features are: (1) complex external geom-etry, (2) ine-muddy interbedded deposits, (3) discontinuous calcitic concretions, (4) cemented sandstones and conglomerates, and (5) porosity and permeability varia-tion with deposits grain size and sort.
Figure 8
415
REM: Int. Eng. J., Ouro Preto, 69(4), 409-416, oct. dec. | 2016 Figure 9Histogram reproduction on realization #37. a - porosity; b - permeability. Black bars: original histogram. White bars: simulated histogram.
It was possible to compare the porosity and permeability results with those achieved by Bruhn (2001) in core samples of Oligocene-Miocene. Com-paring these results with the thicker deposits presented in Bruhn (2001), the porosity obtained in this study is 22% lower and the permeability is 6% higher. Comparing with the thinner deposits, the porosity obtained is 5% lower and the permeability is 74% lower.
Dykstra-Parsons coeficient of per-meability variation for sandstone lithofa-cies of the studied reservoir is V=0.52. This coeficient points to a moderately ho-mogeneous reservoir. The obtained coef-icient is equal to that calculated by Dutton et al. (2003) for a deep water siliciclastic case study from Ramsey reservoir in the East Ford ield. Moreover, this coeficient
is within the range of most reservoirs. The results of several studies show that these turbidite deposits have different types and can be fairly complex. In ad-dition, these reservoirs are distinguished based on their grain size, net-to-gross ratio, external geometry, processes and depositional settings (Bruhn et al., 2003; Machado et al., 2004).
This study has two main limitations: (1) the low data density and the data distribution, which affected directly the variogram modelling, and (2) Phi-K trans-formation, knowing that the permeability does not follow the porosity distribution.
As pointed by Chambers et al. (2000), in a situation with lacking data, the parameters chosen in the sequential indicator simulation and sequential Gauss-ian simulation algorithms certainly impact
the results.
Despite these limitations, the histo-grams of the simulated values reproduce those of the original values within an ac-ceptable error level. Therefore, by applying the Cosentino (2001) and Deutsch (2002) methodology for integrated reservoir stud-ies it was possible to infer the relationships between geology and depositional systems of this reservoir.
The observed differences between simulated and original distributions might be straightforwardly assigned to the sparse data set used to perform the geological modelling in this study. Additionally, these differences may also be assigned to the change-of-support effect, produced by distinct size support of data set and model grid; and the smoothing character of the kriging algorithm.
6. Conclusions
The main conclusions of this study are: 1. The obtained models reveal geologi-cal and statistigeologi-cal consistency, with tolerable statistical variations.
2. The geostatistical model grid plays a major role in deining the vertical layering of the global vertical proportion curve.
3. Lithofacies models show minor
differences between original and simulated proportions (lower than 10%).
4. Petrophysical models conditioned to lithofacies presents very low differences with respect to the original distributions (1.2% for porosity and approximately 1.5% for permeability).
5. Lithofacies constraints are
essen-tial to an improved characterization of the distribution of petrophysical properties in the reservoir.
6. Phi-K transformation outlines the permeability models statistical outputs be-cause it assumes a linear correlation with the porosity distribution.
Generating lithofacies models is
(a)
8. References
ASQUITH, G. B., GIBSON, C. R. Basic well log Analysis for geologists. Oklahoma, Tulsa: AAPG, 1982. 216p.
BRUHN, C. H. L. Contrasting types of Oligocene / Miocene Giant Turbidite Reser-voirs from deep water Campos Basin, Brazil. In: AAPG Distinguished Lecture, 2001.
BRUHN, C. H. L., BARROSO, A. S., LOPES, M. R. F., SARZENSKI, D. J., ABREU, C. J., SILVA, C. M. A. High-resolution stratigraphy and reservoir heterogeneities of upper Albian Turbidite Reservoirs of Albacora Field, Campos Basin, Offshore Bra-zil. In: AAPG ANNUAL CONVENTION. Salt Lake City, Utah: AAPG, 1998. BRUHN, C. H. L., GOMES, J. A. T., LUCCHESE JR, C. D., JOHANN, P. R.
Cam-pos basin: reservoir characterization and management – historical overview and fu-ture challenges. OTC 15220. In: OFFSHORE TECHNOLOGY CONFERENCE, Society of Petroleum Engineers, Houston, Texas, USA. 2003.
CHAMBERS, R. L., YARUS, J. M., HIRD, K. B. Petroleum geostatistics for nongeos-tatisticians – Part 2. The Leading Edge, v. 19, n. 6, p. 592-599, 2000.
COSENTINO, L. Integrated reservoir studies. Paris: Editions Technip, 2001. 310p. DEUTSCH, C. V. Geostatistical reservoir modeling. In: Applied Geostatistics Series.
New York: Oxford University Press, Inc, 2002. 376pp.
DURLOFSKY, L. J. Upscaling and gridding of ine scale geological models for low simulation. In: 8TH INTERNATIONAL FORUM ON RESERVOIR SIMULA-TION. Stresa, Italy: Iles Borromees, June 20-24, 2005.
DUTTON, S. P., FLANDERS, W. A., BARTON, M. D. Reservoir characterization of a Permian deep-water sandstone, East Ford ield, Delaware basin, Texas. AAPG Bulletin, v. 87, n. 4. p. 609-627. 2003.
DYKSTRA, H., PARSONS, H. L. The prediction of oil recovery by waterlooding. In:
Secondary Recovery of Oil in the United States. (2nd Ed.). New York: API, 1950. p. 160-174.
MACHADO, L. C. R., KOWSMANN, R. O., ALMEIDA JR., W., MURAKAMI, C. Y., SCHREINER, S., MILLER, D. J., ORLANDO, P., PIAUILINO, V. Geome-tria da porção proximal do sistema turbidíticos moderno da Formação Carapebus, bacia de Campos; modelo para heterogeneidades de reservatório. Boletim de Geo-ciências da Petrobras, v. 12, n. 2, p. 287 – 315, maio./nov. 2004.
POSAMENTIER, H. W., KOLLA, V. Seismic geomorphology and stratigraphy of depositional elements in deep-water settings. SEPM Journal of Sedimentary Rese-arch, v. 73, n. 3, p. 367–388, 2003. doi: 10.1306/111302730367
RAVENNE, C. Stratigraphy and oil: a review. Part 2 - characterization of reservoir and sequence stratigraphy: quantiication and modeling. Oil & Gas Science and Technology – Rev. IFP, v. 57, n. 4, p. 311-340, 2002. doi: 10.2516/ogst:2002021 REMACRE, A. Z., NORMANDO, M. N., SANCEVERO, S. S. Krigagem das
pro-porções utilizando a krigagem da média: uma ferramenta auxiliar na modelagem de reservatórios. Revista Brasileira de Geociências, v. 38, n. 1 – suplemento, p. 82-77, 2008.
WINTER, W. R., JAHNERT. R. J., FRANÇA, A. B. Bacia de Campos. Boletim de Geociências da Petrobras, v. 15, n. 2, p. 511-529, maio/nov. 2007.
Received: 27 April 2015 - Accepted: 4 July 2016.
7. Acknowledgements
The authors gratefully acknowl-edge Coordination for the Improvement of Higher Education Personnel (CAPES) for the M.Sc. scholarship, the Brazilian
National Agency of Petroleum, Natural Gas and Biofuels (ANP) for the provided data set, and Schlumberger for provid-ing Petrel software academic license.
The authors would also like to thank the Department of Geology and Natural Resources of the University of Campi-nas for institutional support.
essential for properly characterizing the reservoir, due to its relationship with the petrophysical properties distribu-tion. Geological consistency needs to be assessed and validated over an iterative
process of producing and itting mod-els, considering that these are digital representations of a highly complex physical reality.
For further work it is