451 REM: Int. Eng. J., Ouro Preto, 69(4), 451-457, oct. dec. | 2016
Metallurgy and materials
Metalurgia e materiais
Analysis of precipitate
density of an aluminium
alloy by TEM and AFM
Abstract
The quantiication of nanometric precipitates in Al-Zn-Mg-Cu alloys has been performed by a series of experimental techniques. Especially in the AA7050 alloy, after ageing heat treatment, the particles responsible for the hardening become very thin. Typically, these precipitates of nanometric sizes are mainly characterized by transmission electron microscopy (TEM), which in this particular case, requires a very meticulous preparation. This study investigated a possible alternative quantiica-tion of the precipitates by atomic force microscopy (AFM) to complement the tech-nique by TEM. For this, three conditions for heat treatment of an aged aluminium alloy AA7050 were therefore chosen to produce different density and sizes of precipi-tates. The experimental results showed that the AFM technique proved to be a valid qualitative tool and may complement the results obtained by TEM an exploratory analysis for the microstructures.
Keywords: aluminium alloy AA7050, interrupted ageing, secondary precipitation, TEM and AFM.
http://dx.doi.org/10.1590/0370-44672016690019
Sheila Cristina Jacumasso
Aluna de mestrado
Universidade Estadual de Ponta Grossa – UEPG Departamento de Engenharia de Materiais Ponta Grossa – Paraná – Brasil
Juliana de Paula Martins
Professora Adjunta
Universidade Tecnológica Federal do Paraná - UTFPR Departamento de Engenharia Química
Ponta Grossa – Paraná – Brasil [email protected]
André Luís Moreira de Carvalho
Professor Adjunto
Universidade Estadual de Ponta Grossa - UEPG Departamento de Engenharia de Materiais Ponta Grossa – Paraná – Brasil
1. Introduction
In the 7XXX series alloy, the base Al-Zn-Mg-Cu, is widely used in the aircraft industry. The me-chanical strength of these alloys is increased through precipitation of a ine dispersed phase through a heat treatment process called precipitation ageing. Consequently, Guinier-Preston (GP) zones and the η' (MgZn2) and
η (MgZn2) precipitates are the main phases present in alloys of the 7XXX series, and the η' phase is primarily re-sponsible for the increased resistance. The sequence of precipitation for alloys of Al-Zn-Mg-Cu is generally summa-rized as: supersaturated solid solution (SSSS) → GP zones → intermediate precipitates η' → equilibrium precipi-tates η (Berg et al., 2001; Katgerman and Eskin, 2003; Sverdlin, 2003).
The nucleation of these pre-cipitates can occur homogeneously (uniform and non-preferential) and heterogeneously (preferential) in spe-ciic places such as grain boundaries,
dislocations and vacancies. The size, morphology and distribution of precip-itates can result in improvements in the mechanical properties (Katgerman and Eskin, 2003; Andreatta, 2004; Brent et al., 2004; Smallman and Ngan, 2007). Temperature and ageing time are the main parameters for the variation in the final formation of precipitates. This precipitation can be carried out only in a simple ageing stage (condition T6), in multiple steps at different times and temperatures, called double ageing (T7451 condition), or by secondary precipitation ageing known in the T6 condition as interrupted followed by ageing for long periods at temperatures around 65 °C, as well as the so-called reversal treatment and re-ageing.
The quantiication of these pre-cipitated particles in metallic alloys has been made by a series of charac-terization techniques, especially by transmission electronic microscopy and scanning electronic microscopy
(T EM and SEM). The technique that is most utilized to characterize nanometrics precipitates is the TEM. Unfortunately, this technique requires a careful sample preparation to obtain a very thin substrate, smaller than 100 nm. In articles written by La Garza
et al. (2002) and Garcia - Garcia et al. (2014), the use of atomic force microscopy (AFM) shows evidences of the quantiication of the η' and η
precipitates with the collaboration of microscopy techniques (TEM and SEM). AFM is little explored regarding the characterization of the microstruc-ture of metallic alloys.
2. Experimental procedure
Samples were prepared from a plate of aluminium AA7050-T7451 supplied by
Embraer S.A. The chemical composition of this alloy in T7451 as received condition is
described in Table 1. Samples were taken in the rolling direction and along its thickness.
Table 1 Chemical composition (wt.%) of AA7050 alloy used in this research.
Zn Mg Cu Zr Fe Si Cr Mn Al
5.59 1.87 2.01 0.13 0.07 0.03 0.0004 0.015 Balance
The heat treatment was performed in the following sequence: solution heat treatment (485 ºC for 4 hours), quench in water and ageing. The T6 condition is a simple process of ageing; the sample was solubilized and aged at a temperature of
130 °C for 2 hours. The T6I4-65 condition is an interrupted condition; the sample was carried out in two stages. The irst ageing step was performed at temperature 130 ºC for 30 min. The second stage of ageing was performed at a temperature of 65 °C for 24
hours. The T7451 condition was analysed as received condition, as shown in Table 2. The ageing times and temperatures applied in T6I4-65 and T6 conditions are described in Table 2. These features were based on the studies of Buha et al. (2008).
Table 2 Description of ageing heat treatments.
Ageing Heat treatment Solution treatment First step Second step
T7451
485ºC for 4h
as received as received
T6 Ageing at 130ºC for
120 min
-T614-65 130ºC for 30min Ageing at 65ºC for 24 hours
To analyse the thin disks for TEM, a TECNAI G2F20 brand device was used. The samples were sanded and polished with the polishing ionic low temperature to avoid heating of the samples and to obtain a thin disk of approximately 100 nm, which is ideal for this type of analysis.
The samples were analysed under atomic-force microscopy (AFM). All samples were studied under a Shimadzu SPM-9600 microscope with 400 nm minimum resolution, equipped with a 125 μm scanner operating in non-contact
mode. Small samples were cut and sanded with water silicon carbide-based (SiC) sandpaper and polished with alumina 1 and 0.3 μm, and then etched with Keller's reagent (HF 2 ml, HCl 3 ml, HNO3 5 ml, H2O 190 ml). The samples were immerged into Keller’s reagent during 10 seconds at room temperature. After this, the samples were cleaned with water and isopropyl alcohol.
In the present work, irstly the pre-cipitate feature was identiied through its morphology, distribution and size using
TEM analysis according to references. Thus, the precipitate size was measured with AFM analysis for three conditions. In this way, once measured the precipitate size, the same was classiied and compared with the TEM analysis and then identi-ied. Moreover, to measure the precipitate size from the 2D AFM image analysis, ImageJ software was used. This soft-ware permits the conversion of a known distance in (μm) to distance pixels to be able to measure the precipitate length for the three conditions investigated.
3. Results and discussion
It was possible to identify the GP zone, η' and η phases based on literature (Berg et al., 2001; Buha et al., 2008; Garcia et al., 2014). The GP zones pre-sented in T6 and T6I4-65 conditions are small clusters of atoms coherent with the aluminium matrix. MgZn2 (η' and
η) is identiied as precipitates that have a size between 1 and 100 nm and in-termetallic particles that have a size be-tween 1 and 20 μm (Andreatta, 2004), which are also present in all the three
conditions. The TEM microstructural analysis identiied the size, morphology, distribution and chemical composition of these phases. In the analysis by TEM, it was possible to assess which condition showed a higher density of hardening phases. Hence, the results obtained by TEM served as a basis for the analysis of the density of precipitates, obtained through surface roughness by AFM.
Figure 1 (a) and (b) obtained in bright ield shows the microstructure
453 REM: Int. Eng. J., Ouro Preto, 69(4), 451-457, oct. dec. | 2016
Figure 1
TEM micrograph in bright field (BF) (a) microstructure of alloy AA7050 in artificially aged condition T7451 with second phase particles precipitating in the grain boundaries and within the matrix; (b) a fine distribution of
precipitates within the aluminium matrix and the respective morphologies of platelets and needles.
A microstructure with a distribu-tion of nanometric precipitates is shown in Figure 1 (b). The η phases are primar-ily formed in the regions of defects such as grain boundaries, generating evidence for identiication. The structures formed inside the grain have predominantly η
stable phase morphology, which have platelets and needles (Brent et al, 2004; Epler, 2004). Note the aligned particles are quite spaced, showing low density of precipitates with an average size of the precipitates in the form of platelets
around 38 nm and 42 nm for needles. In this overaged condition, it is not possible to notice the presence of GP zones and η' that have been transformed into a more stable phase, η.
Figure 2 (a) and (b) shows a mi-crograph by TEM in the aged sample T6 condition. This condition presents a PFZ region of approximately 60 nm formed adjacent to the grain boundary, characterized by lack of precipitates. Figure 2 (a) shows grains of various sizes, and the presence of large amounts
of precipitates in both grain boundary and inside the matrix. Also note that the ine precipitates are present inside the grains and the size of precipitates is higher in the grain boundary. Precipi-tates formed at high-angle grain bound-aries are usually in the equilibrium phase (η) and larger than those formed in the matrix (η'), owing to preferred nucleation and accelerated growth, due to faster diffusion of solute along grain boundaries than in the matrix (Rometsch et al.,2014).
Figure 2
TEM micrographs in artificially aged condition T6: (a) dark field (DF) showing the variation in grain size and nanometric precipitation at the grain boundaries and within the matrix; (b) bright field (BF) showing a
fine distribution of precipitates and GPII zones within the aluminium matrix.
The fraction volume of precipitates in the T6 condition consists in a great quantity of GPII zone phases, also η' semicoherent phase, as shows Figure 2 (b). According Buha et al. (2008) and Berg et al. (2001) GPII zones are formed by one or a few rich Zn-rich atomic layers on {1 1 1}Al and exhibit a plate-like or needle mor-phology. The metastable coherent η′ phase exhibit a platelets morphology. GPII zones are thinner and often also longer than the
η′ phase. It is was found that the approxi-mate size of the needle particles is 23 nm and the platelets is approximately 17 nm. The T6 is an underaged condition, which indicates a transition phase in GPII zones for the formation of the η' phase.
In Figure 3 (a), the ageing micro-structure interrupted T6I4-65 condition is obtained in dark ield. It is possible to notice in Figure 3 (a) a high density of GPII zones and precipitated inside the grains and at grain boundaries. The T6I4-65 temper increases the density of the η' platelets in alloy 7050 compared to the T6 temper (Buha et al., 2008). The TEM observations showed that the pre-cipitates formed in the interrupted peak-aged microstructures were iner, more densely distributed, more closely spaced, and present in greater numbers than they were following the T6 temper (Buha et al.,
2006). Precipitates observed in Figure 3 (b) present in the grain boundary are
pos-sibly of η equilibrium phase, evidenced by their size of around 32 nm and needle morphology. PFZ observes a region of approximately 25 nm, near the grain boundary, characterized by the absence of precipitates. Inside the grain, there is a predominance of GPII zones. It is possible to notice a signiicant presence of coher-ent clusters idcoher-entiied as precursor GPII zones of the metastable phase η', which is present in about the size of 14 nm. That is, within the aluminium matrix, there is a predominance of a thin homogeneous distribution of precipitates of nanometric size with a high volume fraction of phase transition to GPII zones η'.
The TEM microstructure
obser-(a) (b)
different between the three ageing treatment conditions, as can be seen in Figure 4. Thus, one of the objectives
Consequently, the results of analy-ses carried out in the T7451 condition showed the predominance of a η phase,
as underaged, as it showed the presence of GPII zones and η', with approximate sizes of 20 nm.
Figure 3 TEM micrographs of (a) and (b) dark field (DF), showing the overall microstruc-ture of the alloy AA7050 in artificially aged
T6I4-65 condition, with second phase particles precipitating in the grain
boun-daries and within the matrix.
Similarly, the condition T6I4-65 showed predominantly ine GPII zones identiied as zones homogeneously dis-tributed in the matrix and approximate size of 14 nm; thus, it was conirmed that this condition lies in an underaged state. The difference in sizes of PFZs being 80, 60 and 25 nm for the T7451,
T6 and T6I4-65 conditions, respec-tively is also noticed. It is known that the width of the PFZ inluences the loss of ductility; it promotes the heterogene-ity of properties in the microstructure, and the matrix has a higher resistance than the grain boundaries (Porter and Easterling, 1996). The results of the
microstructure in T6I4-65 condition suggest that it may provide greater resistance to movement of dislocations than larger and more widely spaced precipitates as T7451 and in the T6 temper and, consequently, a higher mechanical resistance, as shown in Lima (2014).
Figure 4 TEM microstructure showing the variation in the volume fraction of precipitates under the conditions (a) T7451, (b) T6 and (c) T6I4-65.
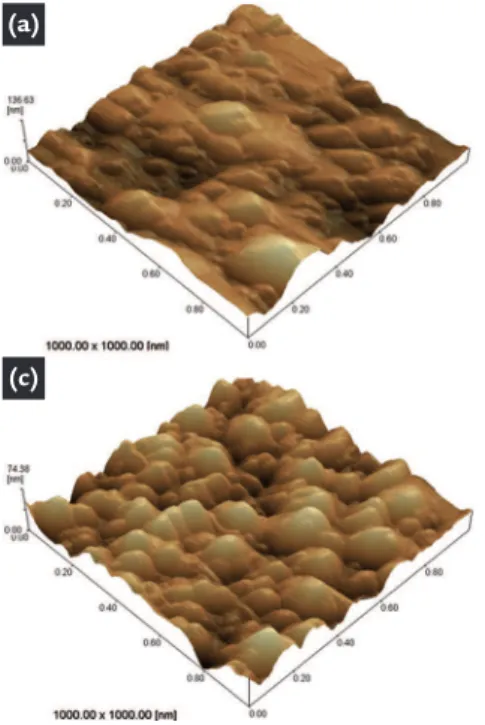
Figures 5 (a), (b) and (c) show the three-dimensional AFM images of the artificially ageing samples obtained from the conditions T7451, T6 and T6I4-65, respectively. The difference
can be seen in the surface roughness and precipitate size of the three conditions investigated. It was possible to correlate the density of precipitates with surface roughness found for each condition.
Table 3 shows the roughness parameters (Ra) and the measurement of precipitate size detected by AFM. In each case, it proceeded to the overall measurement of a 1x1μm2 ield.
Table 3 Surface roughness parameters and quantification of the size of precipitate detected by AFM.
Condition Ra [nm] Precipitate size (nm)
T7451 26.6 38 - 641
T6 20.1 24 - 355
T6I4-65 11.7 16 - 196
(a) (b)
(a) (b) (c)
The average roughness values (Ra) were obtained from the topo-graphic proile of 3D images of Figures
5 (a), (b) and (c) of T7451, T6 and T6I4-65 conditions, respectively. It is possible to see that the T7451 condition
455 REM: Int. Eng. J., Ouro Preto, 69(4), 451-457, oct. dec. | 2016
Figure 5 Analysis by AFM topographical
showing the surface roughness three-dimensional image of (a) the T7451 condition; (b) the T6 condition; (c) T6I4-65 condition.
The 2D images were used to quantify the minimum and maximum values of precipitate size using the ImageJ software shown in Table 3. It can be seen that the T7451 condition has precipitates with sizes in the range of 38 to 641 nm, which conirms the observed TEM, which re-vealed particles with an approximate size of 40 nm. A smaller roughness (Ra: 11.7 nm) is associated with larger density of iner precipitates. Whereas, larger precipi-tates tend to increase the roughness value (Ra = 26.6 nm), as shown in the phase contrast micrograph in Figure 6 (a) which shows lower density of precipitates due to larger particles. While the T6
condi-tion has a roughness Ra = 20.2 nm and precipitate size in the range of 24 to 355 nm, Figure 6 (b) showed an intermedi-ated density of precipitates. The T6I4-65 condition has a roughness Ra = 11.7 nm and particle sizes from 16 to 196 nm and Figure 6 (c) showed a higher density of precipitates.
Moreover, the minimum and maxi-mum values of precipitate size (Table 3) show great scatter for three conditions. It was as consequence of measured interme-tallic particles, that likely can contribute to higher scatter. This can be conirmed in Figure 7, which displays the variation of the frequency versus precipitate size in
the three ageing conditions in a 1x1μm2
ield. It is possible to notice the absence of greater precipitate size for the three condi-tions investigated.
The condition T6I4-65 showed a high density of small precipitates, identiied as TEM (Figure 3) with GPs zones and η' phase, and homogeneously distributed in the matrix aluminium alloy in relation to the T6 condition that revealed particles of a few nanometers. Figures 7 (a) and (c) indicate that insertion of an interrupted aging stage at 65 °C into a typical T6 heat treatment for aluminium alloy AA7050 that promotes the formation of high density precipitates in the inal microstructure.
(a) (b)
(c)
Figure 6 Micrograph AFM, phase contrast, condition (a) T7451, (b) T6 and (c) T6I4-65, revealing the size and density of the precipitates.
(a) (b)
4. Conclusions
The analysis by AFM allowed a qualitative and quantitative analysis of the surface of the three ageing treatment condi-tions investigated in this work. Thus, the topographical evaluation results showed an average roughness (Ra) ranging from one condition to the other, as well as a particle size range. This indicated a higher density of small particles evenly distributed
in the aluminium alloy matrix in T6I4-65 condition, where it was possible to clearly distinguish the precipitated particles, con-irming what was observed in TEM for this condition. However, precautions are needed so that one does not mistake inter-metallic particles for precipitates. Thus, the AFM technique proved to be a valid quali-tative tool and can complement the results
obtained by TEM for exploratory analysis of the microstructure, indicating a new and interesting method to perform the evalua-tion of the density of nanometric particles. Moreover, the ease of sample preparation consists of basic metallographic techniques not requiring the making of thin ilms as in TEM, thus allowing the preparation of several samples in a short time.
5. Acknowledgements
The authors acknowledge Coorde-nação de Aperfeiçoamento de Pessoal de
Nível Superior (CAPES) for the inancial support, and UEPG – Universidade
Estad-ual de Ponta Grossa for the opportunity and facilities.
6. References
ANDREATTA, F. Local Electrochemical Behavior of 7XXX Aluminum Alloys. Ne-therlands:
Netherlands Institute for Metals Research, 2004. 218 f. (DPhil Thesis)
BERG, L. K. et al. GP – zones in Al-Zn-Mg Alloys and their Role in Artiicial Aging.
Acta Materialia. v. 49, n. 17, p. 3443-3451, 2001.
BRENT L. A. et al. Metallography and Microstructures. USA: ASM International, 2004. v. 9, ASM Handbook.
BUHA, J., LUMLEY, R.N., CROSKY, A.G. Microstructural development and me-chanical properties of interrupted aged Al-Mg-Si-Cu Alloy. Metallurgical and Materials Transactions A. v. 37 A, p.3119-3130, 2006.
BUHA, J.; LUMLEY, R.N., CROSKY, A.G. Secondary ageing in an aluminum alloy 7050. Materials Science and Engineering, v. 492, p. 1–10, 2008.
DEIASI R, ADLER PN. Calorimetric studies of 7000 series aluminum alloys: 1. Ma-trix precipitate characterization of 7075. Metall Trans A. v. 8A, n. 7, p 1177–83, 1977.
EPLER, M. Structures by precipitation from solid solution. In Metallography and Mi-crostructures. USA: ASM International, 2004, p. 134–139. v. 9, ASM Handbook. GARCIA A. L. et al. Comparative quantiication and statistical analysis of η′ and η
Table 4 shows a comparison of the precipitates size obtained by both tech-niques, TEM and AFM. It is possible to
notice the size is less than 30 nm for the
η' phase and between 30–200 nm for the
η phase; similar results were found by
Gjønnes and Simensen, 1970, Deiasi and Adler, 1977, Garcia et al., 2014.
Condition
T7451 T6 T6I4-65
η η’ η GPs zones η'
TEM (nm) 38 - 42 17 – 23 45 - 85 14 14
AFM (nm) 38 - 641 24 30 - 355 16 30
Table 4
Quantification of the results of phase η' and η in TEM and AFM. Figure 7
457 REM: Int. Eng. J., Ouro Preto, 69(4), 451-457, oct. dec. | 2016
Received: 16 February 2016 - Accepted: 25 May 2016.
precipitates in aluminum alloy AA7075-T651 by TEM and AFM. Materials Cha-racterization, v. 87 p.116 –128, 2014.
GJØNNES J, SIMENSEN CHRJ. An electron microscope investigation of the micros-tructure in an aluminum-zinc-magnesium alloy. Acta Metall, v.18, n.8, 881–890, 1970.
KATGERMAN, L., ESKIN, D. Hardening, Annealing, and Aging. In: TOTTEN, G. E., MACKENZIE, D. S. Handbook of aluminum: physical metallurgy and process. v. 1. New York: Marcel Dekker, 2003. p. 259-303.
LA GARZA et al. Study of precipitates formed in a wrought aluminum alloy by means of atomic force microscopy. Materials Characterization v.47, p.397– 400, 2002. LIMA, L. O. R. Study of the effects of two-step ageing heat treatment on fatigue crack
growth on an AA7050 aluminum alloy. Advance Materials, v. 891-892, p.1111-1116, 2014.
PORTER D., EASTERLING K. Phase Transformations in metals alloys. (2. ed.) Chapman & Hall, 1996. p. 263 – 320.
ROMETSCH P. A., ZHANG Y., KNIGHT, S. Heat treatment of 7xxx series alumi-nium alloys—Some recent developments. Trans. Nonferrous Met. Soc. China, v. 24, p. 2003−2017, 2014.
SMALLMAN, R.E., NGAN, A.W. Physical metallurgy and advanced materials. (7ª ed.) Amsterdam: Elsevier, 2007. 650 p. 385 – 409.