473
Metallurgy and materials
Metalurgia e materiais
Metallurgical characterization
of kaolin from Atacama, Chile
Abstract
In order to determine the exploitation potentiality of a kaolin deposit from Ata-cama in the north of Chile, two types of kaolin (K–1 and K–2) were characterized by XRD, XRF, SEM/EDXS, size distribution, whiteness and DSC. Kaolinite, quartz, muscovite and albite were recognized as main constituents of the ore deposit, and also a signiicant amount of impurities that negatively impacts on quality were detected. Results show that the low quality presented by the samples, especially K–2, impedes their industrial use as raw material and further mineral concentration processes are proposed. Finally, the results of thermal analysis conirm a conversion to metakaolin that could be the basis for an alternative processing route.
Keywords: Kaolin, X-ray diffraction, Scanning Electron Microscopy, metakaolin, DSC.
http://dx.doi.org/10.1590/0370-44672016690005
Oscar Rivera
Ingeniero Metalurgista Universidad de Atacama
Departamento de Ingeniería en Metalurgia Copiapó - Atacama - Chile
Osvaldo Pavez
Profesor
Universidad de Atacama
Departamento de Ingeniería en Metalurgia - CRIDESAT Copiapó - Atacama - Chile
Julia Li Kao
Profesor
Universidad de Atacama
Departamento de Química y Biología Copiapó - Atacama - Chile
Amin Nazer
Profesor
Universidad de Atacama Facultad Tecnológica Copiapó - Atacama - Chile [email protected]
1. Introduction
Clays are one of the main components of soils and Earth crust. They have become one of the most important mineral resource of the human history, and their use goes back to ancient times (Cardarelli, 2008). One of the most important clays is kaolin, a ine grained rock that contains kaolinite (Al2Si2O5(OH)4) as the main constituent. It has low contents of iron and other
im-purities that can turn color from white to brown, grey, or red, depending on the im-purities existing in it. Kaolinite is the most common of kaolin group minerals (kaolin-ite, dick(kaolin-ite, nacrite and halloysite), all these compounds excluding hydrated halloysite (Al2Si2O5(OH)4*2H2O) have identical chemical composition, differing only in their structure (Guggenheim et al., 1997,
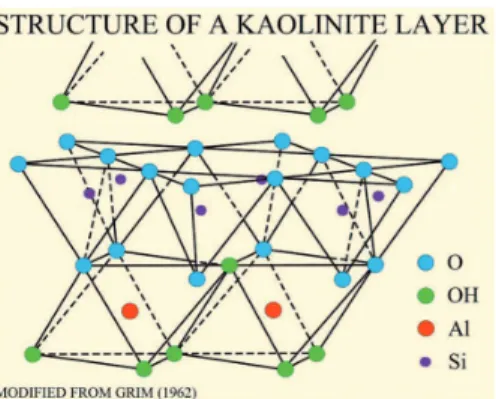
Bentabol 2003). The crystal structure of the kaolin group is formed by SiO2 tetrahedron and Al2O3 octahedron layers connected by oxygen and hydroxyl groups (1:1 layered clay), as shown in Figure 1. The theoretical composition of kaolinite is 46.54% SiO2; 39.50% Al2O3 and 12.96% H2O, and it has an earthy fracture and pseudo-hexagonal laky morphology (Murray, 2007).
474 REM: Int. Eng. J., Ouro Preto, 69(4),473-478, oct. dec. | 2016 Due to its physical and chemical properties, kaolin can be used in a wide range of applications, such as: ceramics manufacturing, refractory products, paper industry and rubbers and plastics, among others (Luz et al., 2005). Kaolin is also processed
by roasting to obtain metakaolin, an amorphous aluminosilicate widely used in the construction industry (Murray, 2007)
Kaolin production in Chile is led by the Coquimbo, Metropolitana
and Libertador General Bernardo O’Higgins regions. In 2012, national production was 60, 249 tons; this val-ue has not increased from 2010 until today (Servicio Nacional de Geología y Minería – SERNAGEOMIN, 2013). In Atacama, kaolin production gradu-ally decreased from 1999 to 2003 and there are no records of production in the last 12 years. However, there are unexploited deposits which could be potentially exploited. In addition to the above, there are no records in
lit-erature about kaolin from Atacama, neither about chemical or physical properties nor about impurities that could affect its quality or commer-cial value. In other words, there is no information about the kaolin of this zone.
In view of the foregoing, this study is expected to provide useful information to develop an alternative metallurgical processing, in order to make kaolin from Atacama more competitive in the local market.
2. Materials and methods
2. 1 Materials
Representative samples were extracted by sorting from a deposit lo-cated in Cuesta Pajonales, in the south of Atacama. Two types of samples
were obtained and labeled K–1 (white sample) and K–2 (light brown sample) due to their predominant color. Both samples were processed by jaw and
roll crushing (100% under 100# Ty-ler) and the ultraine fraction (90% under 325# Tyler) was removed by wet sieving.
2.2 Methods
X-Ray Diffraction (XRD) was car-ried out in a Shimadzu XRD-6100 (Cu Kα) diffractometer. Step size of 0.02°, scan speed of 2 degree min-1 and 2θ from
5 to 90°.
Chemical composition was deter-mined by X-ray luorescence (XRF), loss of calcining at 980 °C for 1 hour and humidity at 105 °C for 1 hour.
Particle size distribution was mea-sured in a Malvern Mastersizer analyzer. A Whiteness test was carried out by a Minolta CR-14 colorimeter with ASTM E-313 and HUNTER whiteness standards.
Morphological and chemical charac-terizations were carried out by Scanning Electron Microscopy (SEM) and Energy Dispersive X-Ray Spectroscopy (EDXS) in
a Zeiss EVO MA 10 with Oxford X-Max 20 detector. Secondary (SE) and backscat-tered (BSE) electrons modes were used for the analyses.
A TA Instruments Q20 (N2 atmo-sphere) was used for Differential Scanning Calorimetry (DSC) analysis. Both samples were heated twice from 50 to 600 °C with a heating rate of 10 °C min-1.
3. Results
3.1 Sample Characterization
X-ray Diffraction
XRD patterns of K–1 and K–2 are shown in Figure 2, which have been normalized for easier phase identiication. Both samples present
the same mineralogical composition, being the main components kaolinite, quartz, albite and muscovite. In K–1, higher peaks of kaolinite and lower
peaks of albite are noted; this could be an indication of a higher proportion kaolinite/albite in K–1, in comparison to K–2.
Figure 2
XRD patterns of K–1 and K–2.
X-ray Fluorescence
Table 1 shows chemical compo-sition of K–1 and K–2, appreciable amounts of impurities in both
sam-ples are detected. Also, it should be noted that a fraction of measured SiO2 belongs to the silicon oxide detected
by XRD.
475
Sample SiO2 (%) Al2O3 (%) Fe2O3T (%) CaO (%) MgO (%) K2O (%)
K–1 49.47 30.85 4.10 0.50 0.60 1.24
K–2 52.87 27.62 4.59 0.46 0.51 1.55
Sample ASTM E 313 HUNTER
K–1 53.70 79.18
K–2 26.64 70.02
Table 1 Chemical composition of samples by XRF.
Whiteness test
Whiteness results are presented in Table 2. Both samples present low values, in particular K–2, considering that
mar-ketable values for commercial kaolin are above 90 for ASTM E 313, and around 82.5% for HUNTER standard. As
ad-ditional data, paper industry demands an ISO whiteness index above 84.5% (Moraes et al., 2001, Costa, et al., 2009).
Table 2 K–1 and K–2 whiteness values.
Particle size analysis
Obtained values of d50 for K–1 and K–2 were 17 and 15 µm, respectively. Moraes et al. (2001) reported that the
paper industry demands kaolin with d50 values between 2 to 10 µm, and for coating purposes under 2 µm. Results show that
K–1 and K–2 are not suitable as paint iller or coating in the paper industry, if only jaw and roll crushing stages are considered.
Scanning Electron Microscopy / Energy Dispersive X-ray Spectroscopy
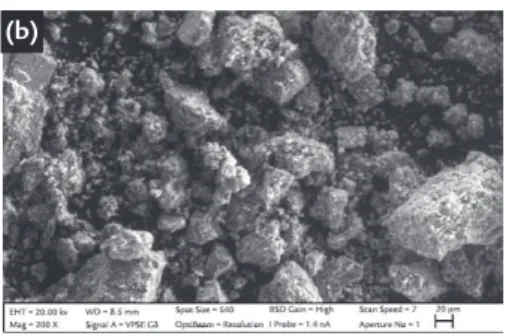
Figure 3 a) and b) are SEM images(200X) in SE mode of K–1 and K–2. Both samples present a morphology
which consists of big agglomerated particles between 10 to 80 micrometers, which are formed by smaller particles
around few microns of size. Bentabol (2003) reported the same morphology for natural kaolinite.
Figure 3 SEM images (200X) of a) K–1 and b) K–2.
Results of EDXS analysis are pre-sented above; K–1 was chosen because of its higher quality, in comparison to K–2. Figure 4 presents the SE ref-erence image (500X) of the studied zone, whereas Figure 5 presents the
elemental distribution of silicon, alu-minum, titanium, potassium, oxygen, iron and sodium (as identiied on the upper side of each picture). A homo-geneous distribution of aluminum, silicon and oxygen is observed, and
several impurities identiied as iron and titanium-rich particles are reported. On the other hand, presence of sodium and potassium is consistent with detection of albite (NaAlSi3O8) and muscovite (KAl2(AlSi3O10)(OH)2) by XRD. K–2 present high amounts of common
impurities associated to their natural condition, and therefore a very low
quality. The impurities are detrimen-tal for commercialization, due to the need of improving the product by
beneficiation processes to become suitable for industrial use (Yoon and Shi, 1986).
476 REM: Int. Eng. J., Ouro Preto, 69(4),473-478, oct. dec. | 2016
Figure 4
SE image of EDXS mapped zone (500X).
Figure 5
EDXS mapping of Figure 4.
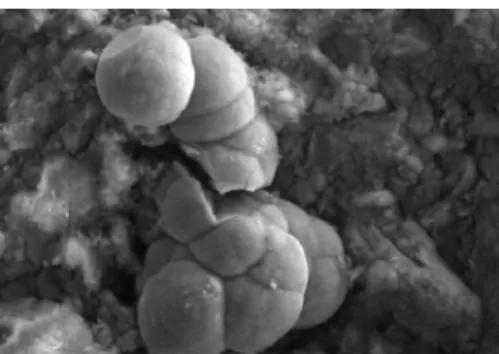
Figure 6 shows an enlarged view (1000X) of an iron-rich particle found in K–2. A botryoidal texture, commonly pre-sented by iron oxides like hematite or
goe-thite is observed. These oxides are found in several ore deposits in the northern side of Chile and they might be removed by metallurgical processes like dispersion,
high intensity magnetic separation, leach-ing or magnetic iltration, among others, to avoid detrimental effects in the kaolin quality (Luz et al., 1995; Luz et al., 2005).
Figure 6
Iron-rich particle found in K–2 (500X).
3.2 Thermal Analysis
Differential Scanning Calorimetry
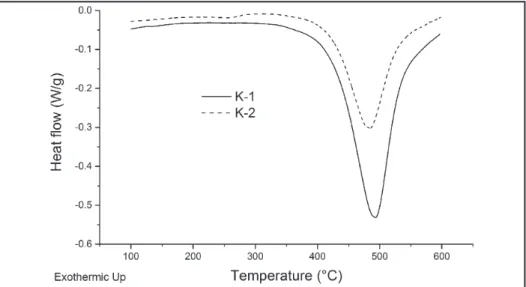
DSC results are presented in Figure 7. Both samples show one irreversible endothermic reaction around 500 °C, which is consistent with the kaolin dehydroxylation temperature (Redfern, 1987). DSC curves and calculateden-thalpies (220.2 Jg-1 for K–1 and 126.7
Jg-1 for K–2) show that K–1 requires
more energy to achieve the endothermic reaction. If we consider the above and take into account that specialized bib-liography conirms that kaolinite DSC
477 In order to analyze the effects of
heating on the studied samples, XRD patterns before and after DSC are pre-sented in Figures 8 and 9. After DSC, the main peaks of kaolinite in both
samples disappear and the remaining kaolinite peak heights decrease. This can be explained by kaolinite conver-sion to metakaolin, which is accom-plished by an amorphization process.
After heating, K–1 presents a hump in range 2θ = 20 to 30°, this is an evidence of system amorphization and also sug-gests a higher content of crystalline kaolinite in K–1.
Figure 8 K–1 raw and heated XRD patterns.
Figure 9 K–2 raw and heated XRD patterns.
4. Conclusions
The studied samples cannot be commercialized directly without further comminution and metallurgical processing stages. Considering the impurities of both samples, a wet treatment consisting of dis-persion, high intensity magnetic separation, leaching or magnetic iltration is proposed.
Metallurgical parameters such as mineral composition, whiteness, kaolinite content and degree of kaolinite crystallinity, suggest that K–1 presents the highest ex-ploitation potential of the studied samples. Despite the samples having been heated up to 600 °C and immediately
cooled down to room temperature, it was observed that the main peaks of kaolinite disappeared. It is sug-gested that a thorough study must be made, in order to lead to new alterna-tive processing routes for the studied ore deposit.
478 REM: Int. Eng. J., Ouro Preto, 69(4),473-478, oct. dec. | 2016 Received: 14 January 2016 - Accepted: 11 July 2016.
BENTABOL, M. J. Transformaciones hidrotermales de la caolinita. Facultad de Ciencias, Universidad de Málaga, 2003. 395 f. (Tese de Doutorado).
CARDARELLI, F. Materials handbook. A concise desktop reference. (2. Ed.). Sprin-ger–Verlag London Limited, 2008. 1340p.
COSTA, D. S., RUSSO, M. C., SANTOS, D.F., ARAUJO, A.C., PERES, A.E.C. (2009). Avaliação do potencial de superfície de partículas de caulim proveniente da região nordeste de Minas Gerais. In: ENCONTRO NACIONAL DE TRATA-MENTO DE MINÉRIOS E METALURGIA EXTRATIVA, 23. Anais... Grama-do, 27 set. - 10 out. 2009. v2, p.569-574.
GUGGENHEIM S., ALIETTI A., DRITS V. A., FORMOSO M. L. L., GALÁN E., KÖSTER H. M., PAQUET H., WATANABE T., BAIN D. C., HUDNALL W. H.. Report of the Association Internationale Pour L’Etude des Argiles (AIPEA) Nomenclature Committee for 1996. Clays and Clay Minerals, v. 45, n. 2, p. 298-300, 1997.
LUZ A. B., CAMPOS A. R., CARVALHO E. A., BERTOLINO L. C. Caulim. In: LUZ A. B., FREITAS LINS F. (ed.) Rochas e Minerais Industriais. Rio de Janeiro: CETEM/MCT, 2005. p. 231-262. 720. (Cap. 11).
LUZ, A.B., COSTA, L.N.S., CHAVES, A.P. Aspectos de alguns redutores usados no alvejamento de caulins. In: XVI ENCONTRO NACIONAL DE TRATAMENTO DE MINÉRIOS E METALURGIA EXTRATIVA, 16. Rio de Janeiro, 1995, v. 1, p.163-179.
MORAES J. M., LUZ A. B, BERTOLINO, L.C. Caracterização tecnológica e mine-ralógica de caulins brasileiros. In: JORNADA DE INICIAÇÃO CIENTIFICA, 14. Rio de Janeiro: CETEM/MCT, 2006.
MURRAY H. H. Applied clay mineralogy. Occurrences, processing and application of kaolins, bentonites, palygorskite-sepiolite and common clays. Elsevier, 2007. 180p.
REDFERN S. A. T. The kinetics of dehydroxylation of kaolinite. Clay Minerals. v. 22, n. 4, p. 447-456, 1987.
YOON R., SHI J. Processing of kaolin clay. In: SOMASUNDARAN, P. (Ed.). Advan-ces in Mineral ProAdvan-cessing. New York: American Institute of Mining, Metallurgical and Petroleum Engineers, AIME, 1986.
6. References
5. Acknowledgements
The authors thanks the support of Research and Postgraduate Directorate of Universidad de Atacama for funding DIUDA 221213 project. The authors
also gratefully appreciate the research assistance from Laboratorio de Ma-teriales and the collaboration of Miss Evelyn Cárdenas for the reviewing of