479
Abstract
In this paper, a detailed study of the inluence of Mn2+ ions on quartz and he-matite lotation (at pH 10.5 with starch/amine as depressor/collector) in the absence and presence of ethylenediaminetetraacetic acid (EDTA) is presented. By using zeta potential measurement and a careful analysis of manganese species present in water for dosages in which manganese hydroxide precipitated, we conirmed that the depression of both minerals by Mn2+ ions is due to the following: (i) the adsorption of Mn hydroxy complexes (Mn2(OH)3+ and Mn(OH)+); (ii) Mn2+ and mainly (iii) the precipitation of Mn(OH)2 on mineral surfaces. These effects hindered the adsorption of amine species on the surfaces of the minerals (quartz and hematite). EDTA was used to complex Mn2+ to restore the recoveries of both minerals. This was conirmed by the species dis-tribution diagrams of Mn and EDTA–Mn in water. Conditioning with starch followed by amine at pH 10.5 enabled a selective separation of these minerals.
Keywords: Iron ore, cationic lotation, amine, corn starch, ethylenediaminetetraacetic
acid complexing agent, EDTA, manganese species.
Deisiane Ferreira Lelis
Mestre pela Universidade Federal de Ouro Preto – UFOP Escola de Minas
Departamento de Engenharia de Minas Ouro Preto – Minas Gerais – Brasil [email protected]
Versiane Albis Leão
Professor Adjunto
Universidade Federal de Ouro Preto - UFOP Escola de Minas
Departamento de Engenharia Metalúrgica Ouro Preto – Minas Gerais – Brasil [email protected]
Rosa Malena Fernandes Lima
Professora Titular
Universidade Federal de Ouro Preto - UFOP Escola de Minas
Departamento de Engenharia de Minas Ouro Preto – Minas Gerais – Brasil [email protected]
Effect of EDTA on quartz
and hematite flotation with
starch/amine in an aqueous
solution containing Mn
2+
ions
Mining
Mineração
http://dx.doi.org/10.1590/0370-44672016690014
1. Introduction
Reverse cationic lotation is com-monly used to concentrate the pellet feed fraction (−150 µm) of low-grade iron ores (25% to 45% Fe). Currently, ether amine acetate with a neutralization degree of 30%–50% is used as the silicate gangue (quartz) collector and starch is used as the depressant of iron oxide minerals (hematite, magnetite or goethite) at pH 10–10.5 (Araujo et al., 2005, Filippov et al. 2014). Reductions in the performance
of the cationic lotation of iron ores of high grade Mn (MnO >1%) has been ob-served in some mines of the Quadrilátero Ferrífero/Brazil.
Usually, polyvalent ions such as Ca2+, Al3+ and Mg2+ in water are at-tracted electrostatically by the negatively charged surfaces of the minerals or the
adsorption of hydroxy complexes and the precipitation of hydroxides on the mineral surfaces (Fuerstenau et al., 1985), which
can interfere with the selectivity of some lotation processes such as the reverse cationic lotation of iron ore (Pinheiro
et al., 2012, Lelis, 2014, Carvalho and
Peres, 2004).
EDTA reacts with several metallic ions such as Ag+, Ca2+, Mg2+, Fe2+, Fe3+, Mn2+ and Al3+ (Rao, 2004). The products of these reactions are very stable (forma-tion constant > 105) (Martel and Smith, 2003). Therefore, EDTA can be used to complex these ions in aqueous solu-tions to prevent their deleterious effect on system lotation using amines, as in the case of the reverse cationic lotation of iron ores. However, in the lotation
process, this chelating agent interacts with the minerals in solution (Rubio and Matjevic, 1979; Chang et al. 1982; Chang
et al, 1983; Orthgiess and Dobiás, 1994;
Wang and Forssberg, 1990; Rumball and Richmond, 1996).
Ζeta potential measurements of
sulphide minerals (pyrite, galena, arse-nopyrite) (Wang and Forssberg, 1990), and metal hydrous oxides (hematite,
β-FeOOH) (Rubio and Matjevic, 1979,
Chang et al. 1982 ) show that in
pres-ence of EDTA, the IEP of these minerals is shifted to lower pH values, which was ascribed to speciic interactions between their surfaces with complexing solute species at pH values <~7. Leaching of Fe3+
from hematite and β-FeOOH depends
concentration. However, this reaction is very slow, with an equilibrium time of 4 days) (Chang et al, 1983).
Cruz and Lima (2015) studied the inluence of Mn2+ ions in water on reverse cationic lotation of an iron ore sample (44.7% Fe and 31.8% SiO2). They veri-ied the minor inluence of Mn2+ ions on all response variables evaluated: mass recovery, Fe metallurgical recovery and
the grade of Fe and SiO2 in the obtained
concentrates for MnCl2 concentrations
from 600 g/ton. The conditioning of a pulp with EDTA (720 g/ton) in the pres-ence of MnCl2 (600 g/ton) at natural pH before addition and conditioning with corn starch (400 g/ton) and amine (50 g/ ton) at pH 10.5 produced a concentrate with 63% Fe and 5.1% SiO2.
This study presents the inluence
of Mn2+ ions on the loatability and zeta potential values of quartz and hematite, which are the main minerals present in the iron ore previously studied by Cruz and Lima (2015), at pH 10.5 with: i) ether amine, ii) starch/ether amine and iii) chelating EDTA)/starch/ether amine. The effects of manganese ions on both minerals’ surface properties have not been deeply investigated.
2. Materials and methods
2.1 Mineral samples and reagents
Table 1 presents the chemical com-positions of the mineral samples from the
Quadrilátero Ferrífero, Brazil, used in the microlotation (size fraction of −295 +147
µm) tests and zeta potential determinations (size fraction of −37 µm) (Lelis, 2014).
Size (μm)
Quartz Hematite
% ppm (x10-1) %
SiO2 LOI Fe Al Na Ca Mg Ti FeT FeO Al2O3 MnO CaO MgO TiO2
-295+147 99.54 0.19 4.1 5.3 1.0 1.8 1.3 2.3 69.3 0.39 0.39 0.02 0.01 0.01 0.02
-37 98.88 0.25 1 1.6 - 0.57 - 0.6 69.1 0.39 0.60 0.03 0.07 0.02 0.03
Table 1
Chemical composition of quartz and hematite samples used in the microflotation tests and zeta potential measurements.
LOI - loss of ignition
The reagents used in the micro-lotation tests and zeta potential mea-surements were as follows: i) commer-cial ether amine acetate with a 50% neutralization degree (Clariant A.S.) as the collector; ii) commercial corn starch (Unilever A.S.) as the
depres-sant; iii) manganese chloride tetrahy-drate (MnCl2·4H2O) (LabSynth Ltd.); iv) EDTA (C10H14N2O8Na2·2H2O) (LabSynth Ltd.) as the complexing agent; v) sodium chloride (NaCl) (Santa Helena Ltd.) as the ionic me-dium; vi) thymolphthalein (LabSynth
Ltd.) to buffer the pH at 10.5 and vii) sodium hydroxide (NaOH) and HCl (Vetec Ltd.) for pH control. Distilled water was used in all tests and reagent preparation, except for thymolphthalein solutions, which were prepared using hydrated ethyl alcohol.
2.2 Microflotation tests
The microflotation tests (two replicates for each condition) were performed in a Hallimond modiied cell at pH 10.5 at maximum recovery (~100%) for both minerals, which was achieved with dosages of ether amine acetate of 50 mg/L (13.5 mg/g) for he-matite and 2.5 mg/L (0.675 mg/g) for quartz (Lelis, 2014). The weight of each mineral sample was 1 g, and the solution in the Hallimond cell was of 270 mL. The recoveries of both minerals were determined as a function of the follow-ing conditions: i) corn starch dosage
(0 to 1000 mg/L (0 to 270 mg/g));
ii) MnCl2 dosage (0 to 200 mg/L (0
to 54 mg/g)); iii) corn starch dos-age (0 to 10 mg/L (0 to 2.7 mg/g)) at 10 mg/L (2.7 mg/g) and 200 mg/L
(54 mg /g) dosages of MnCl2; iv)
EDTA dosage to 200 mg/L (54 mg/g)
MnCl2; and v) EDTA at 600 mg/L
(162 mg/g), 200 mg/L (54 mg/g) MnCl2, with and without corn starch.
The conditioning times of the re-agents were respectively: 3 min for the amine, 6 min for the MnCl2, and 5 min for the starch and EDTA. In the
complex-ation tests of Mn2+ by EDTA (iv), initially the mineral samples were conditioned with MnCl2 (5 min) at approximately pH 7 and were followed by EDTA condition-ing (5 min). Subsequently, the pH was ad-justed to 10.5 by the addition of thymol-phthalein and NaOH, and the samples were conditioned for 3 min more after amine was added. After the conditioning time in each condition as described before in (i) to (v) at the appropriate dosage of reagents, the mineral samples were loated for 1 min using commercial nitrogen (low rate of 60 mL·min−1).
2.3 Zeta potential measurements
The zeta potentials of the mineral samples were determined using a zetame-ter (Malvern Zetasizer Nano Z–ZEN 2600), which automatically determines the electrophoretic mobility of the par-ticles and transforms it to the zeta
poten-tial (ζ) using the Smoluchowski equation. All zeta potential measurements were performed at a constant ionic strength (10−4 M NaCl) and pH (10.5).
Considering the size distribution of the −37 µm size fraction, performed
481
prepared by the addition of 0.164 g (for quartz) and 0.150 g (for hematite) of the −37µm size fraction in 250 mL of the
10−4 M NaCl solution. The suspensions
were homogenized by inversion and settled for 20 min for hematite (density of 5.31 g cm−3) and 40 min for quartz (den-sity of 2.65 g cm−3) in such a manner that supernatant particles had a size below 10 µm, in accordance with Stokes’ law.
The suspensions were then transferred to 50 mL beakers, and the pH was adjusted with NaOH, followed by the addition of the reagents (as described in the previous paragraph) under constant agitation in a magnetic shaker. The suspension pH was measured, and an aliquot removed by a syringe from the top of suspension was slowly poured into the folded capil-lary cell and introduced to the zetameter.
The pH of the suspension that remained in the beaker under constant stirring was measured after each zeta potential determination was completed. The pH considered for each measurement was the value obtained at the end of each test. This procedure was performed twice for each condition test and each instance was measured three times, which means a total of six determinations.
3. Results and discussion
3.1. Manganese species in water
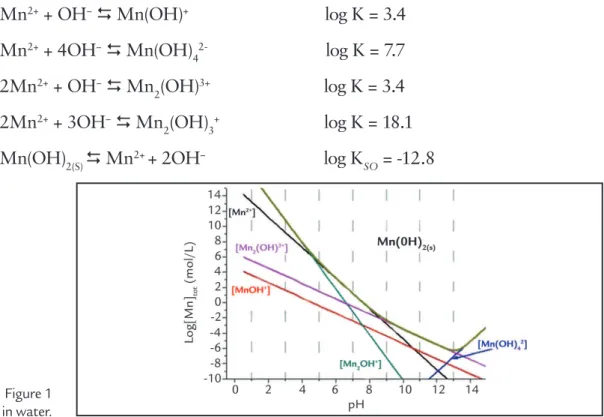
Figure 1 shows the diagram of Mn species that are present at 25 °C in
wa-ter and were dewa-termined on the basis of the solubility and equilibrium constants
of the following reactions (Martel and Smith, 2003):
Mn
2++ OH
−
Mn(OH)
+log K = 3.4
Mn
2++ 4OH
−
Mn(OH)
42-
log K = 7.7
2Mn
2++ OH
−
Mn
2
(OH)
3+log K = 3.4
2Mn
2++ 3OH
−
Mn
2
(OH)
3+log K = 18.1
Mn(OH)
2(S)
Mn
2++ 2OH
−log K
SO
= -12.8
Mn
2++ EDTA
−4
MnEDTA
2-log K = 13.9
MnEDTA
2−+ H
+
MnHEDTA
-1log K = 3.1
Mn
2++
EDTA
-4+ H
+
MnHEDTA
-1log K = 17
[MnEDTA
-1]
= 10
6.5[Mn
2+] [EDTA
-4]
(1)
(6) (2)
(7) (3)
(8) (4)
(9)
(10) (5)
B a s e d on Fig u re 1, at p H 10.5, the significant Mn species in
the water solution are Mn2(OH)3+
(10− 4 M ) , M n2 + (10− 5 . 8M ) a n d
MnOH+ (10−5.9 M). This means that
for the addition of 200 mg/L of MnCl2 (~1.6 × 10⁻³ M), almost 87 mg of Mn(OH)
2(s) is deposited.
The equations for Mn complex-ation by EDTA, and the respective equi-librium constants are presented below (Martel and Smith, 2003):
Figure 1 Diagram of Mn species at 25 °C in water.
By combining Equations (6) and (7), we obtain
From the equilibrium constant of Equation (8), at pH 10.5, we get
The mass balance of the Mn species in the solution can be written as
Sample
Size (μm)
2 5 7 10 15 20 25 30 40 60 71
Quartz 2.59 8.01 10.57 15.33 25.73 36.87 48.44 60.10 80.06 97.25 99.40
Hematite 3.56 7.71 10.54 16.74 31.27 46.81 61.71 74.87 91.67 99.70 100.0
Table 2
Size distribution (% undersize) of samples used in zeta potential measurements.
3.2 Microflotation tests
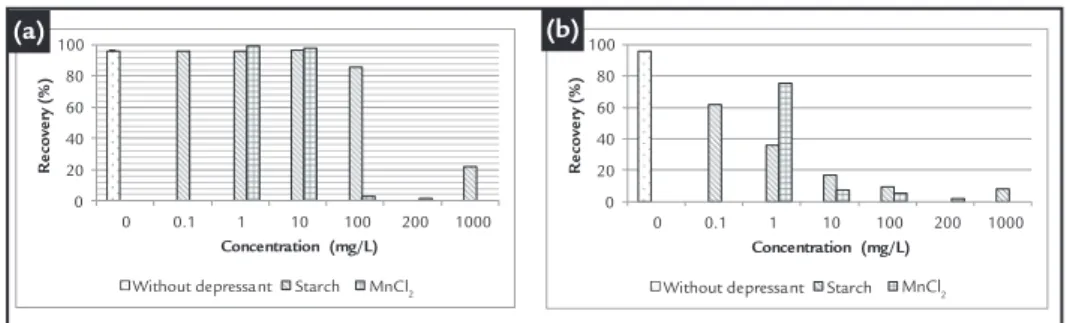
Figures 2a and 2b depict the re-coveries of quartz and hematite, respec-tively, as a function of the corn starch
and MnCl2 concentrations under the
conditions of the maximum recoveries of both minerals: pH 10.5, amine con-centrations of 2.5 mg/L (0.675 mg/g) for quartz and 50 mg/L (13.5 mg/g) for hematite.
As observed in Figure 2a, the quartz recoveries have almost the same values (up to 10 mg/L or 2.7 mg/g) for
both starch and MnCl2. At
concentra-tions above 10 mg/L (2.7 mg/g), MnCl2
is more eficient than starch at depress-ing quartz. In addition, lotation results show that a decrease in quartz recovery could be due to a competitive adsorption of Mn(OH)2(s) deposited on the quartz surface; the adsorption of Mn2(OH)3+,
Mn2+, Mn(OH)+ and aminium ions
and/or the precipitation of Mn(OH)2(s) on the mineral surfaces (see Figure 1) (Fuerstenau et al., 1985).
Corn starch is much more eficient in depressing hematite (Figure 2b) than quartz (Figure 2a), which is in accor-dance with the adsorption mechanisms of starch on hematite proposed by sev-eral researchers:
i) hydrogen bonding (Kar et al.,
2013) and
ii) the chemical character, such as the formation of a surface complex with iron ions (Kar et al., 2013, Pavlovic and
Brandão, 2003).
Figure 2
Recovery of quartz (a) and hematite (b) as a function of corn starch and MnCl2 con-centration at pH 10.5 and amine (2.5 mg/L (0.675 mg/g) - quartz and 50 mg/L (13.5 mg/g) hematite). Standard deviation of 0.79% for quartz and 0.04% for hematite.
0 20 40 60 80 100
0 0.1 1 10 100 200 1000
R
e
cove
ry
(%)
Concentration (mg/L)
Without depressant Starch MnCl2
0 20 40 60 80 100
0 0.1 1 10 100 200 1000
R e cov e ry (% )
Concentration (mg/L)
Without depressant Starch MnCl2
MnCl2 is a powerful depressant for hematite (Figure 2b) compared to quartz (Figure 2a). According to previous studies (Carlson and Kawatra, 2013, Rao, 2004), the Cl− ion reacts with the uncharged hy-drated iron oxide surface of hematite to form a positively charged chlorocomplex. Therefore, the electrostatic attraction of ether aminium ions by hematite decreases, which causes the depression. The lotation of both minerals pretreated with MnCl2 (Figures 3a and 3b) is severely affected by Mn and corn starch to-gether, showing a synergetic effect (i.e. greater than the depression effects of both reagents separately), as presented in Figure 2 The
ad-dition of starch had a reduced effect on the lotation of hematite pretreated with MnCl2 compared to quartz, which can be ascribed to the previous adsorption of Cl− on the hematite surface (Cromières et al., 2002, Carlson and
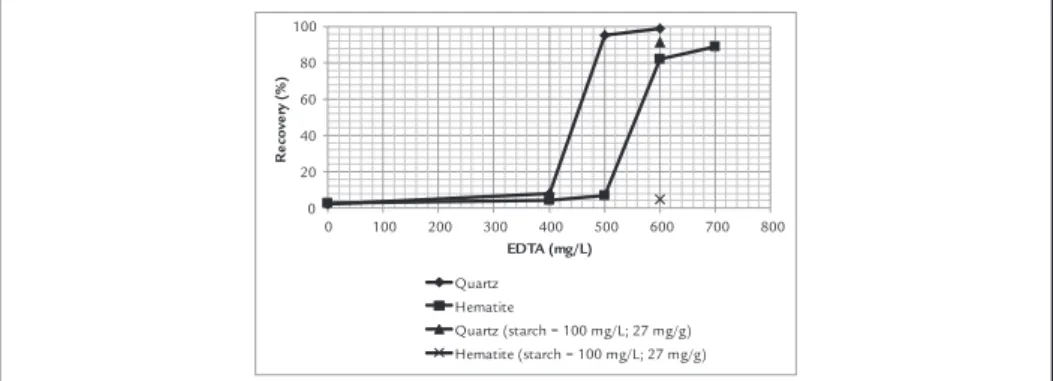
Kawatra, 2013, Rao, 2004 ) (see Figure 3b). Figure 4 presents the influence of EDTA on hematite and quartz recoveries. The mineral recoveries are restored after conditioning with EDTA. However, the re-agent concentration is approximately three times that of Mn species in aqueous solution. The EDTA concentration required to restore quartz recovery is 100 mg/L less than that required for hematite recovery, probably
be-cause of the higher amine afinity with quartz compared to hematite. The addition of corn starch after conditioning the minerals with EDTA (500 mg/L (135 mg/g) for quartz and 600 mg/L (162 mg/g) for hematite) results in high quartz recovery (90%) and very low hematite recovery because of the higher af-inity of starch for hematite than for quartz. Based on these results, it is possible to restore the selectivity between quartz and hematite by reverse cationic lotation in an aqueous solution containing Mn2+ after complexing it with EDTA, which is in accordance with the results of bench lotation tests of Cruz and Lima (2015) mentioned previously.
Figure 3
Recovery of quartz (a) and hematite (b) as a function of corn starch concentration at pH 10.5. Amine concentrations are 2.5 mg/L (0.675 mg/g) for quartz and 50 mg/L (13.5 mg/g) for hematite. Standard deviation of 0.86% for MnCl2 (10 mg/L (2.7 mg/g)) and 0.29% for MnCl2 (200 mg/L (54 mg/g)).
(a) (b)
98.3
4.8 3.7 4.5 1.9 1.7 1.51 1.48 0 20 40 60 80 100
0 0.1 1 10
R e cov e ry (% )
Starch (mg/L)
MnCl2 = 10 mg/L (2.7mg/g) MnCl2 = 200 mg/L (54 mg/g)
7.3
4.48
2.4 2.33 2.43 2.33 2.08
0 2 4 6 8
0 0.1 1 10
R e cov e ry (% ) Starch(mg/L)
MnCl2 = 10 mg/L (2.7 mg/g) MnCl2 = 200 mg/L (54 mg/g)
483 0 20 40 60 80 100
0 100 200 300 400 500 600 700 800
R e cove ry (%) EDTA (mg/L) Quartz Hematite
Quartz (starch = 100 mg/L; 27 mg/g) Hematite (starch = 100 mg/L; 27 mg/g) Figure 4
Recovery of quartz and hematite as a func-tion of EDTA at pH 10.5 and 200 mg/L (54 mg/g) MnCl2. Amine concentrations are 2.5 mg/L (0.675 mg/g) for quartz and 50 mg/L (13.5 mg/g) for hematite. Standard deviation of 0.87% for quartz and 2.38% for hematite.
3.3 Zeta potential measurements
The inluence of the studied reagents (ether amine acetate, corn starch, MnCl2 and EDTA) at pH 10.5 on the zeta poten-tials of quartz and hematite is presented in Figure 5.
The zeta potential of quartz varies from −51.8 to −40.94 mV (Figure 5a I and II) and from −44.4 to −31.4 mV for hema-tite (Figure 5b I and II) after conditioning
with ether amine. This is probably due to the electrostatic ether aminium attraction, co-adsorption of molecular amine and mo-lecular amine precipitation on the mineral surfaces at pH 10.5 (Churaev et al., 2000,
Kou et al., 2010, Ma, 2008). Because the
zeta potential of quartz is more negative than that of hematite (Figure 5) (Fuerstenau
et al., 1985), the electrostatic attraction of
quartz by ether aminium is higher owing to hydrogen bonding between silanol groups on the quartz surface and ether aminium ions (Vidyadhar, et al, 2002). This explains
the lower collector concentration required for the lotation of quartz (Figure 2a) com-pared to hematite (Figure 2b), suggesting that ether amine is a more powerful collec-tor for quartz than hematite.
Figure 5 Zeta potential of quartz (a) and hematite (b) at an ionic strength of 10−4 M NaCl and
pH 10.5. I - without reagent; II - ether ami-ne (50 mg/L); III - corn starch (100 mg/L);
IV- MnCl2 (200 mg/L); V - MnCl2 (200 mg/L)/ether amine (50 mg/L); VI - MnCl2 (200 mg/L)/EDTA (600 mg/L); VII - MnCl2 (200 mg/L)/EDTA (600 mg/L)/starch (100
mg/L) and VIII - MnCl2 (200 mg/L)/EDTA (600 mg/L)/starch (100 mg/L)/amine (50 mg/L). Standard deviation of 2.56 mV for quartz and 2.01mV for hematite.
-51.8 -40.94 -43.85 15.8 -18.6 -33 -12.4 -7.8 -60 -50 -40 -30 -20 -10 0 10 20
I II III IV V VI VII VIII
-44.4 -31.4 -38.14 13 -38.44 -43 -8.63 -8.22 -50 -40 -30 -20 -10 0 10 20
I II III IV V VI VII VIII
(m V ) (m V ) (a) (b)
The negative zeta potential moduli of both minerals (quartz and hematite) compared to the values without reagents (Figures 5a I and 5b I) drop after condi-tioning with corn starch (Figures 5a III and 5b III). This is probably related to a partial concealment of the hematite and quartz surface charges by very large adsorbed starch molecules. Based on microlotation tests, isotherm adsorption, zeta potential measurements and infrared spectroscopy, several researchers concluded that starch adsorption on the hematite surface
oc-curs through hydrogen bonding (Kar et
al., 2013) and surface reactions involving
iron ions (Kar et al., 2013, Pavlovic and
Brandão, 2003). Montes-Sotomayor et al.
(1998) reported that starch adsorbed on quartz will desorb in an alkaline medium in the presence of alkylammonium salt according to the collector concentration and pH (competing adsorption), which can explain the stronger depression of hematite compared to quartz (Figures 2a
and 2b).
The zeta potential reversion from negative to positive for quartz and hematite in the presence of MnCl2 (concentration of 200 mg/L = 1.6 × 10⁻³ M) (Figures 5a IV and 5b IV) is probably related to the ad-sorption of Mn species (Mn2(OH)3+ (10−4 M), Mn2+ (10−5.8 M) and MnOH+ (10−5.9 M)) in an aqueous solution at pH 10.5 (Marcel and Smith, 2003, Fuerstenau et al., 1985). After conditioning the minerals
with amine (Figures 5a V and 5b V), the zeta potentials return to negative values. However, the absolute values are smaller than the values determined in conditions I, II and III. Vidyadhar et al. (2002) proved
by infrared spectroscopy that beyond the ether aminium ions and molecular ether amine, the acetate anions adsorb on the quartz surface, which explains the nega-tive zeta potential of quartz conditioned
with MnCl2/amine. Probably the same
behaviour occurred with hematite. The large difference in magnitude between the
negative zeta potentials of hematite and quartz could be related to the adsorption of Cl− anions in the solution (1.6 × 10⁻³ M) on the hematite surfaces, which drops IEP of hematite (Carlson and Kawatra, 2013, Hesleitner et al., 1987). However, the
adsorption of Mn hydroxy complex and the precipitation of Mn(OH)2 suficiently prevent hydrophobicity by ether amine adsorption (Figures 2a and 2b).
EDTA can leach the Fe3+ ions from hematite (Chang and Matijevic, 1983) and
from β-FeOOH (Rubio and Matijevic,
1979) in the range pH 7.5-12. But, the equilibrium time for this reaction is high and its zeta potential did not have a pro-nounced variation as in pH < 7 (speciic adsorption of anionic EDTA species on mineral surface). However, as shown in Figures 5a VI and 5b VI, the zeta poten-tials of quartz and hematite conditioned
with MnCl2/EDTA are more negative
(V), suggesting the complexation of Mn by EDTA. By considering the mass bal-ance of Mn species (Equation 10), from the addition of 600 mg (~1.8 × 10⁻³ M) of EDTA in the solution, where [Mn2+] = 1.6 × 10⁻³ M, the Mn species
concentra-tions in water are [MnEDTA2−] = 2.3 ×
108 M and [Mn
2(OH)3+] = 2.04 × 10⁻¹⁹ M. These results demonstrate that almost all Mn species were complexed by EDTA. The negative zeta potentials of both minerals conditioned with MnCl2/EDTA/ starch (Figures 5a VII and 5b VII) and
with MnCl2/EDTA/starch followed by
amine (Figures 5a VIII and 5b VIII) are less than those of the minerals conditioned
with MnCl2/EDTA (Figures 5a VI and
5b VI). When compared with quartz, the magnitude of the decrease of the negative zeta potential of hematite after MnCl2/ EDTA/starch conditioning is greater. The opposite behaviour is observed for
the minerals conditioned with MnCl2/
EDTA/starch/amine. This is probably related to the high afinity of starch for hematite (hydrogen bonding and iron
ion complexation by starch (Pavlovic and Brandão, 2003) and amine for quartz (electrostatic attraction followed by hydro-gen bonding with the silanol group on the mineral surface (Vidyadhar et al. 2002).
Despite the adsorption of ether aminium ions and ether amine on the hematite surface (Figure 5b VIII), the amount of amine adsorbed on the mineral surface is insuficient to produce surface hydropho-bicity, which explains the low recovery of hematite in the microlotation test in this condition, as presented in Figure 4.
4. Conclusions
Based on the results obtained in this study, we conclude that the de-pression of both quartz and hematite
by Mn2+ specimens is due to :(i) the
adsorption of Mn hydroxy complexes (Mn2(OH)3+ and Mn(OH)+), (ii) Mn2+, and mainly (iii) the precipitation of
Mn(OH)2 on the mineral surfaces.
The addition of EDTA restored the
mineral recoveries through Mn2+
complexation; after conditioning the minerals with starch followed by amine at pH 10.5, only the recovery of quartz was restored. This means that
the selectivity in the reverse cationic lotation of iron ores in pulps contain-ing Mn2+ species is possible when the iron ores are irst conditioned with EDTA at a pH ~7 before additional conditioning with starch and amine at pH 10.5.
5. Acknowledgments
The authors gratefully acknowledges the inancial support provided by the FAPEMIG, CAPES, PROPP/UFOP and CNPq scholarships.
6. References
ARAUJO, A.C., VIANA, P.R., PERES, A. E. C. Reagents in iron ore lotation.
Mine-rals Engeneering.n.18, p. 219-224, 2005.
CARLSON J. J., KAWATRA, S. K. Factors affecting zeta potential of iron oxides.
Mineral Processing and Extractive Metallurgy Review. n. 34, p.269-303, 2013.
CARVALHO, M. R., PERES, A. E. C. Interferência de cátions Ca2+ na deslamagem e
lotação de minério de ferro. Revista Escola de Minas, v. 57, n.2, p. 99-102, 2004.
CROMIÈRES, L., MOULIN, V., FOUREST, B., GIFFAUT, E. Physico-chemical cha-racterization of the colloidal hematite/water interface: experimentation and mo-delling. Colloids and Surfaces A: Physicochemical and Engineering Aspects, v.
202, p. 101–115, 2002.
CHURAEV, N.V., SERGEEVA, I.P., SOBOLEV, V.D., JACOBASCH, H.-J., WEIDE-NHAMMER, P., SCHMITT, F.-J. Modiication of quartz surfaces using cationic surfactant solutions. Colloids and Surfaces A: Physicochemical and Engineering
Aspects, v. 164, p.121–129, 2000.
CHANG, H-C., HEALY, T. W., MATIJEVIC, E. Interactions of metal hydrous oxi-des with chelating agents. III. Adsorption on spherical colloidal hematite particles.
Journal of Colloid and Interface Science, v. 92, n.2, p. 469-478, 1983.
CHANG, H-C., MATIJEVIC, E. Interactions of metal hydrous oxides with chelating agents. VI. Dissolution of hematite. Journal of Colloid and Interface Science, v.
92, n. 2, p. 479-488, 1983.
CRUZ, D. G., LIMA, R. M. F. Inluence of Mn2+ ion in reverse cationic lotation of
iron ore. Revista Escola de Minas, v. 68, n. 3, p. 319-322, 2015.
FILIPPOV, L.O., SEVEROV, V.V., FILIPPOVA, I.V. An overview of the beneiciation of iron ores via reverse cationic lotation. International Journal of Mineral
Proces-sing, v.127, p.62–69, 2014.
FUERSTENAU, M. C. et alli. Chemistry of lotation. American Institute of Mining,
Metallurgical and Petroleum Engineers, Inc. 1985. 177p.
HESLEITNER, P. BABIC, D., KALLAY, N., MATIJEVIC, E. Adsorption of solid/ solution interfaces. Surface charge and potential of colloidal hematite. Langmuir,
v. 3, p.815-820, 1987.
485
depressants for iron ore lotation. Minerals Engineering, v.49, p. 1–6, 2013.
KOU, J., TAO, D., XU, G. A study of adsorption of dodecylamine on quartz surface using quartz crystal microbalance with dissipation. Colloids and Surfaces A:
Phy-sicochemical and Engineering Aspects, v. 368, p. 75–83, 2010.
LELIS, D. F. Inluência dos Cátions Ca2+, Mg2+ e Mn2+ na Flotação Catiônica de
Minério de Ferro: Estudos Fundamentais. Ouro Preto: Escola de Minas,
Univer-sidade Federal de Ouro Preto, 2014. 88f. (Dissertação de Mestrado em Engenharia Mineral).
MA, X. Role of solvation energy in starch adsorption on oxide surfaces. Colloids and
Surfaces A: Physicochememical and Engineering Aspects, v. 320, p. 36–42, 2008.
MARTEL, A.E. SMITH, R. M. NIST critically selected stability constants of metals complexes. In: NIST Standard Reference Database 46, version 7, 2003. CD-ROM. MONTES-SOTOMAYOR, S., HOUOT, R., KONGOLO, M. Flotation of silicated
gangue iron ores: mechanism and effect of starch (Technical note). Minerals
Engi-neering, v. 11, n. I, p. 71-76, 1998.
ORTHGIESS, E., DOBIÁS, B. Complexing agents as modiiers in mineral lotation -
mechanism studies. Colloids and Surfaces A: Physicochemical and Engineering
Aspects, v. 83, p. 129-141, 1994.
PAVLOVIC, S., BRANDÃO, P. R. G. Adsorption of starch, amylose, amylopectin and glucose monomer and their effect on the lotation of hematite and quartz. Minerals
Engineering, v. 16, p. 1117–1122, 2003.
PINHEIRO, V. S., BALTAR, C. A. M., LEITE, J. Y. P. Flotação com amina: a im-portância da qualidade da água. Revista Escola de Minas, v. 65, n. 4, p. 549-552,
2012.
RAO, S. R. Flotation Surfactants, In: _Surface Chemistry of Froth Flotation (2. ed.).
New York: KA/PP ed., 2004. 744p., cap. 9, p. 454-459.
RUBIO, J., MATIJEVIC, E. Interactions of metal hydrous oxides with chelating agents. I. β-FeOOH-EDTA. Journal of Colloid and Interface Science, v. 68, n. 3,
p. 408-421, 1979.
RUMBALL, J. A., RICHMOND, G. D. Measurement of oxidation in a base metal lotation circuit by selective leaching with EDTA. International Journal of Mineral
Processing, v. 48, p. 1-20. 1996.
VIDYADHAR, A., RAO, K. H., CHERNYSHOVA, I. V., PRADIP, FORSSBERG K. S. E. Mechanisms of amine–quartz interaction in the absence and presence of al-cohols studied by spectroscopic methods. Journal of Colloid and Interface Scien-ce, v. 256, p. 59–72, 2002.
WANG, X., FORSSBERG, E. EDTA-Induced lotation of sulide minerals. Journal of
Colloid and Interface Science, v. 140, n.1, p. 217-226, 1990.