Construction of the interaction curve of concrete–
encased composite columns based on the deformation
domains of reinforced concrete sections
Construção da curva de interação para pilares mistos
de aço e concreto totalmente revestidos com base nos
domínios de deformação de seções de concreto armado
Abstract
Resumo
This paper proposes a methodology for obtaining the interaction curve for composite steel–concrete sections subject to combined compression and bending based on the deformation domains of reinforced concrete structures deined by ABNT NBR 6118 [1]. For this, were developed ex-pressions for the axial force, the moment and the strains of concrete, longitudinal reinforcement and the elements comprising the metal proile in each deformation domain. Based on these expressions a computer program called MDCOMP (2014) was created. In this study the same limit values of longitudinal reinforcement strain deined by ABNT NBR 6118 [1] were used for the steel proile strains. To verify the numerical imple-mentations performed, the interaction curves and the plastic resistance of the section obtained by MDCOMP program were compared with those determined from the recommendations of Eurocode 4 [2], of ABNT NBR 8800 [3] or literature responses.
Keywords: composite steel–concrete columns, deformation domains, interaction curve, reinforced concrete.
Neste trabalho se propõe uma metodologia para a obtenção da curva de interação para seções mistas de aço e concreto, sujeitas à lexão com-posta normal, com base nos domínios de deformação de estruturas de concreto armado deinidos pela ABNT NBR 6118 [1]. Para isso, foram desenvolvidas expressões para o esforço normal, o momento letor e para as deformações do concreto, das armaduras e dos elementos que compõem o peril metálico em cada domínio de deformação. Com base nessas expressões criou–se um programa computacional denominado MDCOMP (2014). Neste trabalho utilizaram–se como valores limites das deformações do peril metálico nos trechos comprimidos e tracionados, os mesmos estabelecidos pela ABNT NBR 6118 [1] para as deformações das armaduras de aço. Para veriicar as implementações numéricas realizadas, as curvas de interação e os esforços máximos de plastiicação da seção obtidos com o programa MDCOMP (2014) foram comparados com os determinados a partir das recomendações do EUROCODE 4 [2], da ABNT NBR 8800 [3] ou com respostas da literatura.
Palavras-chave: pilares mistos de aço e concreto, domínios de deformação, curva de interação, concreto armado.
P. A. S. ROCHA a
paulorocha@em.ufop.br
K. I. DA SILVA a
1. Introduction
A composite steel–concrete system is every system in which a rolled, folded or welded steel proile works with reinforced con-crete. Among the various systems, we can mention composite col-umns, beams, slabs and connections.
Composite structures appeared in the United States in the late nineteenth century, more precisely in 1894, with the initial purpose of protecting metals against corrosion and ire. Researches by Fa-ber [4] and Jones and Rizk [5] allowed assessing the contribution of concrete to the structural performance of composite structural systems subject to axial loads (composite columns).
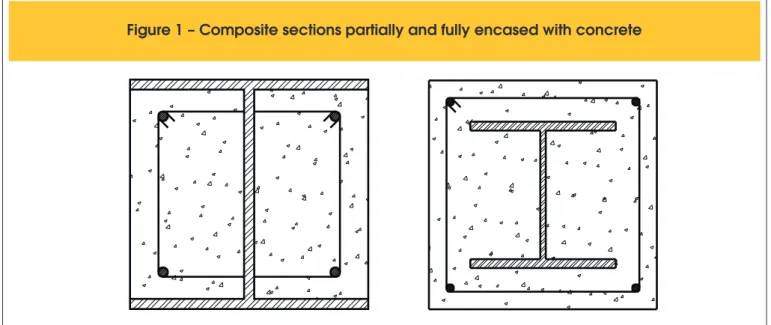
Some of the advantages of composite systems are, for instance, a considerable reduction of the structural steel consumption, the possibility of not needing forms and propping, a reduction of the own weight and volume of the structure and an increase in the dimensional accuracy of the construction. Moreover, when com-posite structures are compared with concrete and steel structures, there is an increase of the section’s stifness and strength, the elimination or reduction of local buckling in metal proiles, the pro-tection against the proile’s corrosion, and inally, an increased ire resistance especially in completely concrete encased columns. Figure 1 shows two usual cross–sections of composite columns, one of which is partially encased with concrete and the other fully encased with concrete.
The mixing of concrete and steel in composite columns subject to simple compression or to the simultaneous action of axial com-pressive force and bending moments is also a way to leverage the advantages of both materials in order to ind the best struc-tural solution.
The irst studies on composite steel–concrete columns date from the 60s. Jones and Rizk [5] studied the behavior of fully concrete encased columns taking into account variables such as column length, dimensions of the cross–section and volume of the piece reinforcement and, based on this study, they concluded that the concrete encased steel proile greatly contributed to increasing its load capacity, compared with a steel column.
In [6] the results of tests made with 22 composite columns fully en-cased with concrete, subject to bending around the lower inertia axis, with load applied by considering diferent eccentricities. The two fail-ure modes observed after a certain applied load level were the con-crete crushing on one side close to the top of the steel proile, and the concrete crushing on one side and the yielding of steel under com-pression, together with cracks in concrete on the opposite side. Naka et al. [7] show the results of the experimental analysis of four composite columns with supported ends and subject to bending in relation to the greatest inertia axis. The results indicated that the failure mode of the columns was divided into two categories: concrete crushing and local buckling of the metal proile lange in the compressed side; concrete crushing, buckling of the steel rein-forcements under compression and yielding of the reinrein-forcements on the tensioned side.
Yamada et al. [8] analyzed composite columns subject to the com-bination of axial forces and transverse loads applied to the extremi-ties of the column, considering bending of the structural system in relation to the greatest inertia axis. In most models studied, there was a reduction in the maximum load capacity of the column when the concrete started cracking and the reinforcement bars started yielding in the tensioned region.
Ricles and Paboojian [9] show the experimental results of eight composite columns fully encased with concrete, with cross–sec -tion dimensions equal to 406mmx406mm and shear connectors. Columns were subject to bending in relation to the greatest inertia axis and tested under monotonic axial load and cyclic lateral load. It was veriied that the maximum load caused the yielding of the metal proile lange and of the reinforcing bars, and that shear con-nectors were not efective in improving the lexural strength. Mirza et al. [10] studied the behavior of sixteen 4m long columns, fully encased with concrete, subject to bending in relation to the greatest inertia axis, taking into account the second order efects in the analysis. The tests carried out showed that the concrete strain in the most compressed iber ranged from 0.0025 to 0.004 before the models collapsed. The presence of shear connectors had little inluence on the ultimate capacity of the composite column.
Yokoo et al. [11] performed experimental analysis on nineteen short composite columns fully encased with concrete with
30 =
ck
f MPa. In this experimental program, large cracks were
identiied on the lower side of the models and the failure oc-curred due to concrete crushing. The conclusion was that short columns show a failure mechanism characterized by the yield-ing of steel and concrete crushyield-ing and thus are not inluenced by second order efects.
Slender columns, in turn, are subject to geometric imperfections capable of amplifying acting forces, resulting in buckling and characterizing the so-called stability criterion. They behave in-elastically and fail due to the partial inelasticity of steel, concrete crushing in the compressed region and cracking of concrete in the tensioned region.
Other important efects in those structures such as ductility and energy dissipation capacity of composite columns fully encased with concrete have been investigated and are being explored in Japan and North America. Among some important works, we can mention the researches carried out by Wakabayashi et al. [12, 13].
Liew et al. [14] demonstrated, from studies on composite col-umns partially and fully encased with concrete, that the results of the design of composite columns deined by Eurocode 4 [2], British code BS 5400 [15] and AISC/LRFD [16] were not neces-sarily the same. Such diferences have been attributed to dif-ferent values of load and resistance factors and to the design considerations regarding creep concrete and load eccentricity. Saw and Liew [17] presented the evaluation of the design of composite columns with I sections partially and fully encased with concrete and with tubular sections illed with concrete, based on criteria established by Part 1.1 of Eurocode 4 [2], by part 5 of British code BS 5400 [15] and by the American code AISC/LRFD [16]. In this research, design parameters were stud-ied and comparisons were made between the nominal strength predicted by the three codes and the predicted strengths with the experimental tests results. In some cases, the results ob-tained from normative codes varied considerably due to diferent project considerations regarding each code. However, design procedures in general showed more conservative responses when compared with the results of experimental tests. In turn, EUROCODE 4 [2] presents important favorable factors in terms of its scope and broad range of application.
For columns subject to pure compression, concrete strain limit is of 0.2%. Thus, in order to prevent the premature collapse of the concrete in the element, the steel strain of the proile and reinforcements shall also be limited to this value [18].
Weng and Yen [19] investigated the diferences between the approaches of code ACI 318 [20] and AISC/LRFD [16] for the design of composite steel–concrete columns fully encased with concrete and evaluated how their results were close to the re -sponses of a real column. This was conirmed by a series of sta-tistical comparisons. Studies were conducted in order to com -pare estimated relevant issues using the codes ACI 318 [20] and AISC/LRFD [16]. These approaches were compared with results of composite columns fully encased with concrete ob-tained in previous researches. Among such researches, we may mentioned the physical tests conducted by Stevens [6], Naka et al. [7], Yamada et al. [8], Ricles and Paboojian [9], Mirza et al.
Among the numerical modeling of composite steel–concrete columns, Fong [21] points out that many codes tend to recom-mend the use of a second order analysis and design method to eiciently obtain more accurate results. Some recent studies were developed to obtain numerical formulations for advanced analysis of composite steel–concrete structures, based on the reined plastic hinge method.
An efective numerical procedure for the construction of the in-teraction curve of composite steel–concrete columns is the iber method consisting in the subdivision of the cross–section area in smaller single material regions, distributed along the length of the column [22].
In this paper, we propose a calculation procedure based on the deformation domains of reinforced concrete sections, as shown in Figure 2, to obtain the interaction curve of composite col-umns fully encased with concrete in a computational manner. This approach was adopted due to the similarities found be-tween the interaction curves of reinforced concrete sections and composite steel–concrete sections. The computational package developed is called MDCOMP (2014) and was implemented in FORTRAN language. Results obtained using MDCOMP (2014) are compared with the responses deined by Part 1.1 of Euro-code 4 [2], which is one of the most important Euro-codes used to design this type of structural element, and also with the answers presented in the works of Saw and Liew [17], Weng and Yen [19] and Naka et al. [7].
2. Interaction curve of composite column
cross section
The interaction curve is the geometric locus of M–N pairs that de-ine the limits of strength of the cross–section of a structural mem-ber under combined compression and bending.
Figure 3 shows the curve adopted by Part 1.1 of Eurocode 4 [2], as well as the simpliied polygonal diagram adopted by NBR 8800 [3], which is represented by the dotted curve in Figure 3. In this case, we shall consider that there is a total plastic stress distribution be-tween points A, which corresponds to the maximum axial force, and D, which is the maximum bending moment.
Figure 2 – Deformation domains for
reinforced concrete sections
1
2 3
4
5 4a
h
000
2 0
00 3.5
0 00 10
axial force on the piece, thus concrete, metal proile and steel rein-forcements are subject to compressive normal force, with
(1a)
, A pl Rd
N
=
N
and
M
A=
0
At point B, column is subject only to pure bending, where
(1b)
0
BN
=
and
M
B=
M
pl Rd,At point C, we ind the combination of axial load and bending, i.e.,
(1c)
,
.
c ckC pm Rd
c
0 85 A f
N
=
N
=
g
e
M
C=
M
pl Rd,and at point D, we see
(1d)
,.
.
.
c ckD pm Rd
c
0 85A f
N
=
0 5 N
=
0 5
g
and
max, ,
D pl Rd
M
=
M
being the maximum design value of the plastic resistance moment of the composite section,
M
max,pl Rd, , calculated with the help of thesum of plastic resistances of each element forming section, from the following expression:
(1e)
Point E is located on the average point of the curve between points A and C.
In the above equations,
N
pl Rd, is the design value of the plasticresis-tance of the composite section to compressive normal force,
N
pm Rd, isthe design value of the resistance of the concrete to compressive nor-mal force,
M
pl Rd, is the design value of the plastic resistance momentof the composite section and
Z
Pa,Ps
Z
,Z
Pc are, respectively, theplas-tic resistance modulus of steel proile, reinforcement bars and concrete.
3. Deinition of balance and deformation
equations
Figure 4 schematically shows the strain diagram of the compos-ite section fully encased with concrete, as well as the resulting forces acting on the section.
Figure 3 – Interaction curve according to EUROCODE 4 [2]
A
E
C
D
B
N
M
,
pl Rd
N
,
pm Rd
N
,
0.5
N
pm Rd,
pl Rd
M
M
max, ,pl RdFigure 4 – Composite section and strain diagram with scheme of resultant forces
y=
0.
8x
c
e
s
¢
e
si
e
s
e
t
id
¢
d¢
x
x
c
yc
ch
c
b
s
F
¢
sp
F
¢
si spi
F
+
F
x
F
csp
F
s
F
In this igure,
F
s′
,F
sp′
,F
si,F
spi,F
sp andF
s are, respectively, theresulting forces on the upper reinforcements of the composite sec-tion, on the top lange of the metal proile, on the generic reinforce-ments located between the proile langes, on the web of the metal proile, on the bottom lange of the metal proile and on the bottom reinforcements of the composite section.
Considering the equilibrium of normal force and bending moment in the section, we ind:
(2)
1
n
Rd c i
i
N
F
F
=
= -
+
å
(3)
(
)
1
0.4
2
n
Rd d c i i
i
h
M
N
F h
x
F t
=
=
+
-
-
å
The sums of the equations above correspond to the contributions of forces and bending moments of concrete, reinforcements and metal proile.
The position of the neutral axis of the composite section (x) is
deined based on the relation
(4)
cc s
x
e
e
e
=
+
where
ε
c is the concrete strain,ε
s is the lower reinforcement’ssteel strain and
d
′
is the distance from the centroid of steel rein-forcements and the edge of the composite steel–concrete section, which results from:(5)
.
¢ = + +
t ld
c
f
0 5
f
In Eq. 5,
c
is the thickness of concrete cover,φ
t is the diameterof the transverse reinforcement (stirrups) and
φ
l is the diameter of the longitudinal reinforcement.Equations that relate the strain of steel reinforcements and of the elements making up the metal profile with concrete strain are:
(6a)
(
)
c s
x d
x
e
e
¢ =
-
¢
(6b)
(
-
)
= -
c sd x
x
e
e
(6c)
(
0.5 )
c y f
sp
x c
t
x
e
e
¢ =
-
-(6d)
(
- -
-
0.5 )
=-
c c y fsp
h
x c
t
x
e
e
(6e)
(
- +
¢
-
0.5 )
=-
c cspi
d x d
h
x
e
e
In the above equations,
ε′
s andε
sare, respectively, the strains of upper and lower steel reinforcements,ε
sp′
andε
sp are the strains of the upper and lower lange of the metal proile, re-spectively,ε
spi is the strain of the metal proile web,d
is the distance between the steel reinforcement in tension to the ex-treme iber of the composite section on the compressed side (efective height of the composite section),c
y is the thickness of concrete cover andh
c is the depth of the concrete encase-ment to a steel section (see Fig. 4).In this study, the strain of steel reinforcements and metal proile were limited to 1% in traction and 0.35% in compression, as de-termined by ABNT NBR 6118 [1], since concrete does not show strains beyond these limits.
As in domain 5, the neutral axis is outside the reinforced con-crete section, i.e.,
h
c< < +∞
x
, ensuring the equilibrium of forcesand moments in the section, not taking into account the strength portion corresponding to reinforcements, and setting the moment equation equal to zero, the limit amount of the neutral axis posi-tion in this domain is reached and equal to x = 1.25h.
The limit value
x
for the composite steel–concrete section was obtained in a manner similar to that described above for the reinforced concrete section, but considering the portion of strength related to concrete and metal proile. Thus, the equilib-rium of forces and moment on section provides:(7)
Rd c a yd
N
= - +
F
A f
and
(8)
(
0.4
)
2
=
+
-Rd Rd c
h
By substituting (7) by (8) and doing MRd=0, taking into
ac-count that Fc = 0.85 fcd b x, we reach the following second
de-gree equation:
(9)
0 0.85
=
f b
cd0.8 (0.5
x
h
-
0. 4 )
x
+
A f
a y0.5
h
The largest root of equation (9), x = 2.305h, corresponds to a null
value for the bending moment and to the maximum value for the axial force in the section and is, therefore, the limit value for the po-sition of the neutral axis of the composite steel–concrete section.
4. Examples
This section presents the interaction curves of cross–sections of a reinforced concrete column and various cross–sections of posite steel–concrete columns obtained numerically from the
com-Figure 5 – Interaction curve of the cross–section
of a reinforced concrete column
0 10 20 30 40 50 60 70 80
Momento (kNm)
0200 400 600 800 1000 1200 1400 1600
N
or
m
al
(k
N
)
MDCOMP (2014) hc
bc
puter program MDCOMP (2014). Comparisons are made, where possible, with the curves obtained according to current codes and/ or with the answers provided by other researchers.
4.1 Interaction curve of the cross–section
of a reinforced concrete column
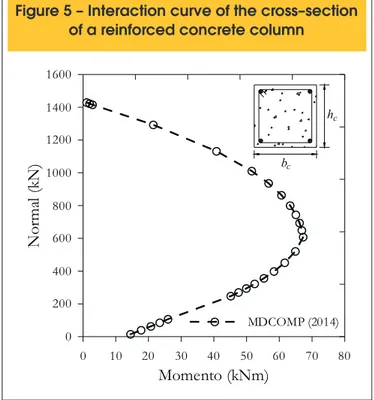
In this example, we analyze the cross–section of a reinforced concrete column with section 33.3cm×33.4cm. The concrete has
20 =
ck
f MPa and longitudinal reinforcement consists of four CA50 steel bars with a φl =10mm diameter, as to know d′ =3.5cm.
Figure 5 shows the interaction curve moment x normal for the section obtained from the variation of the concrete and steel strains within the six deformation domains (see Figure 2). The portion of the curve cor-responding to combined tension and moment, which includes domain 1 and a portion of domain 2, was deleted, i.e., only portions referring to the section behavior under compression and bending are presented.
4.2 Interaction curve of the cross–section
of a composite steel–concrete column
In this example, we ind the analysis of the cross–section of a com-posite steel–concrete column formed by a Gerdau rolled metal pro-ile
W
250 73
×
kg m
and considering three diferent values for the depth and width of the concrete encasement to the steel section, i.e.,h
c andb
c, as shown in Table 1.In Table 1, ρs is the ratio of the area of the steel proile
cross–sec-tion (
A
a) and the area of the concrete cross–section (A
c).T h e concrete used has fck =20MPa, four CA50 steel bars
with a φl =10mm diameter for the longitudinal reinforcement and 3.5
′ =
d cm.
Table 1 – Sizes of concrete cross–section
Composite section
hc (mm)
bc (mm)
cy (cm)
a s
c A
%
A
r =
SM1 333 334 4.0 8.33
SM2 403 454 7.5 5.10
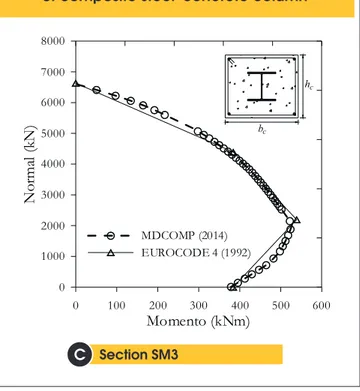
SM3 553 654 15.0 2.56
Figure 6 – Interaction curve of cross–sections
of composite steel–concrete column
0 50 100 150 200 250 300
Momento (kNm)
0500 1000 1500 2000 2500 3000 3500 4000
N
or
m
al
(k
N
)
MDCOMP (2014) EUROCODE 4 (1992)
bc
hc
Section SM1
In the graphs shown in Figure 6, we see the interaction curves moment x normal obtained with the MDCOM computational pack-age (2014) for the three composite steel–concrete sections, being compared to the curves obtained based on the EUROCODE 4 [2] considerations.
Tables 2 and 3 show, respectively, the numerical results of design value of the resistance to moment and normal force to the com-posite steel–concrete section and comparisons with responses ob-tained based on the recommendations of Eurocode 4 [2].
4.3 Comparison with results found in books
In this section, we make a comparison between the results of the MDCOMP computer program (2014) and the responses obtained by other researchers or from current codes.
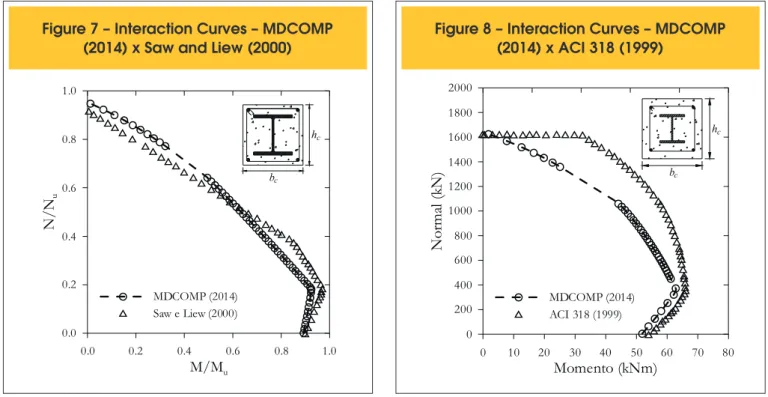
The irst interaction curves shown refer to the cross–section of a
composite steel–concrete column previously analyzed by Saw and Liew [17] in accordance with the recommendations of Eurocode 4 [2]. The section is formed by a UC254 254 107× × kg m steel proile with fy=355MPa, four steel bars with fyk=460MPa
and longitudinal reinforcement with φl =12.5mm, concrete with
20
ck
f = MPa and bc= =hc 400mm dimensions.
The interaction curves obtained in this analysis are presented in Figure 7.
Table 4 presents the comparisons between the resistant capabili -ties obtained with the MDCOMP program (2014) and the ones ob-tained by Saw and Liew [17].
The second comparison was made with an interaction curve ob-tained from the recommendations of the American code ACI 318 [20]. For this analysis, we used a section with bc= =hc 240mm (fck=25.6MPa), which fully covers a metal proile
96 100 5.1 8.6× × ×
H mm (fy=311.2MPa and four steel bars
Figure 6b – Interaction curve of cross–sections
of composite steel–concrete column
Section SM2
B
0 50 100 150 200 250 300 350 400
Momento (kNm)
0 500 1000 1500 2000 2500 3000 3500 4000 4500 5000
N
or
m
al
(k
N
)
MDCOMP (2014) EUROCODE 4 (1992)
hc
bc
Figure 6c – Interaction curve of cross–sections
of composite steel–concrete column
Section SM3
C
0 100 200 300 400 500 600
Momento (kNm)
0 1000 2000 3000 4000 5000 6000 7000 8000
N
or
m
al
(k
N
)
MDCOMP (2014) EUROCODE 4 (1992)
hc
bc
Table 2 – Maximum design value of the plastic resistance moment (M
max,pl,Rd)
and design value of the plastic resistance moment (M
pl,Rd)
Composite section
M
max,pl,Rd (kNm)M
pl,Rd (kNm)EC4 MDCOMP MMDCOMP
MEC4 EC4 MDCOMP
MMDCOMP MEC4
SM1 291.28 270.44 0.93 291.28 270.44 0.99
SM2 346.98 330.31 0.95 346.98 330.31 0.99
with fyk=634MPa and φ =l 10mm for longitudinal reinforce-ments. We found ρs=3.7% and ρr =0.5 %, where
ρ
r is the steel rate of the longitudinal reinforcement (ρ =r As Ac). Resultsare shown in Figure 8.
Table 5 shows comparisons between the resistant capabilities ob-tained with the MDCOMP program (2014) and the ones deined by the American code ACI 318 [20].
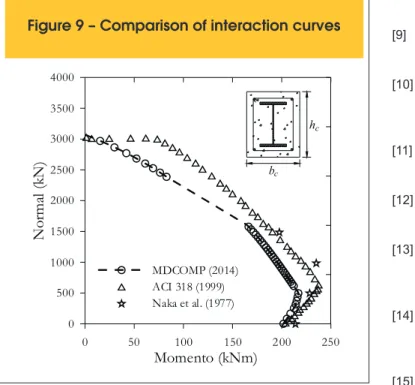
In the last analysis, another comparison of MDCOMP program (2014) results was made with those obtained from the recommen-dations of the American code ACI 318 [20] and with the experimen-tal results presented by Naka et al. [7].
The analyzed cross–section is formed by a steel proile 180 120× ×4.5 12×
H mm (fy=344.8MPa) encased with concrete
with fck =25.5MPa, and bc=240mm and hc=300mm dimen-sions. Four steel bars fyk =461.3MPa and φ =l 10mm were used
for longitudinal reinforcement. We found ρs =4.6 % and ρr=3.2 %. Graphs in Figure 9 show the interaction curves obtained in this analysis.
5. Conclusions
In this paper, we presented a methodology that allows the con-struction of the interaction curve for composite steel–concrete sec-tions subject to combined compression and bending, based on the deformation domains of reinforced concrete structures deined by ABNT NBR 6118 [1]. To this end, relationships were described for the strains of reinforcements and elements comprising the metal proile, according to the strains of concrete, as well as equations for the normal force and bending moment in each deformation do-main. From these expressions, the M–N pairs were determined in the ultimate limit state, needed to build the interaction curve. Tables 2 to 5 show that the design value of the plastic resistance to compressive normal force (
N
pl Rd, ), the design value of the plasticresistance moment (
M
pl Rd, ) and the maximum design value of theplastic resistance moment (
M
max,pl Rd, ) of the composite sectionTable 3 – Design value of the plastic resistance
to compressive normal force (N
pl,Rd)
Composite section
N
pl,Rd (kN)EC4 MDCOMP NMDCOMP
NEC4
SM1 3618.22 3553.66 0.98
SM2 4465.09 4430.69 0.99
SM3 6635.02 6602.54 0.99
Figure 7 – Interaction Curves – MDCOMP
(2014) x Saw and Liew (2000)
0.0 0.2 0.4 0.6 0.8 1.0
M/M
u0.0 0.2 0.4 0.6 0.8 1.0
N
/N
u
MDCOMP (2014) Saw e Liew (2000)
hc
bc
Table 4 – Parameterized maximum design
value of the plastic resistance moment
(M
max,pl,Rd), design value of the plastic resistance
moment (M
pl,Rd) and design value of the plastic
resistance to compressive normal force (N
pl,Rd)
Force EC4 MDCOMP MDCOMP
EC4
M
max,pl,Rd/M
u 0.97 0.92 0.95M
pl,Rd/M
u 0.90 0.89 0.99N
pl,Rd/N
u 0.92 0.96 1.04Figure 8 – Interaction Curves – MDCOMP
(2014) x ACI 318 (1999)
0 10 20 30 40 50 60 70 80
Momento (kNm)
0 200 400 600 800 1000 1200 1400 1600 1800 2000
N
or
m
al
(k
N
)
MDCOMP (2014) ACI 318 (1999)
hc
obtained from MDCOMP computer program (2014), which is based on relationships deined by NBR 6118 [1], are very close to those set by both the EUROCODE 4 [2] and ACI 318 [20]. From the graph in Figure 9, we can ind that in the comparison between the experimental results of Naka et al. [7], the approach of ACI 318 [20] provides more precisely than the procedure based on deformation domains recommended by NBR 6118 [1], although the results cor-responding to maximum resistances (
N
pl Rd, andM
pl Rd, ) are very similar in the two processes.With regard to the variation rate of the steel in the metal proile in the composite section (
ρ
s), we may verify that the smaller thevalue, the more the curve approaches the theoretical
graphic for composite steel–concrete columns deined by EURO-CODE 4 [2] (see Figure 6 and Tables 2 and 3). This is evidenced by comparing curve in Figure 6c with curve in Figure 3.
Finally, it is clear from the examples analyzed that the numerical results obtained via MDCOMP (2014) showed a good correlation
with the interaction curves deined by Eurocode 4 [2], but there were some discrepancies with the answers deined by ACI 318 [20] (see Figures 8 and 9). This is due to the diferent values of partial safety factors for strength and loads, as well as to design consid-erations regarding creep concrete and load eccentricity adopted by each code.
6. References
[1] ASSOCIAÇÃO BRASILEIRA DE NORMAS TÉCNICAS (2003), NBR 6118:2003. Projeto de estruturas de concreto armado. Rio de Janeiro, RJ.
[2] EUROPEAN COMMITTEE FOR STANDARDIZATION (1992), EUROCODE 4, Design of composite steel and con-crete structures – Part 1.1: General rules and rules for build-ings, CEN, Bruxelas, Belgium.
[3] ASSOCIAÇÃO BRASILEIRA DE NORMAS TÉCNICAS (2008), NBR 8800:2008. Projeto e execução de estruturas de aço e de estruturas mistas aço–concreto de edifícios: Projeto de revisão. Rio de Janeiro.
[4] Faber, O. (1956), Savings to be afected by the more rational design of encased stanchions as a result of recent full size tests, The Structural Engineer, vol. 34, pp. 88–109.
[5] Jones, R. and Rizk, A.A. (1963), An investigation on the be-haviour of encased steel columns under load, The Structural Engineer, Vol. 41, N° 1, pp. 21–33.
[6] Stevens, R.F. (1965), Encased stanchions, The Structural Engineer, 43(2), pp. 59–66.
[7] Naka, T., Morita, K. and Tachibana, M. (1977), Strength and hysteretic characteristics of steel–reinforced concrete col-umns (in Japanese), Transaction of AIJ; 250, pp. 47–58. [8] Yamada, M., Kawamura, H., and Zhang, F. (1991), Research
on the elasto–plastic deformation and fracture behaviors of wide lange steel encased reinforced concrete columns sub-jected to bending and shear (in Japanese), Journal of Struc-tural Construction Engineering, AIJ ArchitecStruc-tural Institute of Japan); 420, pp. 63–74.
[9] Ricles, J.M. and Paboojian, S.D. (1994), Seismic perfor-mance of steel–encased composite columns, Journal of Structural Engineering, ASCE; 120(8), pp. 2474–2494. [10] Mirza, S.A., Hyttinen, V. and Hyttinen, E. (1996), Physical
tests and analyses of composite steel–concrete beam–col-umns, Journal of Structural Engineering, ASCE; 122(11), pp. 1317–1326.
[11] Yokoo, Y., Wakabayashi, M. and Suenaga Y. (1967), Experi-mental studies on steel concrete members with H–shape steel (in Japanese). Transaction of AIJ; 136, pp. 1–7. [12] Wakabayashi, M., Shibata, M., Matsui, C. and Minami, K.
(1974), A study on the behaviour of steel–reinforced concrete columns and frames. In: IABSE Symposium, pp. 53–60. [13] Wakabayashi, M. (1987), A historical study of research on
composite construction in Japan. In: Composite construction in steel and concrete. Proc. of eng. foundation conf. Hen-niker, New Hampshire: ASCE, pp. 400–427.
[14] Liew, J.Y.R., Saw, H.S. and Yu, C.H. (1998), Composite col-umn design in buildings – Assessment of current methods and interim guidance. Research Report n. CE 026/98, Na-tional University of Singapore, May.
Table 5 – Maximum design value of the plastic
resistance moment (M
max,pl,Rd), design value
of the plastic resistance moment (M
pl,Rd) and
design value of the plastic resistance to
compressive normal force (N
pl,Rd)
Force ACI 318 MDCOMP MDCOMP
ACI318
M
max,pl,Rd(kNm)
66.00 62.91 0.95M
pl,Rd(kNm)
53.95 51.88 0.96N
pl,Rd(kN)
1622.19 1644.11 1.01Figure 9 – Comparison of interaction curves
0 50 100 150 200 250
Momento (kNm)
0 500 1000 1500 2000 2500 3000 3500 4000
N
or
m
al
(k
N
)
MDCOMP (2014) ACI 318 (1999) Naka et al. (1977)
hc
Part 5, Code of practice for design of composite bridges. London: British Standards Institution.
[16] AISC/LRFD (1993), Load and Resistance Factor Design Speciication for Structural Steel Buildings, 1st edn., Ameri-can Institute of Steel Construction, AISC, Chicago, IL. [17] Saw, H.S. and Liew, J.Y.R. (2000). Assesment of Current
Methods for the Design of Composite Columns in Buildings. Journal of Constructional Steel Research, v. 53, p. 121–147. [18] Queiroz, G., Pimenta, R.J. and Da Mata, L.A.C. (2001), El-ementos das Estruturas Mistas Aço–Concreto, Belo Hori-zonte, 1ª edição, Editora O Lutador.
[19] Weng, C.C. and Yen, S.I. (2002). Comparisons of Concrete– encased Composite Column Strength Provisions of ACI Code and AISC Speciication, v. 24, p. 59–72.
[20] Buildings code requirements for Structural Concrete (ACI 318–99) (1999). Detroit (MI): American Institute (ACI). [21] Fong, M. (2012). Second–order analysis of imperfect light–
weight and composite structures. Doctoral thesis, Depart-ment of civil and structural engineering, The Hong Kong Polytechnic University, Hong Kong, China.
![Figure 3 shows the curve adopted by Part 1.1 of Eurocode 4 [2], as well as the simpliied polygonal diagram adopted by NBR 8800 [3], which is represented by the dotted curve in Figure 3](https://thumb-eu.123doks.com/thumbv2/123dok_br/18860799.417896/3.892.457.829.171.463/figure-adopted-eurocode-simpliied-polygonal-diagram-adopted-represented.webp)
![Figure 3 – Interaction curve according to EUROCODE 4 [2] A E C D BN M,pl RdN,pm RdN0.5Npm Rd, , pl RdM M max, , pl Rd](https://thumb-eu.123doks.com/thumbv2/123dok_br/18860799.417896/4.892.444.831.184.505/figure-interaction-curve-according-eurocode-rdn-rdn-npm.webp)