THIS REPORT WAS PREPARED BY “STUDENT’S NAME”, A MASTERS IN FINANCE STUDENT OF THE NOVA SCHOOL OF BUSINESS AND ECONOMICS, EXCLUSIVELY FOR ACADEMIC PURPOSES. THIS REPORT WAS SUPERVISED BY ROSÁRIO ANDRÉ WHO REVIEWED THE
VALUATION METHODOLOGY AND THE FINANCIAL MODEL. (SEE DISCLOSURES AND DISCLAIMERS AT END OF DOCUMENT)
See more information at WWW.NOVASBE.PT Page 1/36
M
ASTERS IN
F
INANCE
E
QUITY
R
ESEARCH
After a careful and detailed analysis, we recommend a
price per share of 14.56 €, which corresponds to an expected return of 15.07%.
The E&P segment is the main value creator of Galp’s portfolio, with the major investments by the firm being allocated here. Currently, these enclose primarily the Brazilian fields, taking special attention in Lula, and the NG reserves in Mozambique. A concession agreement with Sinopec was closed, which, in exchange for a 30% share of Petrogal, Galp acquired an increase in capital that became beneficial for the continuing rise of expenses.
In R&M, with the conversion project finished, Galp’s refineries gained new levels of productivity, also allowing the firm to increase its own refining margins. Although the market shares of
supermarkets have been growing, Marketing’s performance has
continued relatively stable.
The G&P continues to function steadily. No major future events are expected to happen and/or affect directly Galp’s transactions in the near future, either in the regulated and liberalized markets.
Company description
Galp Energia is a Portuguese energy company, whose stock is listed in the Euronext Lisbon stock exchange since 2006. It is one of the largest firms in Portugal in terms of market capitalization, thus being enlisted in the PSI-20 Index. Founded in 1999, it is divided into three segments and operates in 13 countries. Also, it is the only refining company in the Portugal.
G
ALP
E
NERGIA
C
OMPANY
R
EPORT
O
IL
&
G
AS
3
J
UNE2013
S
TUDENT
:
C
ARLOS
A
NTUNES
[email protected]
Major focus on E&P
Brazil is the main key of the equation
Recommendation: BUY
Vs Previous Recommendation BUY
Price Target FY13: 14.56 €
Vs Previous Price Target 14.56 €
Price (as of 3-Jun-13) 12.65 €
Reuters: GALP .LS, Bloomberg: GALP PL
52-week range (€) 8.33-13.29
Market Cap (€m) 10.133
Outstanding Shares (m) 829.251
Free float 30,32%
Source: Bloomberg
Source: Bloomberg
(Values in € millions) 2012 2013E 2014F Revenues 18.644 17.905 18.653 EBITDA 1.038 1.296 1.460
EBIT 542 570 475
Net Profit 343 293 231
EPS 0,41 0,35 0.29
GALP ENERGIA COMPANY REPORT
PAGE 2/36
Table of Contents
TABLE OF CONTENTS ... 2
COMPANY OVERVIEW ... 3
COMPANY DESCRIPTION ... 3
SHAREHOLDER STRUCTURE ... 4
EXPLORATION & PRODUCTION ... 4
MARKET OVERVIEW ... 4
BRAZIL ... 6
ANGOLA ... 9
VALUATION ... 12
REFINING & MARKETING ...13
MARKET OVERVIEW ... 13
REFINING ... 15
MARKETING ... 16
VALUATION ... 17
GAS & POWER ...18
MARKET OVERVIEW ... 18
GAS ... 19
VALUATION ... 21
POWER ... 21
VALUATION ... 22
COMPANY VALUATION ...23
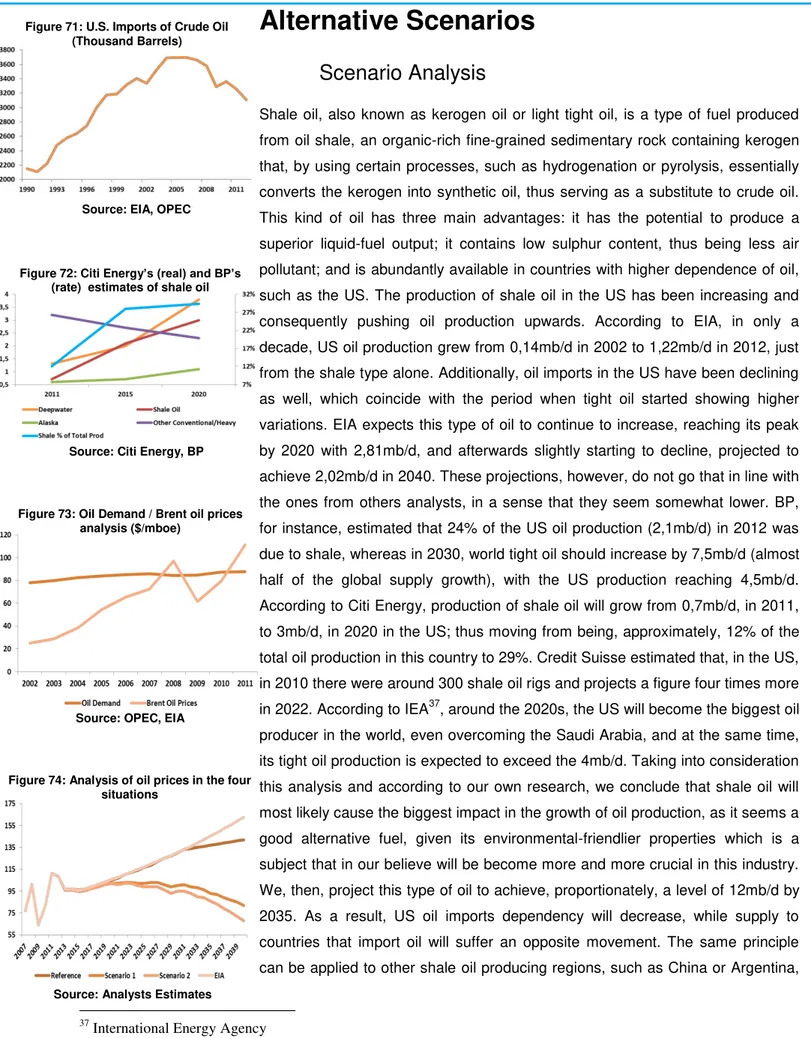
ALTERNATIVE SCENARIOS ...25
SCENARIO ANALYSIS ... 25
SENSITIVITY ANALYSIS ... 28
FINANCIALS ...28
APPENDIX ...30
ANNEX 1: COMPARABLES ... 30
ANNEX 2: DIESEL / GASOLINE PRICES COMPARISON ... 31
ANNEX 3: DIRECTIVE 2003/96/EC ... 32
ANNEX 4: SPECIAL REGIME ... 33
FINANCIAL STATEMENTS ...34
GALP ENERGIA COMPANY REPORT
PAGE 3/36
Company overview
Company description
Galp Energia is a Portuguese energy company that was founded in 1999. Galp is the main oil and natural gas operator in Portugal and operates into three major business segments: Exploration & Production (E&P), Refining & Marketing (R&M) and Gas & Power (G&P).
In the E&P segment, Galp operates in over 50 projects located over 10 countries, with Brazil, Angola and Mozambique being currently the most important ones. This segment first started in Angola, at the Safueiro field, but has since then added several other projects, with block-14 as the most profitable one over the past years, being now in a decaying phase. In 1999, Galp started operating in Brazil by participating in the second bidding round for the award of exploration rights in the country. Nowadays, Brazil is the biggest value creator for this segment. There, Galp operates, through a partnership with Petrobras, in a total of 15 offshore and 5 onshore projects. Among these, emphasis should be given to the Cernambi and Lula fields (Santos basin), whose joint production accounts for approximately 8,3 million barrels of oil and natural gas. Moreover, in the case of Mozambique, Galp operates under a farm-in agreement (10%) with ENI and Empresa Nacional de Hidrocarbonetos (ENH), in the exploration of area 4 in the Rovuma basin's ultra-deep water. With a 27 Tcf1 of natural gas-initially-in-place,
this area has become a higher priority, even though, due to the country’s poor
quality infrastructures, it requires an enormous amount of investment in order to properly extract the natural gas.
The Refining part of the R&M segment includes mostly the activity in the two Portuguese refineries – Matosinhos (hydroskimming) and Sines (cracking), with 110.000 and 220.000 kboepd2, respectively. These refineries provide a balanced production mix, namely in middle distillates, such as gasoline and diesel. Galp
made a conversion project (€1,4 billion), which began in 2008 and was
completed in December 2012, with the main goal of optimizing the capacity utilization of its refineries, now allowing for a better processing of both light and heavy crude, whose cost is normally cheaper than light and condensed ones. Regarding Marketing, Galp is the leader in terms of market share in Portugal, has an increasing presence in Spain, while also participating in some African countries. The sales of Galp’s oil products encompass LPG3 and direct clients in
1
Trillion Cubric Feet 2
Thousand barrels of oil equivalent per day 3
Liquified Petroleum Gas Figure 1: Company Structure
Primary source of revenues is R&M
Figure 2: (%) EBIT per Segment, 2012
Source: Galp Energia Source: Galp Energia
50 Projects over 10 countries, with special focus on Brail, Angola and
Mozambique
GALP ENERGIA COMPANY REPORT
PAGE 4/36
Country Net Income (€ Bn) Market Cap (€ Bn) Employees Galp Portugal 0,34 9,75 7,24 Repsol Spain 0,63 23,18 29,99 BP UK 17,29 106,03 85,70 Iberdrola Spain 2,70 26,71 30,76 Shell Netherlands 20,63 109,23 87,00 TNK-BP Russia 5,94 17,23 42,00
sectors such as wholesale, retail and industrial. This segment is currently the
biggest source of the firm’s revenues.
Galp’s Gas sector involves: regulated activities, which encompass the distribution and storage of NG4; liberalized activities, through the import of NG; and a mix marketing, which include the previous two and is directed to industrial, commercial and residential clients and electricity producers. The company shares the control of this market along with EDP. Finally, in the Power sector, Galp holds an installed capacity of 245 MW5, including the
cogeneration at Galp’s refineries, which represent 24% of the consumption in the industrial sub-segment. Galp’s portfolio in this sector comprises cogeneration plants, wind power and the development of the marketing of electricity.
Shareholder structure
In 2006, Galp Energia created a shareholder agreement between Amorim Energia (33,34%), Eni (33,34%) and Caixa Geral de Depósitos (1%), jointly denoted as “the Parties”, which ended to be in effect in 2012. Alongside these, there were Parpública (2%), Iberdrola (4%), Banco Português de Investimento (2,07%), Corporación Caixa Galicia (2%), the Portuguese State (5%), while the remaining 17,25% account as free float.
In 2011, Eni obtained the right to sell more than 20% of Galp’s equity, whereas CGD would retain the 1% it held at the time. On November 2012, Eni sold 4% of
Galp’s share capital (at €11,48 per share), with CGD also selling its 1%. In addition, Eni issued bonds equivalent to approximately 8% of the share capital of Galp, thus currently holding 24,34% of the firm’s equity. Still in 2012, Amorim
acquired 5% of Galp’s share capital (at €14,25 per share), now holding 38,34% of the equity of the company. Apart from these two, Galp’s shareholder structure is composed by Parpública, which holds 7%, and the fraction correspondent to free float, 30,32%.
More recently, in May 2013, Eni completed a placement of 6,7% of Galp’s share capital, through a bookbuilding process intended for qualified institutional investors. As a result, Eni will hold 16,34% of the firm’s outstanding shares. In our view, this measure will be beneficial for Galp, as it might reduce its overhang risk.
Exploration & Production
Market Overview
4
Natural Gas 5
Megawatts
Figure 4: Shareholder Structure (2012)
Source: Galp Energia
Figure 5: World supply of primary energy (mb/d)
Figure 3: Galp’s competitors & peers data
Source: Galp, Repsol, BP, Shell, TNK
GALP ENERGIA COMPANY REPORT
PAGE 5/36 Humanity has always used energy for its survival and benefit. The more developed and evolved society got, the more dependent has man become on energy. It should not be a surprise that the demand for energy has been explosively increasing, especially during the last century, having a huge impact on economic growth (and vice-versa). Developed countries show a clear and larger consumption of energy than developing ones. However, in the last decade, these developing economies, such as India and China, have registered higher growth percentages of their GDP and, consequently, their energy demand has also been increasing. According to OPEC, by 2035, primary energy demand should increase approximately 54%, with fossil fuels, which currently account for 87% of total energy used, still representing 82% of this energy output. Oil will also continue to occupy the biggest portion of fuel type; even though it should have a smaller share (27%) than the one it holds nowadays (35%). By 2016, world oil demand should reach 92,6mb/d6, and 107,3mb/d in 2035. This growth will however mostly come from developing Asia, rather than OECD countries. In fact, for the latter, this demand is expected to follow a decreasing trend, only accounting for 41,1mb/d of the total outlook in 2035, where developing countries will lead the poll (60,6mb/d). In order to better understand this development, we thought it would be relevant to analyze the main sectors that utilize oil as part of its production process – transportation, industry, residential / commercial / agricultural and electricity generation. Starting with transportation, it is clearly the sector most dependent on oil. In 2012, in particular for road transportation, there were about 870 million cars around the globe, with more than 2/3 belonging to OECD countries. However, during the last few years the percentage shares between developing and developed countries have suffered significant and fast changes, with the first ones expected to hold around 52% of total cars in the planet by 2035. With the car ownership forecasted to flatten, mainly caused by technological improvements, the appearance of more environmental friendly and efficient fuels and a saturation effect7, total OECD percentage share of oil usage is supposed to reach 59% in 2035 (from 64% in 2009), whereas in developing countries it should achieve 61%, comparing with the current 50% it occupies. Specifically for developing countries, this massive growth in transportation oil usage will certainly offset the remaining sectors. In industrial terms, usage of oil is expected to decrease from 28% (2009) to 23% (2035); in production of electricity is expected to decline (10% to 5%); and in residential / commercial / agricultural, consumption of oil should register a (small) reduction, from 12% to 11% by 2035.
6
Million barrels of oil
7“Vehicle Ownership and Income Growth, Worldwide: 1960
-2030” - Joyce Dargay, Dermot Gately and Martin Sommer Source: OPEC, EIA
Figure 6: World oil demand (mb/d)
2009 2035 Transp 63% 59% Industry 24% 29% Res/Com/Agr 10% 9%
Electricity 3% 3% Transp 50% 61% Industry 28% 23% Res/Com/Agr 12% 11% Electricity 10% 5%
Transp 61% 50% Industry 23% 37% Res/Com/Agr 11% 8%
Electricity 5% 4% Developing
countries
Eurasia OECD
Figure 7: (%) Oil demand per sector
Source: OPEC World Oil Outlook 2012
Figure 9: Galp’s reserves and contingents
(mboe)
Figure 8: Total ex/imports of oil products
GALP ENERGIA COMPANY REPORT
PAGE 6/36 Given the rising tendency of demand, the supply of oil is expected to follow this movement, although in order to achieve this, a tremendous amount of investment streams is necessary. For instance, in deep water reserves, higher capital expenditures are expected to be mainly concentrated in Latin America and Africa between 2012 and 2016. Oil fields/reserves are already projected to enter in a decreasing phase after 2020. Consequently, firms will be obliged to use unconventional methods in order to find oil, which will require the development and application of projects, using new extraction technology, that will be associated with risks currently difficult to foreseen. Taking this into account, according to OPEC, during the period of 2012-2016, this stream of investments is projected to be $270 billion, with this figure estimated to rise even more after this date.
The supply and demand of oil are the direct catalysts of oil prices. Historically, these figures were considered much less volatile and easier to predict, particularly until 2006-2007. In 2008, with the beginning of the financial crisis in the United States, the consequential contagion overseas, especially in the European Union, and the more and more unstable situation in the middle east oil producer countries, crude prices suffered an extreme growth, moving from $69,08 to $94,45 in just one year (figure 10). In the long term, in order to accompany the increasing demand in oil, prices are predicted to grow as well. Moreover, the evolution of crude will also depend on other factors, such as governmental (restrictions on amount of regulation at CO2 emissions) political (existence of Cartels) and technological (advances in machinery, equipment, …). Considering the major increase in the demand of oil, it becomes clear the interest Galp has in this area, particularly with its E&P division. According to the
company’s strategy, this is the segment that will generate the biggest percentage
of value, especially from 2013 onwards. Currently, Galp’s most important projects
are located in Brazil, Angola and Mozambique, although it has already several other countries in view, like Namibia, Morocco and even Portugal, expecting to reach a production of 300kboepd by 2020, more than 10 times its current level.
Brazil
Galp participates in 21 projects in Brazil across 8 different offshore/onshore basins – Potiguar, Pernambuco, Segipe/Alagoas, Espírito Santo, Campos, Santos and Amazonas. Recently, Galp participated in a bid for exploratory blocks, organized by the ANP8, being awarded the following blocks: PN-T-136, PN-T-150, PN-T-166 and PN-T-182 in the Parnaíba basin; 300,
8
Agência Nacional do Petróleo, Gás Natural e Biocombustível
2001 23,12 2002 24,36 2003 28,10 2004 36,05 2005 50,64 2006 61,08 2007 69,08 2008 94,45 2009 61,06 2010 77,45 2011 107,46
Figure 10: World proven oil reserves (bn)
Source: EIA, OPEC
Figure 11: OPEC basket prices ($/b)
Source: OPEC
Source: BP, Bloomberg Figure 12:Deepwater Capex (US$m)
GALP ENERGIA COMPANY REPORT
PAGE 7/36
Basins Block Galp participation (%) Operator # Blocks Area (km2) Water depth (metres)
BM-POT-16 20% Petrobras 2 1.535 50-2.000
BM-POT-17 20% Petrobras 3 2.302 50-2.000
POT-M-764 20% Petrobras
Pernambuco 20% Petrobras 3 1.713 1.000-2.000
Espírito Santo 20% Petrobras 1 722 2.000-2.200
Campos 15% Petrobras 1 85 100-400
BM-S-8 14% Petrobras 2.432 2.000-2.500
BM-S-11 10% Petrobras 2.297 2.000-2.500
BM-S-21 20% Petrobras 1.037 2.000-2.500
BM-S-24 20% Petrobras 1.394 2.000-2.500
Amazonas 40% Petrobras 3 5.718
Sergipe/Alagoas 50% Galp 2
PN-T-136 50% Galp
PN-T-150 50% Petrobras
PN-T-166 50% Petrobras
PN-T-182 50% Galp
BAR-M-300 10% BG Group
BAR-M-342 10% BG Group
BAR-M-344 10% BG Group
BAR-M-388 10% BG Group
Santos offshore Potiguar Barreirinhas Pernaiba offshore onshore
342, BAR-M-344 and BAR-M-388 in the Barreirinhas basin; and an additional block in the Pontiguar basin, POT-M-764. In a per basin basis, these concessions cost to the consortium R$22.3M (€8,3M), R$251M (€96M) and
R$8M (€3M), respectively. Of all the enumerated, the most important is the Santos basin, as it is the only one that currently has fields already in its production phase, thus the only area that will be taken into consideration for valuation purposes (others are still in testing and exploration stages). In terms of transport infrastructure, for oil in 2013, transport will done through DP9 shuttle tankers, and afterwards via shallow water transfer units (UOTE10); while for gas, the transport is made through the Mexilhão gas route (10m3/d capacity), and after 2014, by the Cabiúnas gas pipelines (13m3/d). In this basin, Galp is present in four offshore blocks.
BM-S-8 in the Carcará, Biguá and Bem-te-vi fields; BM-S-11, with the Iara and Lula and Cenambi fields; BM-S-21 in the Caramba field; and BM-S-24 in the Jupiter field. Petrobras is the main operator in all these basins, including all the blocks in the Santos basin, with the exception of Sergipe/Alagoas, where Galp is the operator.
In BM-S-8, Bem-te-vi had its first discovery in 2007, while an exploration well in Biguá has already been drilled and completed in 2011, separated 21km from the first. After that, attention was turned to the drilling of Carcará that had a proven oil quality of around 31º API11. A DoC12 was planned to happen in the end of 2012, as well as the drilling of a EWT13 for this field. However, in order to better understand its characteristics, a delay on the deadline was asked to ANP for the
9
Dynamically Positioned 10
Offshore Transport and Export Unit 11
American Petroleum Institute 12
Declaration of Commerciality 13
Extended Well Test
Block Reserves (Mboe) Prod. Year BM-S-8
Bem-te-vi, Car and Big 1.000 2013 BM-S-11
Iara 3.000 2013 Lula and Cernambi 8.300 2010 BM-S-21
Caramba 1.000 2016 BM-S-24
Jupiter 2.300 2016
Figure 13: Reserves and production start
Source: Galp Energia, Analyst Estimates
Figure 14: Fields in Brazil
Source: Galp Energia
Figure 15: Working interest production per project in 2012
GALP ENERGIA COMPANY REPORT
PAGE 8/36
2008 2009 2010 2011 2012
Lifting costs excluding prod taxes 7,7 8,78 10,03 12,59 13,92
Lifting costs including prod taxes 19,39 20,51 24,64 32,52 33,83
Exploration costs 1775 1702 1981 2630 3994
R&D expenses 941 681 993 1454 1143
issuance of the DoC, which should take place in 2013. According to the
company’s initial estimates, 400-500Mboe14 were expected, stating they might have been too conservative. Due to these new events, we decided to consider
1.000Mboe of reserves for this block. Iara’s appraisal phase is expected to be completed in the end of this year. The DoC and EWT are also anticipated to happen at the same time. Reserves were assumed to be 3.000Mboe with a 16% recovery factor. Still in BM-S-11, Lula and Cernambi constitute the biggest asset of the firm in terms of Brazilian oil fields, with particular emphasis to Lula. Production already started in Lula back in 2009 following an 18-month EWT, with confirmed reserves of 8.300Mboe (6.500 for Lula and 1.800 for Cernambi). In 2010, this EWT was replaced by a long-term production system – the FPSO15 of Cidade de Angra dos Reis, with an oil capacity of 100mb/d, according to Petrobras. By 2017, Galp expects to have installed a total of 10 FPSOs in the Lula area alone.
For Caramba in BM-S-21, activities are currently focused on interpreting the 3D seismic data, processed in 2011, and in identifying and selecting prospects. The drilling of an exploration well is forecasted for 2014 and a DoC for April 2015, with production expected to start in 2016. Due to uncertainty caused by lack of data regarding this field and the proximity it has with BM-S-8, we expect a similar number of reserves, 1.000Mboe. The Jupiter field had its first discovery in 2008, with studies suggesting that it was similar to Lula’s size. The company estimates a DoC will take place in February 2016. In 2012, the drilling of a second well, Jupiter NE, was completed, confirming the existence of high quality fossil fuels (33% oil, 33% gas and 33% condensates). As a result, an FPSO is estimated to be allocated in this field by 2018 and we considered reserves of 2.300Mboe. The management of oil production in Brazilian fields is subject to some specific regulations and rules. In fiscal terms, tax regimes in Brazil are done through concessions that encompass the following: a Special Participation Tax, ranging from 0% to 40% depending on production of oil/ng, water depth, onshore/offshore type and production per year; royalties that account for 10% of gross sales; and a corporate tax rate of 34%, which is comprised by a basic 15% corporate income tax, plus a 9% social contribution on net profit and a 10% surtax. Historical costs related with the exploration and production of oil have been increasing over time. Especially in the last decade, with the economic recession and various conflicts in Middle East, operating costs and capital expenditures in oil related matters more than doubled. Also, as markets became more competitive, new and more expensive
14
Million barrels of oil equivalent 15
Floating, Production, Storage and Offloading
SPT ( ≤11322 kboe/year) 0% SPT (11322 - 22644 kboe/year) 10% SPT (22644 - 33966 kboe/year) 20% SPT (33966 - 45288 kboe/year) 30% SPT (45288 - 56609 kboe/year) 35% SPT ( > 56609 kboe/year) 40%
Figure 16: Deepwater capex (US$m) 2012-2016 By Operator
Source: BP, Bloomberg
Figure 17: SPT in Brazil
Source: Galp Energia
Figure 18: Production/Lifting Costs by Region (M$)
Figure 19: Petrobras costs (lifting $/barrel; rest M$)
GALP ENERGIA COMPANY REPORT
PAGE 9/36 technologies and labor are required. As Galp has an agreement with Petrobras in all the fields it participates in Brazil, with the latter being the main operator in a
big portion of them, it becomes crucial to understand Petrobras’s own operating
costs. Due to factors already enumerated and others, such as the rising prices of
steel and/or iron, we also forecast Petrobras’ costs to grow in the near future. However, as Galp’s operations in the basin being analyzed are all located in ultra-deep water areas, Petrobras’s historical might not be a very accurate benchmark. The reasoning behind this is the following: it has a riskier nature; the cost of drilling, for instance, a shallow water reserve ($40/bbl) is lower than in an ultra deepwater reserve (can go up to $100/bbl16); and the fact that Petrobras previous operations do not involve fields with these characteristics. With that in mind, we should expect even larger capex, as maintenance. Thus, we assume a total of $28/bbl as operating costs for these fields. In Brazil, capital expenditures are valued taking into account extraction and injection wells, FPSOs and their respective maintenance. According to our analysis, and taking reference on the only Brazilian field already producing where Galp has a participation, Lula, we assumed an average cost per well of $180M, with a production of 20kbopd; while for FPSOs, we used an average production of 150kbopd and a cost of $1,2Bn. During the first semester of 2012, Galp finalized the agreement, announced in November 2011, with Sinopec, related to the capital increase in Petrogal Brazil
and other related parties, responsible for the company’s upstream activities in that country. Sinopec fully subscribed to the $4,8 billion capital increase (€3,6
billion), plus a shareholder loan that amounted for $0,6 billion (€0,45 billion),
resulting in a partnership with Galp, where the first holds 30% of Petrogal’s
operations in Brazil and the rest belonging to Galp. Still, the consolidation of
Petrogal’s operations continued to be fully accounted in Galp’s own financial statements, where the capital increase was accounted both in cash and minority interests. In our view, this agreement became very beneficial for Galp in a sense that it helped decrease part of the risks associated with the financing of the operations in the producing fields. However, it should be noted that this positive
perspective was not shared entirely by the market, as Galp’s stock price started decreasing just after the agreement was first announced, falling more than €3 in around a 20-days period.
Angola
In Angola, Galp participates in five projects – four oil projects spread through four offshore blocks (block 14, block 32, block 14k-A-IMI and block 33), where the main operators are either Total or Chevron; and an integrated natural gas project
16“
Trends in moving towards deepwater E&P in Malaysia” – Frost & Sullivan Source: Galp, Analysts Estimates
Source: Galp, Analysts Estimates Source: Galp, Petrobras
Figure 22: Fields’ capex Figure 20: Petrobras/Galp capex (M€)
GALP ENERGIA COMPANY REPORT
PAGE 10/36 (Angola LNG II), with Sonagás as the operator. In block 14, Galp Energia has been producing since December 1999. It is composed by eight areas – Kuito, Benguela-Belize-Lobito-Tomboco (BBLT), Tômbua-Lândana (T-L), Malange, Lucapa, Gabela Menongue and Negage, although the firm’s relevant participation is only located in the first five. In the case of Kuito, BBTL and T-L, these fields are already at their mature phase, with part of its reserves completely depleted. However, this fact has been partly compensated by the installation of a CPT17 in the T-L area back in 2009. Around this period, a total of 350Mbbl in reserves were estimated, with peak production taking place in 2011. Still in block 14, Galp also has a participation in Malange and Lucapa. In Lucapa, a FPSO is expected to be developed, while in Malange, a DoC was issued back in 2010, after the drilling of the Malange-2 well. We expect these fields to hold a total of 1.200Mbbl in reserves and production to start by 2014. Galp’s project in block 14k-A-IMI, in the Lianzi area, was adopted in order to connect it to the BBTL platform, thus facilitating the reduction of the amount of investment required. According to its operator, Chevron, total reserves are estimated at 300Mbbl, with production beginning in 2015.
The development plan for block 32 was approved in late 2010, with focus in the Kaombo area. Fourteen discoveries have already been made, and in 2012, an extension was authorized for the exploration period of the Central North East (NE) area for 2-3 more years to further investigate potential undiscovered prospects. Production is supposed to start in 2016, with reserves worth 1.300Mbbl. Lastly, there is block 33. In March 2005, after the seismic interpretation was taken, two exploration wells were drilled, but only one, Calulu-1, ended up as commercially viable. However, due to lack of further information, either regarding reserves and production levels, we decided not to value this
block as part of Galp’s portfolio in Angola.
Much like in Brazil, the exploration and production of Angolan oil fields rely on
very specific regulations. Angola’s tax regime is based on a Production Sharing
Agreement (PSA). Here, gross revenue (based on working interest production) is divided into: (1) operating costs and capex, which is denominated cost oil, amounting for a maximum of 50% of the annual working interest production, or 65% in case development costs in need of recovery from more than four years exist; and (2) the remaining quantity, called profit oil, subject to a share between 0%-70% that will be distributed between the concessionaire and the contractor, depending on the terms of the agreement. The portion allocated to the contractor will then be subject to an income oil tax of 50%. By joining both parts, the net entitlement production is achieved. Operational costs have been increasing as
17
Compliant Pilled Tower
Block Reserves (Mboe) Prod. Year Block 14
Kuito, BBLT, T-L 350 2009 Mal and Luc 1200 2014 Block 14K-A-IM
Lianzi 300 2015 Block 32
Kaombo 1300 2016 Block Galp share (%) Operator Block 14
Kuito, BBLT, T-L 9% Chevron Mal and Luc 9% Chevron Block 14K-A-IM
Lianzi 4,5% Chevron Block 32
Kaombo 5% Total
Source: Galp
Figure 26: Working interest production Angola (kpoed)
Figure 25: Galp/Total/Chevron capex comparison (M€) Figure 23: Fields in Angola
Figure 24: Reserves and production start (Angola)
Source: Galp, Analysts Estimates
Source: Galp, Chevron, Total
GALP ENERGIA COMPANY REPORT
PAGE 11/36 the starting of the production in some fields is approaching, which require more and more expenses associated with research and exploration. Consequently, we, like in the Brazil case, considered $20/bbl as operating cost in our valuation for Angola. These account for costs associated with wells, where we assumed an average drilling cost of $100M, and FPSOs, with a production capacity of 110kbopd. According to estimates, capex is expected to register a large growth, especially in years when fields are anticipated to begin producing (2014 and 2016).
Mozambique and others
Galp Energia’s presence in Mozambique is concentrated in the offshore ultra-deep water area 4 in the Rovuma basin. In 2012, the company signed an agreement with the ENH of Mozambique, hoping to gain technical, operational and financial cooperation as well as an easier analysis in evaluating new opportunities in the region. At the same time, after eight appraisal and exploration wells were drilled, several discoveries were made in terms of NG. As a result, it is estimated an amount of natural giip equal to 75Tcf for the whole basin, with 27Tcf (or 4.666Mboe, approximately) for area 4 alone. Two new exploration wells, the Coral 3 and Mamba South 3, are expected to be drilled in the Mamba structure, especially for assessing the oil potential in the K Bulge region in the South of area 4. Moreover, other projects are being considered, such as the installation of
onshore
liquefied gas units, FLNG18 and gas-to-power projects. Still in 2012,areas 4 and 1’s operators (Eni and Anadarko, respectively) agreed on the
development of common areas, which include the coordinated development of offshore activities and joint development of LNG units onshore, whose investment requirements are expected between 2013 and 2014. The commercial production phase is planned to start in 2018.
Once again, Mozambique’s fiscal policy follows a Production Sharing Agreement. Gross revenues (based on working interest production) have to be discounted with a royalty, ranging from 2% to 8% according to certain characteristics of the site (oil or NG and onshore or offshore). Afterwards, this value is subdivided into: (1) capital expenditures and operating costs (cost recovery) that can account for a maximum of 75% of annual working interest production; and (2) the remaining amount, denominated the profit oil, which will be subject to a share that will be distributed between the government and the contractor, ranging from 45% to 85%. Finally, the share attributed to the contractor is discounted with an income tax of 32%. Regarding operational costs, Eni, as the main operator of this area, should be able to give a reasonable proxy as to what to expect in the future. But,
18
Floating Liquified Natural Gas
Basin Rovuma Block Area 4 Operator Eni Galp participation (%) 10% Area (km2) 13235 Location Ultra deep water Water depth (metres) 0 – 2600 # Blocks 1
2009 2010 2011 2012
F&D costs 28,9 19,32 18,82 17,37
Opex 5,77 6,14 7,28 7,1
Figure 27: Fields’ capex
Source: Galp, Analysts Estimates
Figure 28: Rovuma basin in Mozambique
Source: Galp
Figure 29: ENI’s costs ($ per boe)
Source: ENI
Figure 30: Galp/ENI capex comparison
(M€)
GALP ENERGIA COMPANY REPORT
PAGE 12/36 similar to the case in Brazil, Eni does not take into account deep water exploration areas, thus we considered higher costs than average, $12/bbl. In here, operational costs encompass pipelines and wells, which we estimate to cost approximately $1,7Bn and $100M, respectively.
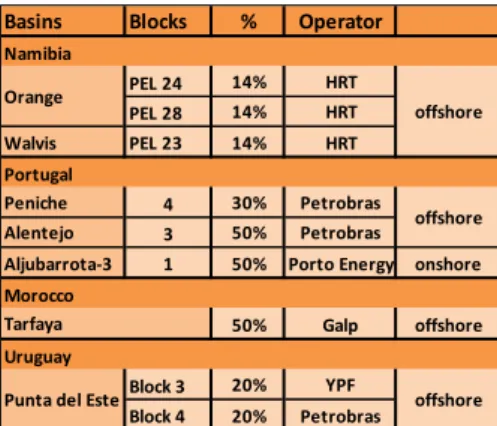
Besides these countries, Galp also holds some kind of involvement in other regions, namely Namibia, where the company signed a farm-in agreement with HRT19 in order to participate in seven projects spread across two basins; Morocco, where Galp has another farm-in agreement with Tangiers to acquire 50% interest in eight exploration licenses located throughout the Tarfaya Offshore; Uruguay, in which the firm has been participating, since 2009, in a bidding for offshore licenses; or even Portugal, where the company has acquired a stake of 50% in a concession at the Aljubarrota-3 area. As said before, the reason why we did not account for these activities is due to the fact that the concessions, where Galp has an agreement in, are all still in a testing and preliminary phases, in which there is not relevant data available to draw any important conclusion. An example of this was the recent results related with the exploration of the Wingat-1 well in the Walvis basin in Namibia, indicating that the amount of oil found at the site was not commercially significant.
Valuation
For Galp Energia’s E&P segment, we used an Adjusted Present Value (APV)
approach. In doing so, we valued only fields already in production/development stages of their lives, where the company participates. For each of these fields, we computed the respective free cash-flows, discounting them with an unlevered cost of equity and then adding the value of the tax shields. Due to the fact that in none of the projects being valued, Galp is the main operator of the concession,
after the total value of each field was calculated, we had to account for Galp’s
respective percentage share in each of them. We took into account the production starting year for each field and estimated an average life time depending on the country – 25 years for Brazil and 20 for Angola and Mozambique. In each area, we assumed the productivity of every field would increase until a certain “peak production” year, which varies between 2-10 years after first oil, depending on specific characteristics inherent to them. Also relevant, were future brent crude oil prices, which we had estimate. According to EIA20, oil prices are expected to decrease in 2013 to $107/bbl, reaching $96/bbl in 2015. However, after this date, prices should start rising again and by 2040 a bbl should cost around $163. Even though we believe oil prices will start growing
19
HRT Participações em Petróleo, S.A. 20
US Energy Information Administration Basins Blocks % Operator
Namibia
PEL 24 14% HRT PEL 28 14% HRT Walvis PEL 23 14% HRT Portugal
Peniche 4 30% Petrobras Alentejo 3 50% Petrobras
Aljubarrota-3 1 50% Porto Energy onshore Morocco
50% Galp offshore Uruguay
Block 3 20% YPF Block 4 20% Petrobras Tarfaya
Punta del Este offshore Orange
offshore
offshore
Fields Peak Prod Year BM-S-8 2018 BM-S-11 Iara 2023 BM-S-11 Lula 2019 BM-S-21 2022 BM-S-24 2025 Block 14 Kuito 2011 Block 14 Malange 2019 Block 14K-A-IMI 2020 Block 32 2023 Area 4 2025
Figure 31: Working interest production Mozambique (kpoed)
Source: Galp, Analysts Estimates
Source: Analysts Estimates Figure 32: Galp’s remaing activities Source: Galp, Analysts Estimates
GALP ENERGIA COMPANY REPORT
PAGE 13/36
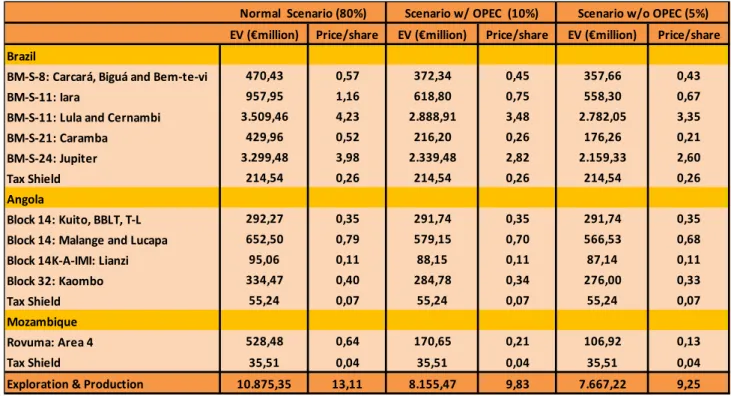
EV (€million) Price/share EV (€million) Price/share EV (€million) Price/share Brazil
BM-S-8: Carcará, Biguá and Bem-te-vi 470,43 0,57 372,34 0,45 357,66 0,43
BM-S-11: Iara 957,95 1,16 618,80 0,75 558,30 0,67
BM-S-11: Lula and Cernambi 3.509,46 4,23 2.888,91 3,48 2.782,05 3,35
BM-S-21: Caramba 429,96 0,52 216,20 0,26 176,26 0,21
BM-S-24: Jupiter 3.299,48 3,98 2.339,48 2,82 2.159,33 2,60
Tax Shield 214,54 0,26 214,54 0,26 214,54 0,26
Angola
Block 14: Kuito, BBLT, T-L 292,27 0,35 291,74 0,35 291,74 0,35
Block 14: Malange and Lucapa 652,50 0,79 579,15 0,70 566,53 0,68
Block 14K-A-IMI: Lianzi 95,06 0,11 88,15 0,11 87,14 0,11
Block 32: Kaombo 334,47 0,40 284,78 0,34 276,00 0,33
Tax Shield 55,24 0,07 55,24 0,07 55,24 0,07
Mozambique
Rovuma: Area 4 528,48 0,64 170,65 0,21 106,92 0,13
Tax Shield 35,51 0,04 35,51 0,04 35,51 0,04
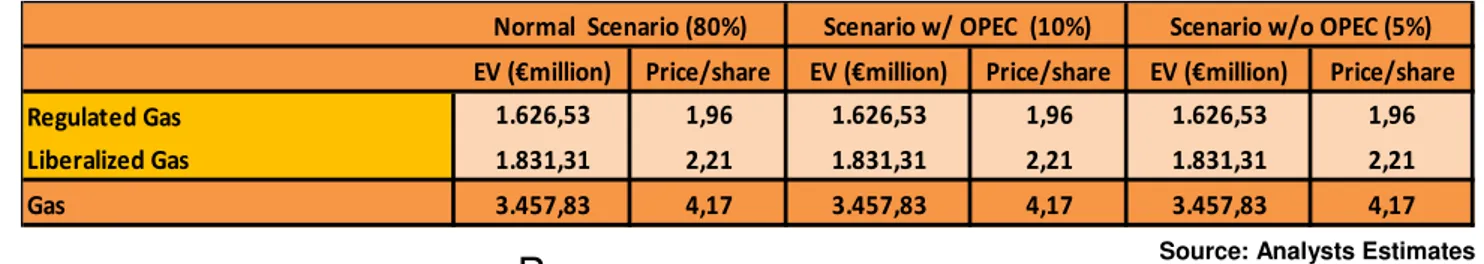
Exploration & Production 10.875,35 13,11 8.155,47 9,83 7.667,22 9,25 Normal Scenario (80%) Scenario w/ OPEC (10%) Scenario w/o OPEC (5%) rapidly in the near future, we instead consider a more moderate forecast for 2040, expecting them to reach $140/bbl, as there is high uncertainty in the market and . Furthermore, both in Brazil and Angola, we discounted brent by 5% due to differences in API gravity21. For the sole case of Mozambique, being basically a NG project, we had to compute a parity between NG and oil prices. Although being distinct fuels, these are traded in similar energy markets, thus, we assumed an unchanging bbl/mmbtu22 forever, with a 15% as oil-gas parity. Finally, we reached a share value for Galp’s E&P of €13,11/share.
Refining & Marketing
Market Overview
The refining industry has experienced some big changes in the previous few years, in particular, when the world financial crisis erupted in 2008. Ever since then, there has been a disproportion between the oil supply (excess) and demand (decline). Apart from these, others factors have been affecting the industry. The emissions of CO2 have become a bigger concern to governments throughout the years. As a result, more regulations and subsidies have started and will continue being imposed on refining companies, thus limiting the production and consumption of oil. The progress of technology used in refineries has also been affecting oil demand, as more renewable and efficient alternatives
21
API = (141,5 / g) - 131,5, where g is the density of the crude oil at 60ºF, used to measure density of oil 22
Million British Thermal Units
Gasoline Diesel Volumetric energy content
(MJ/l) 34,6 38,6
Specific energy content
(MJ/kg) 44,4 45,4
Energy per CO2 (MJ/kg) 13,64-14,64 14,15 Auto-ignition temperature
(ºC) 246 210
Retail price ($/gallon) 3,57 3,93
Source: Analysts Estimates, EIA Figure 34: Prices comparison
Source: EIA, OPEC, Platts
Source: Analysts Estimates Figure 35: E&P EVs and €/share
GALP ENERGIA COMPANY REPORT
PAGE 14/36 have and will cause a diminishing impact on the usage of gasoline and diesel fuels. Nonetheless, according to OPEC, nowadays, product demand’s main catalysts are still gasoline (21,5mb/d) and gasoil/diesel (26mb/d), with this trend expected to persist in the long term. However, diesel is projected to register the biggest volume gain, not only compared to gasoline, but also to all other light, middle distillates and heavy products, expected to grow more than 10mb/d until 2035. On the other hand, demand for gasoline will increase in a rather lower rate (5mb/d) from 2011 to 2035. Still, naphtha is expected to display the fastest growing percentage output, mainly caused by its production in Asian developing regions. Lastly, oil used for residential purposes will remain as the sole case where an actual reduction is forecasted to happen, as its rising competition with
natural gas has been harming more and more this fuel’s position in the market. In
the near future, developed countries are expected to suffer a decrease in their product oil demand, while in the developing ones, an opposite effect is forecasted.
Tax rates in oil products are another issue we found important to discuss, as this is one of the main factors responsible for the mentioned variations in gasoil, principally in Europe – dieselization effect. Portugal, in particular, is one of the countries in Europe with the higher prices of fuels (annex 2), mostly due to the large taxation these are subject to. In 2003, Council Directive 2003/96/EC (annex 3) was set in motion, with the main objective of terminating the most significant
differences in prices of energy fuels by influencing minimum tax rates, although it ended up creating higher tax burdens on lesser quality energy products. As a result, gasoline’s prices suffered a strong upsurge, being nowadays a much more expense fuel than diesel, in spite of the latter’s richer energy content. In 2011, an amendment of this directive was presented, aiming at restructuring the outdated taxes on energy products by considering their energy content and CO2 emissions and, in that way, force gasoline and diesel prices to reach similar figures. Still, as this amendment is only expected to influence minimum rates, we expect it will not have the desired impact on countries with rates already above this level, thus not resulting in similar energy tax rates throughout European countries. Consequently, in the medium run, the minimum rates in these regions will slowly start rising, especially in the case of transportation-based fuels. However, even if
gasoil’s prices reach levels close to those of gasoline, being a higher quality fuel, we believe that it will still retain its superiority.
As we stated before, the financial crisis and European sovereign debt situation had a huge effect on the European refining industry, with the oversupply and demand shortage of oil goods. Refineries began experiencing an overcapacity, with most of its funds being directed to conversion projects, as clear preference
Figure 37: Global product demand (mb/d)
Source: EIA, OPEC
Figure 38: CO2 Emissions from the Consumption of Petroleum (M
Metric Tons)
Source: EIA
Figure 39: Total oil refining supply (M barrels)
Source: EIA
GALP ENERGIA COMPANY REPORT
PAGE 15/36 for middle distillates started taking place. Demand for light and heavy oil products also suffered the crisis effects, as its prices fell, while, at the same time, affecting
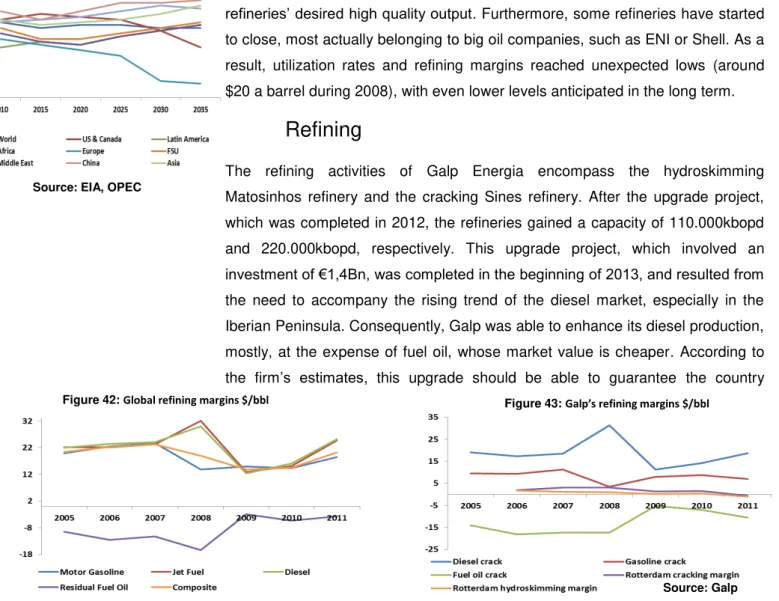
refineries’ desired high quality output. Furthermore, some refineries have started to close, most actually belonging to big oil companies, such as ENI or Shell. As a result, utilization rates and refining margins reached unexpected lows (around $20 a barrel during 2008), with even lower levels anticipated in the long term.
Refining
The refining activities of Galp Energia encompass the hydroskimming Matosinhos refinery and the cracking Sines refinery. After the upgrade project, which was completed in 2012, the refineries gained a capacity of 110.000kbopd and 220.000kbopd, respectively. This upgrade project, which involved an investment of €1,4Bn, was completed in the beginning of 2013, and resulted from the need to accompany the rising trend of the diesel market, especially in the Iberian Peninsula. Consequently, Galp was able to enhance its diesel production, mostly, at the expense of fuel oil, whose market value is cheaper. According to the firm’s estimates, this upgrade should be able to guarantee the country
autosufficiency in gasoil. Still, European margins have declining as a result of the lower demand, which in turn will also influence negatively utilization rates. However, Galp has been able sustain itself, with special attention to the growth in its refining margin in 2012 and its hydroskimming and cracking margins
perfomance. Thus, the firm’s margins are estimated to grow between $2-3/bbl already for 2013, which we considered the more moderate approach ($2/bbl). These movements in the refining margins are extremely important for Galp, as, generally, margins become more advantageous the closer they get to their distribution network.
In the Iberian market, refining processing capacity is shared between Repsol, Cepsa, BP and Galp, with the latter currently holding 20%. Galp’s market share in this industry has slightly been growing over the years (18,5% in 2010), especially with the recent conclusion of the conversion project in its refineries. Also, Galp has the biggest portion of market share (almost 70%) in the
Figure 41: Production/Lifting Costs by Region (M€)
Source: EIA, OPEC
Figure 43: Galp’s refining margins $/bbl
Source: Galp Figure 42: Global refining margins $/bbl
Figure 44: Iberian consumption of refined products (kpoed)
Source: EIA, OPEC
GALP ENERGIA COMPANY REPORT
PAGE 16/36 Portuguese refining market, thus providing better comparative advantages than its peers that, at the same time, depend on the supply from Galp’s own refineries, which will ultimately make transportation-related expenses decrease. Utilization rates suffered a significant decline with the impact of the financial crisis in the Iberian market in 2008, falling from 79,37% in the previous year to 68,60%. This tendency persisted until 2012, while in 2013, with the finish of the conversion projects, we expect a major recovery on these rates, estimated to achieve levels of 70,80-79,80% during our forecasted period, given the greater importance of medium and heavy crudes and larger diesel production. Apart from this, Galp also prepared cogeneration projects at each of its refineries, with the one in Sines having already started in 2010, while the one in Matosinhos is supposed to become fully operational in 2013. Net operating costs of Galp’s refineries have showed an inconstant, but stable, performance, and as all projects have or are expected to be completed soon, where no further requirement for investments is needed and no additional ones are predicted for the future, we expect assumed a constant level of $2,47/bbl from 2013 onwards. In addition, we expect capital expenditures to also remain relatively constant for the rest of our valuation period.
Marketing
In its marketing segment, Galp Energia sells oil products either, directly to clients in the Iberian Peninsula and selected African markets, other operators or through exports. In 2012, the company’s sales accounted for 16,4Mton23 of oil products, with 61% being sales to direct customers. Due to, on the one hand, the increase
in refineries’ production and, on the other hand, the Iberian market’s consumption
reduction, exports reached 3,3Mton (20% of oil products’ sales), with gasoline
and oil being the most exported ones. In the retail market, Galp has a market share of around 30% in Portugal and 6% in Spain, with a total network of 1.486 service stations and 588 convenience stores, less 16 and 7 than in the year before, respectively. In the wholesale market, sales volumes decreased 5% in the Portuguese market and 6% in the Spanish one, while in Africa, sales accounted for a total of 4% of the sector. In LPG, Galp holds a 60% partnership along with BP (35%) and Repsol (5%) in an infrastructure located in Sigás, with a storage capacity of 34.800 tonnes. Still, the downward trend present in the Iberian market persisted, although Galp was still able to secure its competitive position in this market. In 2013, the company sold to the group Auto Julio three fuel (gasoline, gasoil, …) distribution facilities for which the latter agreed to buy,
23
Megatons
Figure 45: Galp’s refining margin & utilization rate ($/bbl)
Source: EIA, OPEC Source: Galp
Figure 46: Total oil supply (kpoed)
Figure 47: Total Refined Product Sales (kton)
Source: Galp
Figure 48: Iberian sales in retail segment (kton); market shares (%)
GALP ENERGIA COMPANY REPORT
PAGE 17/36 for a 5-year period, a total of 195M liters of these fuel types for an estimated
€240M which may vary according to the volatility in prices of oil.
In historical terms, the marketing segment has always showed very stable results, with no major unexpected deviations taking place in relatively short periods of time. For the several types of sales dealt in this segment, we estimated these would increase in pair with the real gdp growth rates of Portugal
and Spain, according to their respective average weight for the company’s
caption. Moreover, since 2009, prices of refined products have varied between
€435 and €535 per ton, while EBITDAs varied between €21 and €38 in terms of
total refined product sales. Consequently, in our valuation, we believe this tendency should continue in the short and long term.
Market shares for oil producers have been decreasing over time, and are believed to continue following that trend, mainly due to the rising importance of supermarkets. In the UK, the contribution of total fuel sales in supermarkets went up from 37%, in 2010, to 45%, in 2011. At the same time, the number of petrol stations has also been falling, with a drop of more than 400 stations from 2010 to 2011. These are able to sell the same products at lower prices. Although these are regarded as poorer quality items, due to the lower quantity of additives they contain (which is the fundamental reason for their inferior prices), for a normal customer, these became preferable and more easily accessible. According to big oil companies, such as Galp, the (more) expensive prices practiced by them are compensated in a sense that, as fuel sold in these stores has lesser oil concentration, their products have higher longevity, especially in road transportation, i.e. larger distances can be accomplished.
Valuation
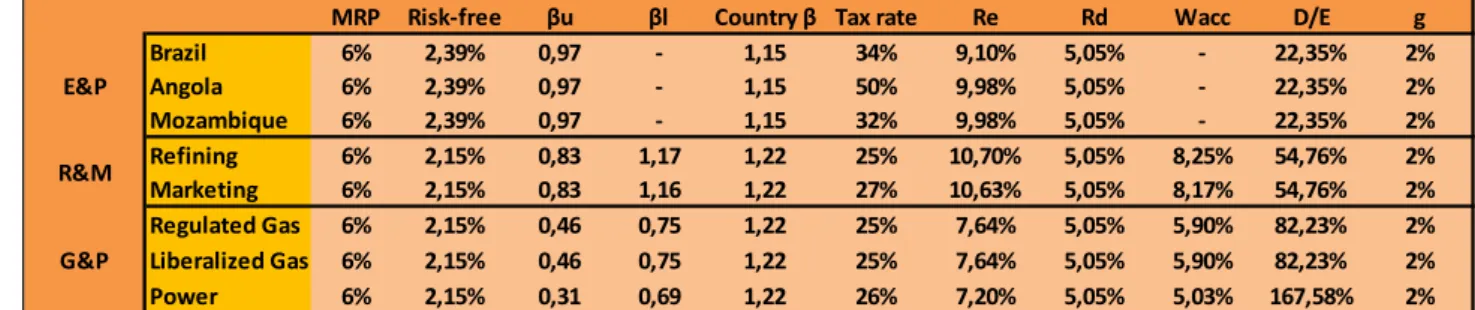
In Galp’s R&M, we valued both segments individually and used a Discounted Cash Flow (DCF) approach, discounting cash flows at a computed WACC. We assumed a (constant) terminal growth, in line with the inflation rate, of 2%. Moreover, we used different tax rates for each of the sectors, resulting from the fact that, in our belief, Galp’s refining business is much more concentrated in Portugal, while in marketing, activities are almost evenly divided through the Iberian Peninsula. Consequently, this approach resulted in slightly different costs of equity and betas for each. Regarding capex, after the completion of the conversion project in 2012, no major costs are expected, apart from the variation in the number of facilities (service stations and convenience stores) and maintenance-related ones. The Refining part was valued primarily through specific rates, margins and benchmark capacities which are strictly correlated with the oil demand. Marketing, as said before, is a very stable sector and should
Figure 51: Iberian retail sales (including taxes) per fuel
Figure 50: Growth in marketing sales (%) Figure 49: Global comparison gasoline /
diesel consumption (mb/d)
Source: EIA Source: Galp, BP, Repsol
GALP ENERGIA COMPANY REPORT
PAGE 18/36
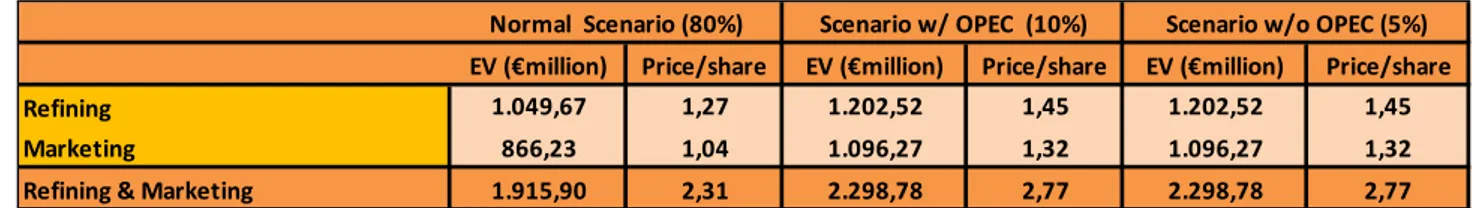
EV (€million) Price/share EV (€million) Price/share EV (€million) Price/share
Refining 1.049,67 1,27 1.202,52 1,45 1.202,52 1,45
Marketing 866,23 1,04 1.096,27 1,32 1.096,27 1,32
Refining & Marketing 1.915,90 2,31 2.298,78 2,77 2.298,78 2,77 Normal Scenario (80%) Scenario w/ OPEC (10%) Scenario w/o OPEC (5%) continue that way, depending mostly on overall sales than on actual margins, whose valuation is expected to vary with the demand of oil products. We then
reached a share value for Galp’s R&M of €2,31/share.
Gas & Power
Market Overview
NG is the fastest growing fossil fuel in the world, with an average rate of 1,6%/year from 2008 to 2035. According to OPEC, in the long run, this fuel will grow at faster rates than coal or even oil, both in quantities and percentage terms, raising its share from 23% (2010) to 26% (2035). This demand growth will be mostly concentrated in non-OECD regions, which is in fact almost three times bigger than in OECD ones. The financial crisis in 2008 had a negative impact on the demand of NG of nearly 4%. According to EIA, NG still is the fuel of choice in terms of the electrical and industrial sectors due to (1) its relevant price discount relatively to oil; and (2) to its smaller carbon intensity, when comparing to, for instance, oil or coal, which becomes a very big advantage in regions where governments are implementing regulations in order to limit emissions of CO2 into the air. Furthermore, due to its favorable thermal efficiencies and relatively low costs, NG is considered a very worthy alternative fuel to energy producing factories, as more and more importance is given to environmental issues, and energy types, such as nuclear, are starting to no longer being regarded as stable
sources of power generation (i.e. Japan’s Fukushima Daiichi nuclear disaster in
2011). Regarding NG reserves, these have been increasing immensely over time, having registered a growth rate of around 50% during the last twenty years, a rate even larger than the one oil reserves have displayed, with particular emphasis in non-OECD regions. As of 2011, there were 6.675 Tcf of equivalent proved NG reserves in the world, a level much larger than in the year before that. Taking into consideration the current levels of reserves analyzed, estimates point out to a reassuring resource base that supports growth in NG markets until, at least, 2035.
On the other hand, one of the biggest weaknesses of this fuel is the difficulty of its transportation, as large, sophisticated and expensive pipelines are required for that matter. As a result, prices depend on very specific and local markets.
Figure 52: R&M EVs and €/share
Source: Analysts Estimates
Figure 53: Natural gas consumption in OECD Europe by end-use sector,
2008-2035 (Tcf)
Source: OPEC, EIA
Figure 54: World natural gas reserves by region,1980-2011 (Tcf)
Source: OPEC, EIA
Figure 55: World carbon dioxide emissions by region (Million metric
tons carbon dioxide)
GALP ENERGIA COMPANY REPORT
PAGE 19/36 Currently, the UK and US markets are the only ones whose prices are truly transparent. In the first, the NBP24, a virtual trading location for the purchase, sale and exchange of UK natural gas, is used (£/term). For the latter, it is utilized the Henry Hub Natural Gas prices, calculated in a $/mmbtu basis (the most recent trade averaged $3,81/mmbtu). Apart from these, other markets generally use long-term contracts with their respective suppliers.
Gas
Galp Energia’s natural gas segment comprises regulated and liberalized
activities, which range from supply (liberalized), storage and distribution (regulated) and marketing (regulated and liberalized). In procurement, Galp signed, in 1997, three long-term agreements (20 years) for NG with NLNG25 in Nigeria and one (23 years) for LNG with Sonatrach in Algeria; and also has purchases in the spot market. By being long-term, these contracts: (1) guarantee Galp a constant supply for this business in Portugal; and (2) grant the company advantages from participating in the LNG international market, through trading. In 2008, the firm expanded its business to the Spanish market, and in order to better explore the Iberian market, Galp intends to enter in the LNG mid and upstream businesses in Brazil and Angola. Statistically, this industry gives Galp 6 bcm26 per year. In 2012, 56% of the company’s total gas sales came from Nigeria, 32% from Algeria, through the EMPL27 gas pipeline, Extremadura and Al-Andalus; and the remaining 12% from other sources, with supply totaling 6,3bn m3. In addition, Galp attained 0,8bcm on the spot market.
Galp’s storage part functions through a public-service concession that was awarded to the firm for a 40-years period. The current storage capacity of Galp is estimated at 40mm3, with a regulatory asset base (RAB) worth €17M and a remuneration rate of 8%, which seems a reasonable measure, as the WACC we computed for this segment is lower than that figure). In 2010, Galp held a RAB of
€1.184M, and by 2012, this figure reached €1.2Bn, resulting from the sum of all
distribution companies’ own RAB, subject to the specific participation Galp has in
each one. For the rest of our valuation period we estimated Galp’s RAB, before taxes, to grow in line with Portuguese consumer prices. Moreover, the firm has operations in two sites: (1) TGC 1S, with a storage capacity of 40mm3; and (2) TGC-2, with a volume of approximately 752mm3, which was completed in 2012 and should start operating in late 2013, where an incremental raise of 130mm3 in capacity is expected.
24
National Balancing Point 25
Nigeria LNG 26
Billion Cubric Meters 27
Europe Magrebe Pipeline Figure 56: NBP & HH spot prices
($/Mil. BTUs)
Source: Galp Source: EIA Source: EIA, Bloomberg
Figure 57: World natural gas consumption, 2008-2035 (Tcf)
Figure 58: Natural gas sales (Mm3)
GALP ENERGIA COMPANY REPORT
PAGE 20/36
Galp’s Portuguese distribution channel is regulated by six NG distributors, with the firm having a full participation in five of them (Lisboagás, Duriengás, Paxgás, Medigás and Dianagás) operating under 40-year concession contracts, and four other (Lusitaniagás, Beiragás, Tagusgás and Setgás), partly-owned by Galp, autonomous gas units (AGU) – operating under 20-year concession agreements. The two biggest distributors in terms of NG volume are Lisboagás and Lusitaniagás, with 493,8Mm3 and 671,9Mm3, respectively. Like in storage, ERSE28 sets a remuneration rate, although of 9% for this case. In 2012, the operators, where Galp has participation in, distributed 1,5bcm of NG, through a network which expanded by 11.948 km at the end of the year. The Portuguese energy regulator, ERSE, controls the company’s energy-related revenues through 40-years concession agreements. These are set in the following way: recovery of operating costs + cost of capital29 + adjustments = allowed revenues. The adjustments result from the difference between actual and expected allowed revenues for year n-2. The concessions, agreed between Galp Energia and the Portuguese State, are responsible for the functioning of marketing and distribution of NG, granting the firm the compensation covered by the concession and the reassessment of the assets at the inflation rate. In that sense, the distribution operators are able to receive the right to seek the restoration of balanced financial terms in case, after the fifth regulatory period (15 years), the rate of return, stipulated by ERSE, does not take into account the rate of return of
similar companies’ assets.
In marketing of NG, Galp is one of the main operators, being the second biggest in the Iberian market in terms of clients (1,3 million as of 2012). As stated before, this sector includes both regulated and liberalized activities. The first accounts for
Galp’s sales in the retail segment – commercial, residential and industrial – with
clients’ average consumption of almost 2 million m3
per year. In the latter, the company sells NG, again, in the industrial segment, in the trading segment and to producers of electricity. As a result of an increase in consumption of Galp’s NG in the hydrocracker and cogeneration at the Sines refinery and in the cogeneration at Matosinhos, the industrial segment alone experienced a growth in sales only in 2012 (from 161mm3 to 2.113mm3). Especially with the start of operations of the cogeneration project in Matosinhos, we expect this upward tendency to continue for 2013 and beyond. On the other hand, consumption in the commercial and residential segments registered a fall (103mm3 in 2012), mainly due to a loss of its Spanish customers. Moreover, there was an extension of deregulation in the Portuguese NG market, to which Galp responded with the creation of Galp On,
28
Entidade Reguladora dos Serviços Energéticos 29
Cost of Capital = RAB x Rate of Return + Depreciation RAB Galp (%) NG volume (Mm3)
Lisboagás 100,0% 493,8 Lusitaniagás 96,3% 671,9 Beiragás 60,0% 71 Tagusgás 41,0% 112,6 Setgás 66,9% 160,1 Duriengás 100,0% 18,1 Paxgás 100,0% 1,3 Medigás 100,0% 7,1 Dianagás 100,0% 5
Figure 60: Galp’s participation in distribution firms and respective NG
vol (Mm3)