Evapotranspiration and Surface Energy Fluxes Estimation Using the
Landsat-7 Enhanced Thematic Mapper Plus Image over a Semiarid
Agrosystem in the North-West of Algeria
Nehal Laounia, Hamimed Abderrahmane, Khaldi Abdelkader, Souidi Zahira, Zaagane Mansour
Research on Biological Systems and Geomatics Laboratory,
University Mustapha Stambouli of Mascara, Mascara, Algeria.
Received: February 2, 2017 – Accepted: July 05, 2017
Abstract
Monitoring evapotranspiration and surface energy fluxes over a range of spatial and temporal scales is crucial for many agroenvironmental applications. Different remote sensing based energy balance models have been developed, to esti-mate evapotranspiration at both field and regional scales. In this contribution, METRIC (Mapping EvapoTranspiration at high Resolution with Internalized Calibration), has been applied for the estimation of actual evapotranspiration in the Ghriss plain in Mascara (western Algeria), a semiarid region with heterogeneous surface conditions. Four images ac-quired during 2001 and 2002 by the Landsat-7 satellite were used. The METRIC model followed an energy balance ap-proach, where evapotranspiration is estimated as the residual term when net radiation, sensible and soil heat fluxes are known. Different moisture indicators derived from the evapotranspiration were then calculated: reference evapotrans-piration fraction, Priestley-Taylor parameter and surface resistance to evaporation. The evaluation of evapotransevapotrans-piration and surface energy fluxes are accurate enough for the spatial variations of evapotranspiration rather satisfactory than so-phisticated models without having to introduce an important number of parameters in input with difficult accessibility in routine. In conclusion, the results suggest that METRIC can be considered as an operational approach to predict actual evapotranspiration from agricultural areas having limited amount of ground information.
Keywords:evapotranspiration, remote sensing, METRIC, energy balance, Landsat.
Estimativa da Evapotranspiração e Fluxos de Energia de Superfície Usando
a Imagem Landsat-7 Enhanced Thematic Mapper Plus em um Agrosistema
Aemi-árido no Noroeste da Argélia
Resumo
O monitoramento dos fluxos de energia e da evapotranspiração em diferentes escalas espaciais e temporais é crucial para muitas aplicações agroambientais. Diferentes modelos baseados no sensoriamento remoto têm sido desenvolvidos para estimativa da evapotranspiração tanto em escala local como em largas escalas. Neste contexto, o METRIC (Mapping EvapoTranspiration at high Resolution with Internalized Calibration) tem sido aplicado para a estimative da evapotrans-piração em “Ghriss plain” em Mascara, uma região semiárida no noroeste da Argélia com condições e superfícies heterogêneas. Quatro imagens adquiridas durante 2001 a 2002 com o sensor Landsat-7 ETM+ foram usadas. O modelo METRIC computa o balanço de energia onde a evapotranspiração é estimada como resíduo quando o saldo de radiação e os fluxos de calor sensível e no solo são conhecidos. Diferentes indicadores de umidade derivados da evapotranspiração foram então calculados: a fração da evapotranspiração de referência, o parâmetro Priestley-Taylor e a resistência da superfície à evapotranspiração. As avaliações da evapotranspiração e dos fluxos de energia foram suficientemente precisas para detecção das variações espaciais da evapotranspiração, sendo mais satisfatórias que aquelas provenientes de modelos sofisticados sem a necessidade de introdução de vários parâmetros de difícil obtenção rotineiramente. Concluiu-se que, pelos resultados da aplicação do METRIC, o modelo pode ser considerado operacional para predição da evapotranspiração atual em áreas agrícolas com informações de campo limitadas.
Palavras-chaves:evapotranspiração, sensoriamento remote, METRIC, balanço de energia, Landsat.
Article
1. Introduction
Evapotranspiration is one of the fundamental pro-cesses controlling the equilibrium of our planet. It consti-tutes the link between the hydrological and energetic equi-librium at the soil-vegetation-atmosphere interface and its knowledge is crucial for climatic and agrometeorological studies (Khaldiet al., 2011). Nearly two-thirds of
precipita-tion over land is returned back to the atmosphere by the evapotranspiration (Jatoet al., 2016). In arid and semiarid
regions, water resources are limited and hereby the avail-able groundwater for irrigation and other water uses are se-verely constrained. Consequently, evapotranspiration con-stitutes one of major phenomena in the hydrological budget.
Remote sensing data with the increasing imagery res-olution is an excellent tool for evapotranspiration monitor-ing as it provides information related to mass and energy transfers and particularly to evapotranspiration fluxes. Re-mote sensing technology can provide land surface parame-ters such as albedo, vegetation indices and surface tempera-ture, which are indispensable to remote sensing-based energy balance models for scaling up evapotranspiration and surface energy fluxes to larger spatial and longer tem-poral scales. It is recognized as the only way to retrieve evapotranspiration at several temporal and spatial scales (Zhanget al., 2016; Liouet al., 2014). To this end, there has
been a major effort over the past several years to develop remote sensing-based methods that provide spatially dis-tributed surface fluxes maps using airborne and satellite data (Khaldiet al., 2011). Basically, these methods can be
classified into three main categories:
- Those using simple empirical relationships relating daily evapotranspiration to an instantaneous surface tem-perature measurement (Trezza, 2006); - Those using deter-ministic relationships based on more complex models such as Soil-Vegetation-Atmosphere Transfer models (SVAT) (Oliosoet al., 1999; Galleguilloset al., 2017; Hartantoet al., 2017). They are mainly used for estimating
evapotrans-piration, surface energy exchanges and water balance. Most of the transfer mechanisms (radiative, turbulent, and water transfers) and some physiological processes (photosynthe-sis, stomatal regulation) are described; - Those basing on the estimation of the evapotranspiration as the residual term of the energy balance equation. They can be divided into two categories: 1) Single-source models, such as SEBAL (Surface Energy Balance Algorithm for Land) (Bastiaans-senet al., 1998; Teixeiraet al., 2009), METRIC (Mapping
Evapotranspiration with Internalized Calibration) (Allenet al., 2007; Trezza et al., 2013; Hamimed et al., 2014),
S-SEBI (Simplified Surface Energy Balance Index) (Roerinket al., 2000), SEBS (Surface Energy Balance
Sys-tem) (Su, 2002) and TIM model (the Trapezoid Interpola-tion Model) (Sun and Kafatos, 2007; Stisenet al., 2008),
that do not distinguish between soil evaporation and tran-spiration, but treat the land surface as one homogeneous
surface. Their simplicity and yet physically sound basis has made the single-source models widely used; 2) Dual-sour-ce models, such as TSEB (Two SourDual-sour-ce Energy BalanDual-sour-ce) (Frenchet al., 2015; Bouletet al., 2015; Xinet al., 2010),
that discriminate the soil and vegetation component, aim-ing at a more physical description of heterogeneous sur-faces when dealing with radiative and aerodynamic proper-ties. However, they have limitations related to the difficulty of obtaining temperatures for the soil and vegetation.
Amongst these methods, we focused in this study on the METRIC model. This model has been applied success-fully in many applications for estimation of both evapo-transpiration and soil moisture. The METRIC model followed an energy balance approach, where evapotranspi-ration is estimated as the residual term when net radiation, sensible and soil heat fluxes are known. It uses the principle of surface energy balance to scale sensible and latent heat-ing between wet/cold and dry/hot edges identified within
the modeling domain. METRIC (Liet al., 2013) has the
particularity of using the hourly reference evapotranspira-tion in the calculaevapotranspira-tion of evaporative fracevapotranspira-tion, which makes it the most suitable model for conditions with strong local advection which characterize the semiarid regions in Alge-ria (Hamimedet al., 2014).
This study aims to evaluate the actual ET by using METRIC remotely sensed-based model. The obtained re-sults are compared with ground observations of wheat and forage using the Bowen ratio Energy Balance (BREB) method. The studied area is located in a semi-arid region of Algeria, where ground data are scarce or difficult to obtain. For this reason, the application of different remotely sen-sed-based approaches for estimating ET are necessary and the analysis of their sensitivities is important in order to se-lect the most appropriate model.
2. Study Area and Data
2.1. Study area description
This study area correspond to the Ghriss plain which is a semi-arid agrosystem in the north-west of Algeria, three kilometers away southward from the town of Mascara, be-tween longitudes 0°0’3” E and 0°24’42” E and latitudes 35°7’54” N and 35°27’34” N. It covers an area of 576 km2 (Fig. 1).
The selected area belongs to the Ghriss plain which is a flat expanse of a surface of about 650 km2and an average
Mediterranean and Saharan influences. The latter are clear-ly predominant due to the screen formed by the Beni-Chou-grane Mountains in the North (Bekkoussaet al., 2008).
The study area is characterized by a semi-arid climate and recurrent drought. Two main periods characterize this area, a rainy and dark period during the months of Novem-ber to April and another dry and hot period during the months of May to September. Winter (from December to February) is usually cold enough. The absolute minimum of the air temperature descends to -4 °C. Summer (from June to August) is usually hot and dry. The absolute maxi-mum of the air temperature is equal to +42 °C. Thermal maxima are accentuated by the sirocco, a hot drying wind from the South. Rainfall is concentrated during the cold pe-riod. The annual rainfall for the period 1980-2010 oscillates between 200 and 620 mm (Fig. 2), with an average of about 357 mm (Bekkoussaet al., 2008). March, April, November
and December are the rainiest months of the year, while June, July and August are the hottest months. The evapo-transpiration is important during the period of May to Sep-tember and become lower during the period of October to February.
The study area is characterized by its significant agri-cultural potential, since more than 90% of its total area is currently used for agricultural activity. The land use is quite diverse with a predominance of irrigated agriculture, mainly represented by the truck farming, which covers about 70% of the total of the study area. The forage crops, cereal crops and arboriculture are complementary.
Groundwater which is the main source of irrigation water supply is mobilized by the Ghriss aquifer system. The latter takes the form of a superposition of three layers: the Plio-Quaternary alluvial aquifer, the Pliocene calcareous
sandstone aquifer and the Jurassic calcareous-dolomite aquifer.
2.2. Data sources
Remote sensing data used in this study consists of four Landsat-7 ETM+ (Enhanced Thematic Mapper Plus) imagery acquired on December 3rd, 2001, February 5th,
2002, April 26th, 2002 and July 15th, 2002.
Optical bands (bands 1, 2, 3, 4, 5 and 7) are used for albedo and vegetation index calculations. Thermal band (band 6) is used for surface temperature. Spatial resolution is 30´30 m on the optical bands and 60´60 m on the ther-mal band. This high spatial resolution is well suited for monitoring evapotranspiration on heterogonous landscapes (Khaldiet al., 2011).
The spectral bands of ETM+ sensor are supplied in digit numbers (encoded into an 8-bit value) which are con-verted into radiances in the optical (visible, near and me-dium infrared) and thermal ranges using the linear relationship:
L sat ( )l = ×A DN+B (1)
whereDNis the digit number,AandBare calibration
coef-ficients.
The spectral radiances in the optical range are con-verted into reflectances after correction for atmospheric ef-fects using MODTRAN 4.0 radiative transfer code (Berket al., 2016). These reflectances are then used to calculate the
albedo (r0) and vegetation index (NDVI). The albedo (r0) is
defined as a surface reflectance in the shortwave range (0.3-3mm). It is calculated using the formula proposed by Lianget al.(2002):
r r r r r
r
0 1 3 4 5
7
0356 013 0373 0085
0072 00018
= + + +
+
-. . . .
. . (2)
wherer1,r3,r4,r5andr7are respectively the reflectances in
channels 1, 3, 4, 5 and 7 of ETM+ sensor. The vegetation
index (NDVI) is calculated from the reflectances in the red (r3) and the near infrared (r4):
NDVI=
-+
r r r r
4 3
4 3
(3)
The spectral space-reaching radiance measured by the sensor in the thermal infrared (Lsat(l)) is expressed by
the following relationship:
L L T L
L
¯
= + - ×
+
sat atm
atm
( ) [ ( ) ( ) ( )]
( )
l e e l t
l
l l
0 0 1 0 (4)
whereLl(T0) is the radiance of a blackbody target of kinetic
temperatureT0,tlis the atmospheric transmission,L¯atm(l)
is the down-welling or sky radiance,Latm(l) is the
upwel-ling or atmospheric path radiance ande0the surface
emis-sivity which is estimated from the vegetation index (NDVI) by Van de Griend and Owe (1993):
e0 =10094 0047. + . ´ln(NDVI) (5)
The atmospheric parameters (tl, Latm(l) and
L¯atm(l)) are estimated at time of satellite overpass by the
web atmospheric correction parameters calculator (Barsiet al., 2003). Spectral radiances (Ll(T0)) reflected from the
Earth surface can be deducted by inversion of Eq. (4). Sur-face temperatures are finally obtained based on these ra-diances according to Planck’s Law (Chanderet al., 2009):
T K
K L T
0
2
1
0 1 =
+ æ
è
çç öø÷÷
ln
( ) l
(6)
whereK1= 666.09 andK2= 1282.71 are the parameters of
Landsat 7 ETM+.
Remote sensing data are supplemented by ground measurements which were performed on two points located in the experimental site of Agronomy department of Mas-cara University. The first point was located on forage crop and the second on wheat crop (Fig. 1). These measurements were intended for the daily monitoring of energy fluxes at the soil-plant-atmosphere interface (Hamimed, 2009). They correspond to the radiometric surface temperature, the reflected radiation and the three components of surface energy balance,i.e.soil heat flux (G), sensible heat flux (H)
and latent heat flux (lE). Incoming shortwave (solar) and
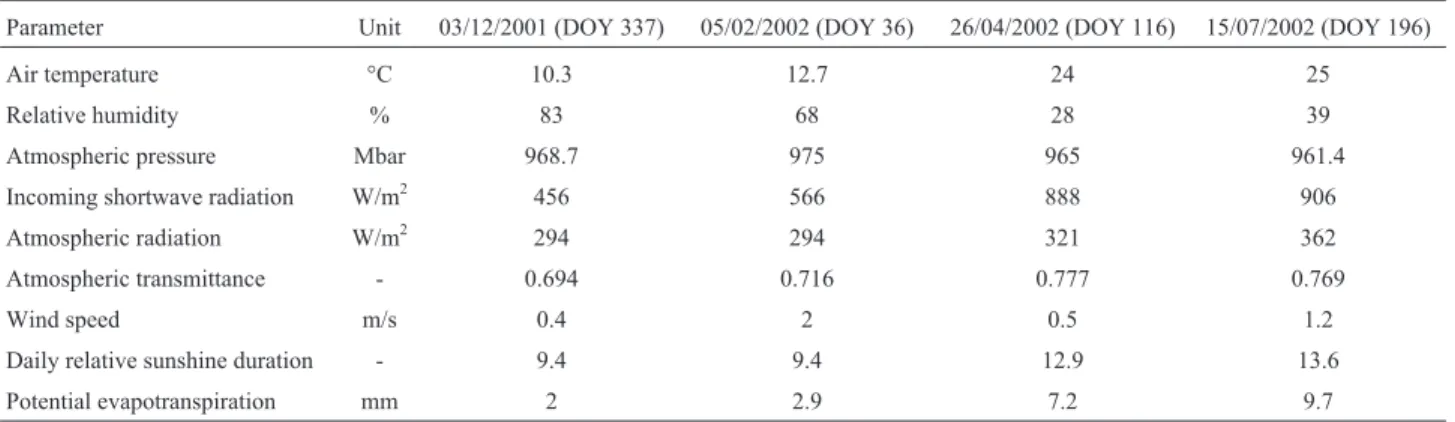
thermal radiations were measured on the meteorological station of Matmore (ONM), located at the center of the study area (Fig. 1) using a pyranometer and a pyrgeometer, respectively. Other incoming shortwave and thermal radia-tions measurements were performed on a different location and provided very similar results. The meteorological sta-tion also provided measurements on the reference variables which are air temperature, relative humidity, wind speed, air pressure, sunshine duration and daily potential evapo-transpiration (Table 1). The temperature, humidity and
wind speed were acquired at 2 m above the ground with a 10-second time step and an averaging period of 15 min. A comparison of the data against the data acquired in Ghriss (11 kilometers to the South of Matmore meteorological sta-tion) did not show any major failure. On the experimental device, installed on the plots of wheat and forage, the albedo was given by the ratio of the reflected radiation (measured by an Apogee pyranometer (model MP-200)
with calibration uncertainty of± 5%) and the incoming
shortwave radiation. The net radiation (Rn) is determined
from the radiative balance equation, depending on the albe-do, the incoming shortwave and thermal radiations and the surface emission which is deduced from the radiometric surface temperature over the 8-14mm spectral bands. This radiometric surface temperature is measured by an Apogee infrared radiometer (IRTS-P model). The resolution of this radiometer is±0.1 °C and its accuracy is±0.5 °C. The soil heat flux (G) is measured using Hukseflux conductive flux
plates (HFP01SC model) installed at 5 cm depth in the soil. Sensible and latent heat fluxes were computed by means of the Bowen ratio energy balance (BREB) method from mea-surements at two levels (0.5 and 2.5 m above the surface) of air temperature using the chromel-alumel thermocouples, and relative humidity using Vaisala capacitive probes
(HMP35D model). Generally, the BREB method has~20%
uncertainty (Kustas and Norman, 1999).
All the instruments used in our experiment were cali-brated before the experiment by the constructor. The BREB system was closely supervised and general maintenance was provided at least weekly. Maintenance included clean-ing the thermocouples and housclean-ing units, servicclean-ing radiom-eters by cleaning domes, checking/replacing the desiccant tubes.
3. Evapotranspiration Estimation with METRIC
Model
METRIC is based on the estimation of latent heat flux (lE) as the residual term of the energy balance equation.
This latter describes the energy exchange between the land surface and the atmosphere:
lE=Rn G H- - (7)
whereRnis the net radiation at the surface (W/m2),His the
sensible heat flux (W/m2),
Gis the soil heat flux (W/m2)
andlEis the latent heat flux (energy consumed by
evapo-transpiration, W/m2).
The net radiation (Rn) is found from the various com-ponents of radiation exchanges:
Rn= -(1 r0)×Rg+L¯ -L (8)
whereRgis the incoming shortwave radiation, partly
re-flected depending on the albedor0,L¯andLare the
down-welling and the updown-welling long wave radiation, respec-tively.
The soil heat flux (G) is empirically estimated using
the expression suggested by Bastiaanssenet al.(1998):
G T r
Rn
= +
´ - ´
0 0
4 00032 00062 1 0978
( . . )
( . (NDVI) )
(9)
The sensible heat flux (H) is the convective heat loss
from the surface to the air created by a near surface temper-ature gradient. It is expressed as a function of the near-surface air temperature difference (Taero-Ta) and the aero-dynamic resistance to heat transport (rah) as follows:
H Cp
rah Taero Ta
=r× ( - ) (10)
whereris air density (kg/m3),
Cpis air specific heat at
con-stant pressure (J/kg/K),Taerois the aerodynamic tempera-ture (K),Tais the air temperature (K) andrahis the aerody-namic resistance to heat transfer which is a function of wind velocity, thermal stability effects of the atmosphere and surface roughness. In satellite remote sensing applications, the radiometric surface temperature (T0) retrieval is often
used instead of the aerodynamic temperature (Taero) in Eq. (10), (Kustaset al., 1989).
In METRIC, the sensible heat flux (H) is estimated
without needing to knowTaorTaero, instead a temperature difference (dT), a function ofT0, was used as (Allenet al.,
2007):
Table 1- Meteorological conditions during the image acquisition of Landsat Thematic Mapper on the selected days.
Parameter Unit 03/12/2001 (DOY 337) 05/02/2002 (DOY 36) 26/04/2002 (DOY 116) 15/07/2002 (DOY 196)
Air temperature °C 10.3 12.7 24 25
Relative humidity % 83 68 28 39
Atmospheric pressure Mbar 968.7 975 965 961.4
Incoming shortwave radiation W/m2 456 566 888 906
Atmospheric radiation W/m2 294 294 321 362
Atmospheric transmittance - 0.694 0.716 0.777 0.769
Wind speed m/s 0.4 2 0.5 1.2
Daily relative sunshine duration - 9.4 9.4 12.9 13.6
H Cp rah dT
=r× (11)
where dT is the near-surface temperature difference
be-tween two near surface heightsz1 = 0.1 m andz2= 2 m
above the canopy layer, andrahis the aerodynamic resis-tance to heat transport between these levels (s/m). dTis
used in Eq. (11) because of the difficulty in estimating sur-face temperatureT0accurately from satellite due to
uncer-tainty in atmospheric attenuation or contamination and radiometric calibration of the sensor (Allenet al., 2007). In
addition,T0, as measured by satellite (i.e., radiometric or
ki-netic temperature) can deviate from the “aerodynamic” temperature that drives the heat transfer process by several degrees (Normanet al., 1995), following (Bastiaanssenet al., 1998) and (Allenet al., 2007).
In METRIC,rahis calculated betweenz1andz2using
a wind speed extrapolated from some blending height abo-ve the ground surface (typically 100 to 200 m) and an itera-tive stability correction scheme for atmospheric heat trans-fer based on the Monin-Obhukov stability length scale. In this study, a height of 200 m was used in the calculation of distributed friction velocity (u*), a term utilized in the
esti-mation ofH.
In this model, the differencedTbetween the two near
surface heights 0.1 and 2 m is approximated by a simple lin-ear function:
dT= ×a T0+b (12)
The coefficientsa andb in Eq. (12) are empirically
determined using the properties of pixels in extreme water conditions (hot/cold and dry/wet). These pixels are identi-fied on the image by analyzing the relationship between the vegetation index and the surface temperature according to the triangle method (Hamimedet al., 2014). The dry pixels
are indicated at bare soils (NDVI values close to zero) hav-ing high surface temperature. However, the wet pixels are indicated at fully vegetation (NDVI > 0.7) having low sur-face temperature. The thresholds of low and high tempera-tures are defined as the equilibrium surface temperatempera-tures resulting from the energy balance for well-watered dense vegetation and dry bare soil, respectively (Moranet al.,
1994).
With the identification of wet and dry pixels, we can determineHwetandHdryfrom the energy balance equation as follows:
Hwet =(Rn G- )wet-lEwet (13)
Hdry =(Rn G- )dry-lEdry (14)
A dry pixel is characterized by a zero latent heat flux (lEdry= 0), which means, the overall available energy (Rn
-G)dryis partitioned to sensible heat flux. For a wet pixel, the latent heat flux (lEwet) in METRIC is assumed to be equal to the hourly reference evapotranspirationETr, estimated
for a hypothetical reference crop, alfalfa, by using
Pen-man-Monteith equation (Allenet al., 1998) multiplied by
an empirical coefficient of 1.05 (a wet pixel usually has an evapotranspiration value of 5% larger thanETr).
With the calculation ofHwetandHdry, Eq. (11) was in-verted to computedTwetanddTdry. The use of Eq. (11) en-ables us computing the sensible heat flux in pixel basis and solving the energy balance equation. This step leads map-ping the latent heat flux. This should help interpreting accu-rately the behaviour of a surface with respect to water stress (Bastiaanssenet al., 1998). It is therefore preferable for an
easier interpretation to deduce moisture indicators such as the reference evapotranspiration fraction (EFref), the Pries-tley-Taylor parameter (a) and the surface resistance to evaporation (rs).
In METRIC, the instantaneous latent heat flux, ob-tained by Eq. (7), is converted to hourly evapotranspiration
EThor(in mm/h) according to:
EThor = E
× ×
3600
r l l (15)
wherelis the latent heat of vaporization of water (»2,45´ 106J/kg at 20 °C).
The reference evapotranspiration fraction (EFref) is expressed as the ratio betweenEThorandETrwhich is con-sidered similar to its daily counterpart. It is generally used to estimate the daily actual evapotranspiration taking into account the effect of the horizontal advection.
4. Results and Discussion
4.1. Surface temperature
The surface temperature (T0) is indirectly related to
the latent heat flux (lE) through the energy balance
equa-tion (Seguinet al., 1983). It provides important information
on surface moisture conditions. The analysis of the correla-tion betweenT0andlEfor the DOY 36 indicates
signifi-cantly better agreement between these two variables with
R= -0.92 (Fig. 3). Moreover, the NDVI and albedo
parame-ters, even if they offer interesting additional information in the interpretation of thermal infrared data (Carlson, 2007; Gillieset al., 1997; Roerinket al., 2000), are less
signifi-cant in discriminating surface moisture conditions since their determination coefficients with the latent heat flux are respectively 0.0002 and 0.57.
Surface temperature variations in the study area are shown in Table 2. Higher values correspond to pixels where bare soils (dry pixels) are dominant, while low values are associated with irrigated dense vegetation (wet pixels). Similarly, the average surface temperature on dry pixels is higher than on wet pixels (Table 2).
4.2. Net radiation
Higher values of net radiation (Rn) are observed over
wa-ter supply conditions. Bare soils (NDVI < 0.2) are charac-terized by low values ofRn, with an average of 231 W/m2,
312 W/m2, 460 W/m2and 423 W/m2for the DOY 337, 36,
116 and 196 respectively. The comparison between the ground-measured and satellite-estimated net radiation val-ues indicate better agreement, with a root mean square error
(RMSE) of 8.71 W/m2, corresponding to a relative RMSE
of 2.7%.
4.3. Soil heat flux
For the image acquired on autumn (DOY 337), the average soil heat flux (G) is 21.91 W/m2. However, the
av-erage ofGis higher (102.78 W/m2) in summer (DOY 196),
where the temperature is high. Bare soils offer the highest values ofG, about 22.41 W/m2, 34.87 W/m2, 94.31 W/m2
and 103.26 W/m2for the DOY 337, 36, 116 and 196
respec-tively (Table 3).
For surfaces fully covered by vegetation
(NDVI > 0.7), the soil heat flux is of 11.37 W/m2, 18.11
W/m2, 53.15 W/m2and 60.88 W/m2for the DOY 337, 36,
116 and 196 respectively.
Comparison between the ground-measured and satel-lite-estimated soil heat flux values shows that the model leads to an underestimation of theGflux with an RMSE of
13.2 W/m2, corresponding to a relative RMSE of 27.43%.
This result is similar to that obtained on the
Alpil-les/ReSeDA experimental site in France by Jacob et al.
(2002), on the Ksar Chellala plain in Algeria by Hamimed
et al.(2014) and on the Low-Middle São Francisco River
basin in Brazil by Teixeiraet al.(2009). This
underestima-tion can be explained by the uncertainty of the intermediate Table
2 -Instantaneous average values of parameters and surface energy fluxes above dry and wet pixels in the study area. Parameter Units (DOY 337) (DOY 36) (DOY 116) (DOY 196) Dry pixels Wet pixels Dry pixels Wet pixels Dry pixels Wet pixels Dry pixels Wet pixels NDVI -0.11 0.8 0.08 0.81 0.15 0.86 0.14 0.76 Albedo -0.16 0.21 0.14 0.23 0.19 0.22 0.21 0.22 Emissivity -0.91 0.99 0.91 0.99 0.92 0.99 0.92 0.99 Surface temperature K 305.11 286.36 305.22 288.18 328.79 301 331.5 305.23 Net radiation W.m -2 191 259 297 331 408 554 405 559 Soil heat flux W.m -2 25.53 9.11 39.24 13.10 99.68 31.83 106.86 54.12 Friction velocity m.s -1 0.19 0.2 0.19 0.2 0.088 0.061 0.14 0.13 Monin-Oubukhov length m -3.99 -80.66 -3.03 -204.66 -0.2 -12.51 -1.03 -35.43 Aerodynamic resistance to heat transport s.m -1 22.14 34.73 19.67 38.096 15.04 121.08 18.24 54.79 Sensible heat flux W.m -2 172.25 0 254.81 0 307.9 0 296.66 0 Latent heat flux W.m -2 0 245.15 0 316.62 0 521.89 0 502.13 Evaporative fraction -0 1 0 1 0 1 0 1 Near-surface and air temperature différence °C 21.64 0 19.36 0 31.62 0 32.88 0
variables used in the model (such as albedo, NDVI and sur-face temperature). Despite this imprecision,Gflux has a small impact on the available energy (Rn-G); because it is lower than the other energy fluxes (Jacobet al., 2002).
4.4. Sensible heat flux
The approach used in our study is based on the Mo-nin-Oubukhov similarity theory in the atmospheric bound-ary layer. In fact, the surface boundbound-ary layer modeling allows mapping the sensible heat flux which is obtained by estimating two key parameters of the energy balance regu-lation, depending on the surface type and its thermody-namic properties which are the aerodythermody-namic resistance to heat transfer (rah) and the surface-air temperatures differ-ence.
In the sensible heat flux (H) estimation, wet pixels are
identified on dense vegetation cover (NDVI > 0.7), with an average temperature values of 286.36 K, 288.18 K, 301 K and 305.23 K for the DOY 337, 36, 116, 196, respectively (Table 2).
We note also on Table 2 that for dry pixels (bare soil and urban) the aerodynamic resistance to heat transfer (rah) is low (22.14 s/m, 19.67 s/m, 15.04 s/m and 18.24 s/m for the DOY 337, 36, 116, 196, respectively), causing the re-lease of sensible heat to the atmosphere. This is justified by high differences between surface and air temperatures. However, for wet pixels (freshly irrigated plots)rahvalues are high (34.73 s/m, 38.09 s/m, 121.08 s/m and 54.79 s/m
for the DOY 337, 36, 116, 196, respectively) because the net available energy (Rn-G) is mainly consumed by evapo-transpiration (Hamimedet al., 2014). This differentiation of the sensible heat flux for dry and wet pixels is caused by the surface water status and its influence on the energy par-tition between the latent and sensible heat. Specifically, wet surfaces are individualized by lowHvalues while highH
values are assigned to dry areas (Table 2).
4.5. Latent heat flux
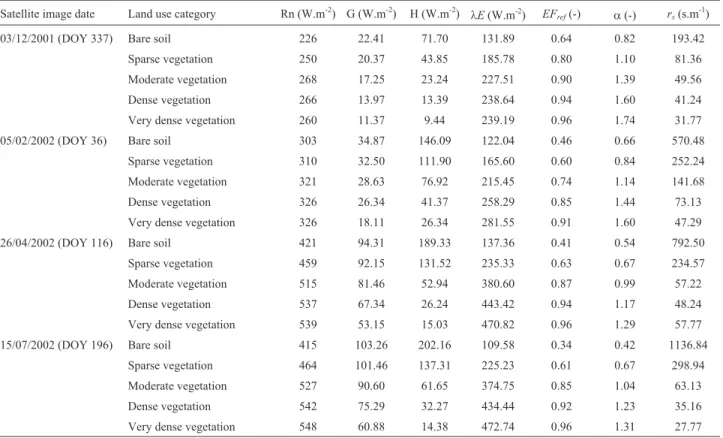
The results presented in Table 3 summarize the en-ergy fluxes and moisture indicators (reference evaporeans-piration fraction EFref, Priestley-Taylor parameter a and surface resistance to evaporation rs) obtained from the METRIC model for different land use units. It shows that high values of evapotranspiration (lE) are observed on the
irrigated areas with dense vegetation, while low values are on the bare soils, corresponding to high values of albedo. This allows emphasizing that the spatial distribution of METRIC-derived evapotranspiration is correlated to the water regimes of the different land use units. However, the estimated latent heat flux should be considered with cau-tion and have only a relative value, because there is no method of validation over wide scales of time and space (Khaldiet al., 2011).
A method commonly used for validating the obtained results is to compare latent heat flux values obtained with METRIC model from the image with those estimated on
Table 3- Variation of surface energy fluxes and moisture indicators with land use in the Ghriss plain.
Satellite image date Land use category Rn (W.m-2) G (W.m-2) H (W.m-2)
lE(W.m-2) EF
ref(-) a(-) rs(s.m-1)
03/12/2001 (DOY 337) Bare soil 226 22.41 71.70 131.89 0.64 0.82 193.42
Sparse vegetation 250 20.37 43.85 185.78 0.80 1.10 81.36
Moderate vegetation 268 17.25 23.24 227.51 0.90 1.39 49.56
Dense vegetation 266 13.97 13.39 238.64 0.94 1.60 41.24
Very dense vegetation 260 11.37 9.44 239.19 0.96 1.74 31.77 05/02/2002 (DOY 36) Bare soil 303 34.87 146.09 122.04 0.46 0.66 570.48
Sparse vegetation 310 32.50 111.90 165.60 0.60 0.84 252.24 Moderate vegetation 321 28.63 76.92 215.45 0.74 1.14 141.68
Dense vegetation 326 26.34 41.37 258.29 0.85 1.44 73.13
Very dense vegetation 326 18.11 26.34 281.55 0.91 1.60 47.29 26/04/2002 (DOY 116) Bare soil 421 94.31 189.33 137.36 0.41 0.54 792.50
Sparse vegetation 459 92.15 131.52 235.33 0.63 0.67 234.57 Moderate vegetation 515 81.46 52.94 380.60 0.87 0.99 57.22
Dense vegetation 537 67.34 26.24 443.42 0.94 1.17 48.24
Very dense vegetation 539 53.15 15.03 470.82 0.96 1.29 57.77 15/07/2002 (DOY 196) Bare soil 415 103.26 202.16 109.58 0.34 0.42 1136.84
Sparse vegetation 464 101.46 137.31 225.23 0.61 0.67 298.94 Moderate vegetation 527 90.60 61.65 374.75 0.85 1.04 63.13
Dense vegetation 542 75.29 32.27 434.44 0.92 1.23 35.16
the ground using the BREB technique (Hamimed, 2009). Kustas and Norman (1999) indicated that this technique have ~20% uncertainty, hence, when discrepancies be-tween model predicted and ground observed heat fluxes are
less than~20%, the performance of model is deemed
ac-ceptable. The result of comparison between remote sens-ing-estimated and ground-measured latent heat flux is shown in Fig. 4. It shows a significant discrepancy be-tween remote sensing and ground estimates of latent heat
flux, with a RMSE about 36.1 W.m-2, which correspond
to 15.80% in relative value and a determination coeffi-cients (R2) of 0.87. This result is closely similar to that
obtained on the Low-Middle São Francisco River basin
in Brazil (RMSE = 33.8 W/m2) by Teixeira
et al.(2009).
Finally, the results obtained onlE flux show excellent
agreements to justify that METRIC applied to the Ghriss site is promising for remotely sensed evapotranspiration monitoring.
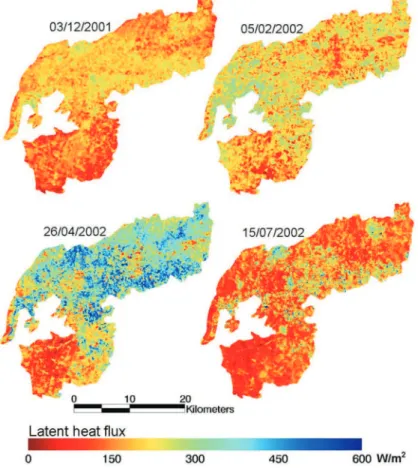
Figure 5 shows the spatial distributions of latent heat
fluxes (lE) derived from METRIC model. The METRIC
calculates H using a single-source temperature gradient
technique for heat transport, accounting for stability effects
based on the Monin-Obukhov theory, andlEis computed
as a residual term of the energy balance equation. Based on the identified spatial patterns forHandlE, the METRIC
computational scheme seems to be more physically comprehensive considering the stability for the aerody-namic resistance of heat transport (Choiet al., 2011).
Figure 4- Comparison of ground-based and satellite-derived METRIC estimates of latent heat fluxes.
Figure 5- Spatial distributions of latent heat flux estimated with METRIC on December 3rd, 2001, February 5th, 2002, April 26th, 2002 and July 15th,
The result leads to the conclusion that METRIC model can be considered as operational approach for moni-toring evapotranspiration over agricultural areas having limited amount of ground information.
The analysis of frequency distribution of surface re-sistance to evaporation (Fig. 6) is considered another way to validate our results. Bastiaanssenet al.(1996) showed
that for most crops covering fully soil, values of this resis-tance vary between 10 and 300 s/m with generally peaking in the class of 30 to 80 s/m. There is a general consensus that the surface resistance for crops which cover the soil en-tirely lies in approximately the same range (Bougeaultet al., 1991). The results shown in Fig. 6 are approximately
consistent with this indication.
5. Conclusion
Different models have been developed to estimate evapotranspiration from remote sensing data. The METRIC energy balance model was applied using Landsat ETM+ data in the Ghriss plain in Mascara (western Alge-ria), a semiarid region with heterogeneous surface condi-tions, to estimate actual evapotranspiration. The model outputs were compared with field observations using the Bowen ratio energy balance method.
METRIC is a residual model based on the energy bal-ance equation resolution by calculating the net radiation first, then the soil and the sensible heat fluxes, and then the latent heat flux (the actual evapotranspiration) is calculated as the residual term of the energy balance equation.
A significant discrepancy between remote sensing and ground estimates of latent heat flux is shown, with an
RMSE values of 36.1 W/m2,
i.e.15.80% in relative terms
and a determination coefficients (R2) of 0.87, which is
at-tributed to errors in the estimation of the net radiation, the soil heat flux and the sensible heat flux, which correspond to a RMSE between estimates and measurements of
8.71 W/m2(2.7%), 13.2 W/m2(27.43%), and 36,1 W/m2
(15.80%).
The results presented above confirm the possibilities offered by the Landsat ETM + satellite data to solve the en-ergy balance equation, and to estimate the evapotrans-piration. They lead to the conclusion that the METRIC model provide comparable outputs and can be considered as operational approach for evapotranspiration spatializa-tion over agricultural areas where ground informaspatializa-tion is scarce or difficult to collect.
Acknowledgments
This work was supported by the PHC-MAGHREB Program, (No. 14MAG927). The authors acknowledge Dr. A.H. De C. Teixeira (Embrapa Satellite Monitoring, Campinas, São Paulo, Brazil) for the translation support and the national meteorology office (ONM) in Mascara (Algeria) for supplying climatic data.
References
ALLEN, R.G.; PEREIRA, L.A.; RAES, D.; SMITH, M. Crop evapotranspiration guidelines for computing crop water
re-Figure 6- Frequency distributions of the surface resistance to evaporation estimated with METRIC on December 3rd, 2001 (a), February 5th, 2002(b),
quirements. FAO Irrigation and Drainage Paper 56, v. 300, n. 9, 1998. D05109.
ALLEN, R.G.; TASUMI, M.; TREZZA, R. Satellite-based en-ergy balance for mapping evapotranspiration with internal-ized calibration (METRIC)-Model.Journal of Irrigation
and Drainage Engineering, v. 133, n. 4, p. 380-394, 2007.
BARSI, J.A.; BARKER, J.L.; SCHOTT, J.R. An Atmospheric Correction Parameter Calculator for a Single Thermal Band Earth-Sensing Instrument. J. Proc. IEEE. Int. v. 5, p. 3014-3016, 2003.
BASTIAANSSEN, W.G.M.; VANDERWALL, T., VISSER, T.N.M. Diagnosis of regional evaporation by remote sens-ing to support irrigation performance assessment.
Irriga-tion and Drainage Systems, v. 10, n. 1, p. 1-23, 1996.
BASTIAANSSEN, W.G.M.; MENENTI, M.; FEDDES, R.A.; HOLTSLAG, A.A.M. A remote sensing surface energy bal-ance algorithm for land (SEBAL): 1. Formulation.Journal
of Hydrology, v. 212, p. 198-212, 1998.
BEKKOUSSA, B.; MEDDI, M.; JOURDE, H. Forçage clima-tique et anthropique sur la ressource en eau souterraine d’une région semi-aride : cas de la plaine de Ghriss, nord-ouest algérien.Revue Sécheresse, v. 19, n. 3, p. 173-184, 2008.
BERK, A.; CONFORTI, P.; HAWES, F.; PERKINS, T.; GUIANG, C.; ACHARYA, P. Next Generation MODTRAN for Improved Atmospheric Correction of Spectral Imagery.
Spectral Sciences, Inc. Burlington United States, 2016.
BOUGEAULT, P.; NOILHAN, J.; LACARRERE, P.; MAS-CART, P. An experiment with an advanced surface para-meterization in a mesobeta-scale model. Part I: Implementa-tion. Monthly.Weather. Review. V. 119, n. 10, p. 2358-2373, 1991.
BOULET, G.; MOUGENOT, B.; LHOMME, J.P.; FANISE, P.; LILI-CHABAANE, Z.; OLIOSO, A.; BAHIR, M.; RIVAL-LAND, V.; JARLAN, L.; MERLIN, O.; COUDERT, B.; ER-RAKI, S.; LAGOUARDE, J.P. The SPARSE model for the prediction of water stress and evapotranspiration compo-nents from thermal infra-red data and its evaluation over irri-gated and rainfed wheat.J. Hydrol. Earth. Syst. Sci. Dis-cuss. v. 19, p. 4653-4672, 2015.
CARLSON, T.N. An Overview of the “Triangle Method” for Es-timating Surface Evapotranspiration and Soil Moisture from Satellite Imagery.Sensors, v. 7, n. 8, p. 1612-1629, 2007. CHANDER, G.; MARKHAM, B.L.; HELDER, D.L. Summary of
current radiometric calibration coefficients for Landsat MSS, TM, ETM+, and EO-1 ALI sensors.J. Remote. Sens.
Environ, v. 113, n. 5, p. 893-903, 2009.
CHOI, M.; KIM, T.W.; PARK, M.; KIM, S.J. Evapotranspiration estimation using the Landsat-5 Thematic Mapper image over the Gyungan watershed in Korea.International
Jour-nal of Remote Sensing, v. 32, n. 15, p. 4327-4341, 2011.
FRENCH, A.N.; HUNSAKER, D.J.; THORP, K.R. Remote sens-ing of evapotranspiration over cotton ussens-ing the TSEB and METRIC energy balance models.Remote Sensing of
Envi-ronment, v. 158, p. 281-294, 2015.
GALLEGUILLOS, M.; JACOB, F.; PRÉVOT, L.; FAUNDEZ, C.; BSAIBES, A. Estimation of actual evapotranspiration over a rainfed vineyard using a 1-D water transfer model: A case study within a Mediterranean watershed.Agricultural
Water Management, v. 184, p. 67-76, 2017.
GILLIES, R.R.; CARLSON, T.N.; CUI, J.; KUSTAS, W.P.; HU-MES, K.S. Averification of the ‘triangle’ method for obtain-ing surface soil water content and energy fluxes from remote measurement of the Normalized Difference Vegetation In-dex (NDVI) and surface radiant temperature.International
Journal of Remote Sensing, v. 18, n. 15, p. 3145-3166,
1997.
HAMIMED, A. Suivi de l’état hydrique d’une région semi-aride dans l’ouest algérien à partir des images de télédétection haute et faible résolution. 2009, p. 179. Ph.D. Thesis -Tlemcen University, Algeria, 2009.
HAMIMED, A.; NEHAL, L.; KHALDI, A.; AZZAZ, H. Contri-bution à la spatialisation de l’évapotranspiration d’un agro-système semi-aride en Algérie par utilisation de la télédé-tection et du modèle METRIC. Géographie Physique et
Environnement, v. 8, p. 197-213, 2014.
HARTANTO, I.M.; VAN DER KWAST, J.; ALEXANDRIDIS, T.K.; ALMEIDA, W.; SONG, Y.; VAN ANDEL, S.J.; SOLOMATINE, D.P. Data assimilation of satellite-based actual evapotranspiration in a distributed hydrological model of a controlled water system.International Journal
of Applied Earth Observation and Geoinformation,
v. 57, p. 123-135, 2017.
JACOB, F.; OLIOSO, A.; GU, X.F.; SU, Z.; SEGUIN, B. Map-ping surface fluxes using airbornevisible, near infrared, ther-mal infrared remote sensing data and a spatialized surface energybalance model.Agronomie, v. 22, n. 6, p. 669-680, 2002.
JATO-ESPINO, D.; CHARLESWORTH, S.M.; PERALES-MOMPARLER, S.; ANDRÉS-DOMÉNECH, I. Prediction of Evapotranspiration in a Mediterranean Region Using Ba-sic Meteorological Variables.Journal of Hydrologic
Engi-neering, p. 04016064, 2016.
KHALDI, A.; HAMIMED, A.; MEDERBAL, K.; SEDDINI, A. Obtaining evapotranspiration and surface energy fluxes with remotely sensed data to improve agricultural water manage-ment. African Journal of Food. Agriculture. Nutrition
and Development, v. 11, n. 1, 2011.
KUSTAS, W.; CHOUDHURY, B.; REGINATO, M.M.R.; JACKSON, R.; GAY, L.; WEAVER, H. Determination of sensible heat flux over sparse canopy using thermal infrared data.Agricultural and Forest Meteorology, v. 44, p. 197-216, 1989.
KUSTAS, W.P; NORMAN, J.M. Evaluation of soil and vegeta-tion heat flux predicvegeta-tions using a simple two-source model with radiometric temperatures for partial canopy cover.
Ag-ricultural and Forest Meteorology, v. 94, n. 1, p. 13-29,
1999.
LI, Z.; LIU, X.; MA, T.; KEJIA, D.; ZHOU, Q.; YAO, B.; NIU, T. Retrieval of the surface evapotranspiration patterns in the al-pine grassland-wetland ecosystem applying SEBAL model in the source region of the Yellow River, China.Ecological
Modelling, v. 270, p. 64-75, 2013.
LIANG, S.; SHUEY, C.; RUSS, A.; FANG, H.; CHEN, M.; WALTHALL, C.; DAUGHTRY, C. Narrowband to Broad-band Conversions of Land Surface Albedo: II. Validation.J.
Remote. Sens. Environ. v. 84, n. 1, p. 25-41, 2002.
MORAN, M.S.; CLARKE, T.R.; INOUE, Y.; VIDAL, A. Esti-mating crop water deficit using the relation between sur-face-air temperature and spectral vegetation index.J.
Re-mote. Sens. Environ, v. 49, n. 3, p. 246-263, 1994.
MUZYLEV, E.L.; USPENSKII, A.B.; STARTSEVA, Z.P.; VOLKOVA, E.V.; KUKHARSKI, I. A.V. Modelling water and heat balance components for the river basin using re-mote sensing data on underlying surface characteristics.
Russian Meteorology and Hydrology, v. 35, n. 3, p.
225-235, 2010.
NORMAN, J.M.; DIVAKARLA, M.; GOEL, N.S. Algorithms for extracting information from remote thermal-IR Observa-tions of the earth’s surface. J. Remote. Sens. Environ, v. 51, p. 157-168, 1995.
OLIOSO, A.; CHAUKI, H.; COURAULT, D.; WIGNERON, J.P. Estimation of evapotranspiration and photosynthesis by as-similation of remote sensing data into SVAT models.J.
Re-mote. Sens. Environ, v. 68, n. 3, p. 341-356, 1999.
ROERINK, G.J.; SU, Z.; MENENTI, M. S-SEBI: a simple remote sensing algorithm to estimate the surface energy balance.J.
Phys. Chem. Earth, v. 25, p. 147-157, 2000.
SEGUIN, B.; ITIER, B. Using midday surface temperature to esti-mate daily evaporation from satellite thermal IR data.Int. J.
Remote. Sens, v. 4, n. 2, p. 371-383, 1983.
STISEN, S.; SANDHOLT, I.; NORGAARD, A.; FENSHOLT, R.; JENSEN, K.H. Combining the triangle method with thermal inertia to estimate regional evapotranspiration-applied to MSG-SEVIRI data in the Senegal River basin.J.
Remote. Sens. Environ, v. 112, n. 3, p. 1242-1255, 2008.
SU, Z. The Surface Energy Balance System (SEBS) for estima-tion of turbulent heat fluxes atscales ranging from a point to a continent.J. Hydrol. Earth. Syst. Sci, v. 6, n. 1, p. 85-99, 2002.
SUN, D.; KAFATOS, M. Note on the NDVI-LST relationship and the use of temperature-related drought indices over North America. Geophysical Research Letters, v. 34, n. 24, 2007.
TEIXEIRA, A.D.C.; BASTIAANSSEN, W.G.M.; AHMAD, M.; BOS, M.G. Reviewing SEBAL input parameters for assess-ing evapotranspiration and water productivity for the Low-Middle Sao Francisco River basin, Brazil: Part A: Calibra-tion and validaCalibra-tion.Agricultural and Forest Meteorology, v. 149, n. 3, p. 462-476, 2009.
TREZZA, R. Evapotranspiration from a remote sensing model for water management in an irrigtion system in Venezuela.
Interciencia. Caracas, v. 31, n. 6, p. 417-423, 2006.
TREZZA, R.; ALLEN, R.G.; TASUMI, M. Estimation of actual evapotranspiration along the Middle Rio Grande of New Mexico using MODIS and landsat imagery with the METRIC model.Int. J. Remote. Sens, v. 5, n. 10, p. 5397-5423, 2013.
VAN DE GRIEND, A.A.; OWE, M. On the relationship between thermal emissivity and the normalized difference vegetation index for natural surfaces. Int. J. Remote. Sens, v. 14, p. 1119-1131, 1993.
XIN, X; LIU, Q. The Two-layer Surface Energy Balance Para-meterization Scheme (TSEBPS) for estimation of land sur-face heat fluxes.J. Hydrol. Earth. Syst. Sci, v. 14, p. 491-504, 2010. doi: 10.5194/hess-14-491-2010.
ZHANG, K.; KIMBALL, J.S.; RUNNING, S.W. A review of re-mote sensing based actual evapotranspiration estimation.
Wiley Interdisciplinary Reviews: Water, v. 3, n. 6,
p. 834-853, 2016.