Original Article
Artigo Original
Alícia Graziela Noronha Silva Salgueiro1 Andressa Sharllene Carneiro da Silva1 Bruna Mara Adorno Marmontel Araújo1 Renata Paciello Yamashita1 Inge Elly Kiemle Trindade1,2
Descritores
Fala Fissura Palatina Insuiciência Velofaríngea Rinometria Acústica Rinomanometria
Keywords
Speech Cleft Palate Velopharyngeal Insuficiency Acoustic Rhinometry Rhinomanometry
Correspondence address:
Inge Elly Kiemle Trindade Alameda Doutor Octávio Pinheiro Brisola, 9-75, Vila Universitária, Bauru (SP), Brasil, CEP: 17012-901. E-mail: [email protected]
Received: 01/19/2015
Study carried out at the Laboratory of Physiology of the Hospital for Rehabilitation of Craniofacial Anomalies, Universidade de São Paulo – USP – Bauru (SP), Brazil.
(1) Laboratory of Physiology, Hospital for Rehabilitation of Craniofacial Anomalies, Universidade de São Paulo – USP – Bauru (SP), Brazil.
(2) Department of Biological Sciences, Bauru School of Dentistry, Universidade de São Paulo – USP – Bauru (SP), Brazil.
Financial support: Fundação de Amparo à Pesquisa do Estado de São Paulo – FAPESP.
Conlict of interests: nothing to declare.
Comparative analysis of velopharyngeal activity
assessed by acoustic rhinometry and rhinomanometry
Análise comparativa da atividade velofaríngea
aferida por rinometria acústica e rinomanometria
ABSTRACT
Purpose: To analyze the velopharyngeal (VP) activity of subjects with velopharyngeal dysfunction (VPD) by acoustic rhinometry, as compared to rhinomanometry. Methods: This was a prospective clinical study conducted in 41 adults, both genders, with repaired cleft palate, with or without a previously repaired cleft lip, and residual VPD on clinical assessment, without compensatory articulations for [p], [t], and [k]. The outcome measures were as follows: (1) on acoustic rhinometry, nasopharyngeal volumetric change (ΔV) during [p], [t], and [k], relatively to rest condition (decreases by <3 cm3 considered as absence of VP activity); (2) on modiied anterior rhinomanometry, VP oriice area (areas ≥0.05 cm2 considered as inadequate closure). The plosive [p] was used when comparing the techniques (n=24). Results: (1) A mean ΔV decrease of 18% was observed during [k], which was signiicantly lower (p<0.05) than the decrease reported for individuals without VPD (30%). ΔV values suggesting VPD were observed in 59% subjects. Similar results were obtained for [p] and [t], which shall be used as stimulus, given that they do not involve the use of the tongue to lift the velum during VP closure, differently from the velar plosive [k]. (2) Inadequate closure was seen in 85% subjects. No correlation was observed between ∆V and VP oriice area. Agreement between techniques was observed in 51% cases.
Conclusion: Acoustic rhinometry had low accuracy as a diagnostic method of VPD when compared to the gold standard method. Nevertheless, the technique shows potential as a method for monitoring the outcomes of clinical and surgical treatment of VPD aimed at increasing velar and pharyngeal activity.
RESUMO
INTRODUCTION
Failure to achieve velopharyngeal closure in the production of oral sounds is generically designated as velopharyngeal dysfunc-tion (VPD), which has signiicant effect on the resonance and other aspects of speech and may lead to hypernasality, nasal air emis-sion, low intraoral pressure, and compensatory articulations(1,2).
The auditory-perceptual assessment is the irst approach to estimate signs and symptoms of VPD(2-4). The use of rating
scales(4-6) and the audio and video recording of speech samples,
with evaluation by judges, have been successful strategies to minimize the inherent subjectivity in this type of evaluation(7,8).
However, there is consensus that the subjective evaluation of VPD should be complemented with instrumental methods such as nasopharyngoscopy, videoluoroscopy, nasometry, and rhi-nomanometry. The latter, also known as pressure-low tech-nique, assesses the aerodynamic aspects of velopharyngeal activity, that is, the functional state of velopharyngeal mecha-nism, providing quantitative data contributing to the evaluation of therapeutic results(9-11).
In addition to these instrumental reference methods, another method proposed in the literature to assess velopharyngeal activ-ity is acoustic rhinometry(12,13). Sondhi and Gopinath(14)
intro-duced this method to assess nasal geometry. This technique allows consecutive measurements of the cross-sectional area and volume of different segments of nasal cavity, from the nos-trils to the nasopharynx. Thereby it helps to identify the exact location of the constrictions that contribute to nasal resistance, in a quick, noninvasive manner and without any active partici-pation of the patient(15).
A study developed at the Laboratory of Physiology of the Hospital for Rehabilitation of Craniofacial Anomalies, in Bauru, São Paulo (HRAC/USP)(6) conirmed, by analyzing the volume
variation of nasopharynx in the production of the voiceless plosive [k], that the acoustic rhinometry was able to identify the deicit of velar movement featuring VPD in most patients clinically diagnosed with inadequate velopharyngeal function. However, some patients presented results suggesting good velar mobility on rhinometry, despite the VPD.
Therefore, as part of a series of studies that have been devel-oped at the Laboratory of Physiology of HRAC/USP to study the eficiency and applications of acoustic rhinometry in the characterization of dysfunctions of velopharyngeal mecha-nism, this study compared the indings of acoustic rhinometry with another instrumental method already established in the literature — rhinomanometry(16). A change in the conventional
technique allows to estimate the cross-sectional area of the velopharyngeal oriice during speech and thereby classify the degree of velopharyngeal closure, based on the hydrokinetic principle that the area of an oriice can be measured knowing the difference of pressure between the sides of the oriice and the airlow through it(9,17-20).
METHOD
The study was approved by the Research Ethics Committee in Human Beings of the HRAC/USP (CAAE 16540513.5.0000.5441),
and the examinations were carried out after the participants or their guardians signed the informed consent.
The study was prospectively conducted at the Laboratory of Physiology of the HRAC/USP. We evaluated 41 individuals with cleft palate, with or without a previously repaired cleft lip, being 21 men and 20 women, aged between 12 and 39 years (22±8 years on average).
For the selection of patients, we analyzed the results of audi-tory-perceptual evaluation of speech, routinely performed in the Laboratory of Physiology by experienced speech language pathologists(1,4,20). The indings were not used for other
pur-poses except the identiication of patients eligible for the study. Patients with compensatory articulation in the production of phone [p] and in the production of phones [p], [t], and [k] simultaneously were not included in the study, and also indi-viduals with residual istulas on the palate and/or pharyngeal lap, with obvious syndromes and signs or symptoms of nasal obstruction, hearing or physical/mental disability, which could compromise the exams.
The rhinometry assessment was performed in all 41 par-ticipants using an Eccovision Acoustic Rhinometer (HOOD Laboratories) and the methodology used by Trindade et al.(6).
The technique is based on the measurement of the relected sound waves (echoes) that emerge from the nasal cavity in response to incident sound waves. It is conducted as follows: the proximal end of a tube, covered by a silicon piece (nose-piece) is leaned in one nostril; a sound wave generated by a loudspeaker propagates through the tube, passes a micro-phone, which is inactive at the moment, and enters the nasal cavity. Variations in the cross-sectional area, that is, any con-straints that reduce the internal diameter of the cavity, cause the relection of sound waves back into the rhinometry tube. Pressure signals sensitize the microphone, now active, and are ampliied and digitized. A computer running speciic soft-ware is used to analyze the signals (Figure 1, adapted from Roithmann et al.(21)). The cross-sectional area of the
differ-ent nasal segmdiffer-ents, from the nostril to the nasopharynx, is
Figure 1. Acoustic rhinometer: instrumentation for the measurement of volumetric dimensions of the nasopharynx
Amplifier
Micr
ophone
5 cm
Tube 24 cm
Low Pass
Filter ConversorA/D Pre
Ampl Speaker
Conversor D/A
PC CPU
Printer
calculated from the echo intensity. The distance of the seg-ments with respect to the nostril is calculated from the wave speed and the echo arrival time. The data are converted into area–distance function and presented on a computer screen in the form of a graphic, the rhinogram, in which the area (in cm²) is shown in semilogarithmic scale on the y-axis and the distance (in cm) on the x-axis. The system makes mea-surements in rapid succession in each test (10 sound pulses are generated approximately every 0.5 seconds) and the soft-ware calculates the average of the sectional areas and volumes of 10 repetitions.
The examination was performed in two stages; the irst reproduces a situation of relaxation of the soft palate (rest) and the second, maximum velopharyngeal activity (speech). Step 1 (rest): once having the rhinometry tube positioned, and after some respiratory cycles of rest, the patient was requested to voluntarily suspend the breath at the end of exhalation and the system was activated for data acquisition. Three replicates were used for each nasal cavity, and the side with the best patency was chosen to analyze the nasopharyngeal volume, that is, the one with the highest average of the nasal valve cross-sectional area measured at the second delection of the rhinogram. Step 2 (activity): the patient was asked to produce the syllable /ka/, keeping the intraoral pressure of the phone [k] for about 5 seconds until the end of data acquisition. The same was repeated for syllables /pa/ and /ta/. The equipment was calibrated at each period of the day and care was taken to minimize possible errors in the measurements(22).
The nasopharyngeal volume at rest (Vr) and during speech activity (Vk or Vp or Vt) was determined by integrating the area–distance curve, from the point of divergence between the rest and speech curves, corresponding to the region of choanas (or posterior border of the hard palate), up to 5 cm from that point. In the cases where the point of divergence was not clearly observed between the curves due to lack of velar mobility, the average distance observed in normal individuals as a starting point was adopted, corresponding to 7.7 cm from the nostrils, analyzing in both cases a 5-cm segment from the choanas corresponding to the nasopharynx.
The volumetric variation of the pharynx (ΔV) was deter-mined by calculating the modulus of difference between the nasopharyngeal volume during production of the voiceless plosive [k] (Vk) and nasopharyngeal volume at velar rest (Vr), that is, |Vk - Vr|, which is the absolute difference (ΔVA). The ratio |Vk - Vr / Vr| was also determined, which corresponds to the relative difference (ΔVR). The same was repeated for the voiceless plosives [p] and [t]. The analysis of the difference between two successive volumetric measurements in the same individual eliminates factors that may interfere with measure-ments made at the posterior portion of the nasal cavity.
All participants also underwent modiied anterior rhi-nomanometry (pressure-low technique) using a comput-erized system PERCI-SARS (version 4.01; Microtronics Corp.). The data were compared with the results of acoustic rhinometry. The technique allows the measurement of the area of the velopharyngeal oriice by the simultaneous mea-surement of differential pressure between the two sides of
a constriction and the airlow during the production of the phone, which requires maximum velopharyngeal activity, usually a plosive. A catheter is positioned within the oral cavity and another in the nostril with lower nasal low, which is held in position by a cark (olive); both measure static air pressure, which is transmitted to pressure transducers. The nasal airlow is measured through a plastic tube adapted to the nostril of higher, which is connected to a heated pneu-motachograph with a pressure transducer. The signals from the three transducers (nasal pressure, oral pressure, and nasal low) are sent to PERCI system for analysis by a speciic software (Figure 2). The system was calibrated once a week with known signals of low (250 mL/s) and pressure (6 cm H2O) using a lowmeter and a water manometer, respectively.
Figure 2. Modified anterior rhinomanometry: instrumentation for measuring the are of velopharyngeal orifice(9)
Pressure
transductor Amplifier
Amplifier
Amplifier Pressure
transductor
Pneumotachograph
Pressure transductor
Printer PC
For the purposes of this study, we analyzed the area of the velopharyngeal oriice during production of the voiceless plosive [p] inserted in the word “rampa,” and evaluated four to six successive emissions of each production per individ-ual. The area considered for analysis represents the average of these multiple productions and is calculated by the pro-gram, from the equation: A=F/k (2 ΔP/d)½, where A=oriice area in cm², F=nasal low in ml/s, k=0.65, ΔP= difference between oral and nasal pressure in cm H2O, and d=air
den-sity in g/cm³. As previously mentioned, patients with com-pensatory articulation in the production of the phone [p] were not included in the study.
The velopharyngeal closure was categorized according to the velopharyngeal area observed: areas <0.05 cm² = adequate closure; 0.05 to 0.19 cm² = marginal closure; and
≥0,20 cm² = inadequate closure (modified from Warren(23)).
To analyze the accuracy of rhinometry, we considered areas
Data analysis
In regard to the acoustic rhinometry, considering that the variable volume follows a normal distribution, with only a slight deviation to the left(24), the results for
nasopharyn-geal volumes at rest and during speech were expressed as mean±standard deviation. For the purposes of this study, we used ΔV=3 cm3 as the normal limit, that is, values below this
limit (ΔV<3cm3) were interpreted as indicative of inadequate
velopharyngeal activity(6).
The significance of differences between the nasopha-ryngeal volumes observed in both conditions studied (rest and velopharyngeal activity) was analyzed using Student’s
t-test for related samples and observed among groups
by Student’s t-test for independent samples. The
sig-nificance of difference between more than two groups (ΔV<3 cm3,
ΔV≥3 cm3, and control) was investigated by
analysis of variance (ANOVA) and, when found significant differences, the Tukey test was used. The volume varia-tion of the nasopharynx (ΔV) and the cross-sectional area of the velopharyngeal orifice were compared by ANOVA and, when found significant, and, when found significant differences, the Tukey test was used. In all tests, p<0.05 was adopted as significance level.
RESULTS
All patients included in the study presented VPD in clin-ical diagnosis, and 59% (24/41) were considered to have marginal velopharyngeal function, and the remaining 41% (17/41) inadequate velopharyngeal function. None showed compensatory articulation in the voiceless plosive [p], 27 showed no compensatory articulation in [k], and 33 in [t]. Adequate articulation of the three plosives, simultaneously, was observed in 24 patients.
Acoustic rhinometry
Analysis of the average values of the nasopharyngeal volume
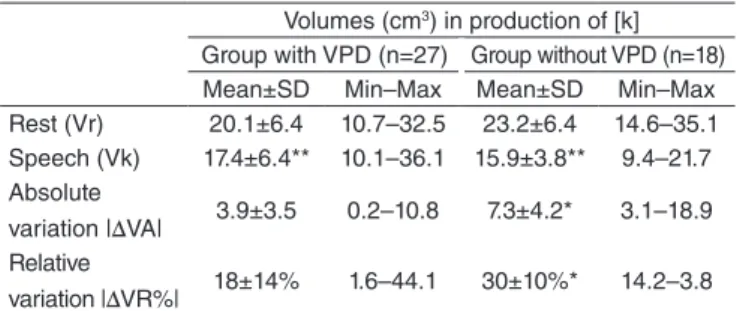
Table 1 shows the mean values of the nasopharyngeal volume at rest and in the production of [k] obtained in 27 subjects with VPD who showed adequate articulation for the plosive. At rest, an average volume of 20.1 cm3 was observed,
which did not signiicantly differ (p=0.116) from the one reported by Trindade et al.(6) in normal individuals (without
VPD), indicating equivalent nasopharyngeal dimensions. In the group with VPD, the average volume decreased to 17.4 cm3 during speech, corresponding to an average
reduc-tion of 3.9 cm3 in absolute terms, and 18% in relative
val-ues. The values obtained at rest and during speech, although close, differed signiicantly (p=0.005), as Trindade et al.(6)
showed for control subjects, but the reduction was signii-cantly lower in the group with VPD, here studied, indicat-ing less velopharyngeal activity.
Table 1. Mean nasopharyngeal volumes obtained at rest and during speech activity in subjects with velopharyngeal dysfunction compared to those observed by Trindade et al.(6) in individuals without VPD, with
equivalent age. Below are mean (± SD), minimum and maximum values, and absolute and relative variation, expressed as a module
Volumes (cm3) in production of [k]
Group with VPD (n=27) Group without VPD (n=18) Mean±SD Min–Max Mean±SD Min–Max Rest (Vr) 20.1±6.4 10.7–32.5 23.2±6.4 14.6–35.1 Speech (Vk) 17.4±6.4** 10.1–36.1 15.9±3.8** 9.4–21.7 Absolute
variation |∆VA| 3.9±3.5 0.2–10.8 7.3±4.2* 3.1–18.9 Relative
variation |∆VR%| 18±14% 1.6–44.1 30±10%* 14.2–3.8
*p<0.05 statistically significant difference (VPD versus no VPD) – t-test; **p<0.05 statistically significant difference (rest versus speech) – paired t-test
Caption: Vr = volume at rest; Vk = volume during production of phone [k]; |ΔVA| =
Vk – Vr; |ΔVR%| = Vk – Vr/Vr; SD = standard deviation; Min = minimum; Max = maximum; VPD = velopharyngeal dysfunction
Table 2 presents the results obtained in the production of [k] recalculated for 24 patients who had no compensa-tory articulation in the [p] and [t] simultaneously, and, for comparison purposes, results in the production of these two other plosives. The results did not statistically differ, both in relation to the average values of the nasopharyngeal vol-ume at rest and during speech, as in relation to the absolute and relative volume variation, validating the measurement technique and the alternative use of the voiceless plosives [p] and [t].
Analysis of individual values of the nasopharyngeal volume
Considering the inding of similar results among the three investigated plosives and the subsequent comparison of the results of acoustic rhinometry with rhinomanometry, which makes use of the voiceless plosive [p], the following analysis is made in the production of this plosive.
Table 3 shows that in the production of the phone [p], 23 of the 41 (56%) patients with VPD showed no signiicant reduc-tion in nasopharyngeal volume during speech activity (ΔV<3), suggesting absent or inadequate velopharyngeal activity. On average, a reduction of 1.2 cm3 (7%) was observed. However,
in other 18 patients (44%), a signiicant decrease in nasopha-ryngeal volume (ΔV≥3) was observed, suggesting the presence of velopharyngeal activity despite the diagnosis of VPD. In this case, the reduction was 6.9 cm3 (31%). The values of the two
subgroups signiicantly differ in rest (p=0.004), in the abso-lute variation (p<0.001) and in the relative variation (p<0.001). These data conirm previous observations of Trindade et al.(6).
Modiied anterior rhinomanometry
Analysis of velopharyngeal closure
All 41 patients who were examined by acoustic rhinometry also underwent modiied anterior rhinomanometry to measure velopharyngeal oriice area. We observed areas ranging from 0.001 cm2 — denoting total velopharyngeal closure, that is, no
gap — to values equal to or greater than 0.20 cm2, indicating
absence of velopharyngeal closure, at least in the production of the plosive [p].
The proportion of cases in each closure category (adequate, marginal, and inadequate) is presented in Table 4, which shows that most patients (73%; 30/41) had inadequate closure (area
≥0.20 cm2), a result consistent with the clinical diagnosis. If added
to these cases those ive with corresponding area to the marginal category, the proportion rises to 85% (35/41). The remaining 15% (6/41) of the sample were categorized as adequate, despite the clinical diagnosis of VPD. The average velopharyngeal areas were found to differ between the three categories considered (p<0.001), reinforcing the diagnostic value of rhinomanometry.
Comparison with the acoustic rhinometry
Table 4 also shows that there was no relationship between the indings of rhinometry and rhinomanometry. That is because no signiicant differences were shown between the average volumetric variations observed in the subgroups with ade-quate, marginal, and inadequate FVF (p=0.800). Moreover, the statistical analysis conirmed the absence of correlation between the individual data obtained by both methods (r=0.14), as shown in Figure 3.
Table 5 shows the analysis of the diagnostic accuracy of acoustic rhinometry compared to the rhinomanometry data (standard method), using a 2x2 table. In rhinome-try, |ΔVA|<3 was considered a positive result (inadequate velopharyngeal activity) and |ΔVA| ≥3 a negative result (adequate velopharyngeal activity). In rhinomanometry, a marginal or inadequate closure was considered a positive result, and adequate velopharyngeal closure as a nega-tive result. In doing so, we found that there was agree-ment in the diagnosis of 21 patients, which corresponds to 51% cases.
Table 2. Mean nasopharyngeal volumes obtained at rest and in different speech activities ([k], [p], and [t]) in subjects with velopharyngeal dysfunction. Below are mean (±SD), minimum and maximum values, and absolute and relative variation, expressed as a module
Volumes (cm3)
Sample [p] Sample [t] Sample [k]
Mean±SD Min–Max Mean±SD Min–Max Mean±SD Min–Max
Rest (Vr) 20.9±6.2 12.1–32.5 20.9±6.1 12.1–32.5 20.9±5.9 12.1–32.2
Speech (V) 18.1±6.4* 11.3–36.2 18.1±5.7* 10.7–31.7 18.4±5.6* 10.4–31.5
Absolute variation |∆VA| 4.2±3.6 0.2–10.8 3.6±2.8 0.2–9.2 3.1±2.9 0.3–10.3
Relative variation |VR%| 18±14% 1.6–44.1 16±12% 1.6–40.9 14±12% 2.1–41.9
*p<0,05 statistically significant difference (rest versus speech) – paired t-test
Caption: Vr = volume at rest; V = volume during speech activity; |∆VA| = V – Vr ; |∆VR%| = V – Vr/Vr; SD = standard deviation; Min = minimum; Max = maximum
Table 3. Mean nasopharyngeal volumes obtained at rest and during speech activity in subjects with velopharyngeal dysfunction, divided into two subgroups according to the volume variation observed (<3 and
≥3 cm3). Below are mean values (±SD), minimum and maximum values,
and absolute and relative variation, expressed as a module
Volumes (cm3) in production of [p]
|∆VA|<3 cm3 |∆VA|≥3 cm3
Mean±SD Min–Max Mean±SD Min–Max
n (%) 23 (56) 18 (44)
Rest (Vr) 17.8±5.8 11.6–32.3 24.9±7.12* 14.8–43.5 Speech (V) 17.1±5.7** 11.1–31.7 18.7±5.9** 9.9–28.8 Absolute
variation |∆VA| 1.2±0.9 0.0–2.9 6.9±3.2* 3.2–14.6 Relative
variation |VR%| 7±5% 0.3–18.4 28±9* 12.4–40.9
*p<0.05 statistically significant difference (| ΔVA | <3 cm3 versus | ΔVA | ≥3 cm3) –
ANOVA/Tukey test; **p<0.05 statistically significant difference (rest versus speech) – paired t-test
Caption: Vr = volume at rest; Vp = volume during production of phone [p]; | ΔVA | = Vp –
Vr; | ΔVR% | = Vp – Vr/Vr; SD = standard deviation; Min = minimum; Max = maximum
Table 4. Absolute and relative variation of the nasopharyngeal volume in production of phone [p] in subjects with velopharyngeal dysfunction, expressed as a module according to the degree of velopharyngeal closure, measured in the production of phone [p], in the word “rampa”, categorized as adequate, marginal, and inadequate in the rhinomanometric examination
Velopharyngeal
closure n (%)
Rhinomanometry Rhinometry Volumetric variation [p] Velopharyngeal
area (cm2)
|∆VA| (cm3) |∆VR| (%)
Mean±SD Mean±SD Mean±SD
Adequate (A) 6 (15) 0.01±0.1 3.3±3.0 18.2±14.3%
Marginal (M) 5 (12) 0.11±0.03 2.8±2.1 13.2±10%
Inadequate (I) 30 (73) 0.77±0.37*# 3.9±4.0 16±13.3%
*p<0.05 statistically significant difference (velopharyngeal area I versus A) – ANOVA/Tukey test; #p<0.05 statistically significant difference (velopharyngeal area I versus M) – ANOVA/Tukey test
DISCUSSION
This research is part of a series of studies being carried out at the Laboratory of Physiology of HRAC/USP to analyze the applications of acoustic rhinometry as an assessment method of the activity of the velopharyngeal structures and its validity(6).
In this study, we compared the indings of the acoustic rhi-nometry with data of the modiied anterior rhinomarhi-nometry. Regarding the rhinometric technique itself, the indings were consistent with a previous study. Reinforcing an original pro-posal of Dalston(12), it was proven, once again, that the technique
can be used to identify deiciencies in velopharyngeal move-ment during speech. The average reduction in nasopharyngeal volume was of 18% in the patients with VPD presently stud-ied, while the variation reported by Trindade et al.(6) in normal
individuals was considerably higher (30%). In absolute values, the variation in dimensions in of the nasopharynx in the speech of normal individuals corresponded to 7.3 cm3. At irst glance
this value may seem small, but we must remember that it is a cubic size (cm3) and not quadratic (cm2), thus representing a
signiicant tridimensional change.
Second, it was found, as in the previous study, that the acoustic rhinometry was not able to conirm the clinical diag-nosis of impairment of velopharyngeal activity in all subjects analyzed, conirming the inconsistency between clinical and rhinometric diagnosis. Therefore, validating the technique against instrumental evaluations already established in the lit-erature became necessary.
So far, no study has compared the indings of acoustic rhinometry with rhinomanometry, and a single study made a comparison to videoluoroscopy(13). These authors
stud-ied the change in velar positioning during the production of a sustained and “silent” /f/ (with the velopharyngeal ice closed) relatively to rest (with the velopharyngeal ori-ice open), investigating if the changes in the volume of the nasopharynx suggested by rhinometry matched the images displayed on videoluoroscopy. The study was conducted with two normal speakers (the authors themselves) and on videoluoroscopy, linear distance measurements were made along a line between the tip of the nose piece and the most anterior point where velar tissue was observed rising above the palatal plane and the most superior point on the nasal surface of the velum during velopharyngeal closure. And in rhinometry, the distance from the point of divergence of the rhinograms obtained at rest and in the production of the same speech sample over the same reference (5cm) was considered. They observed an excellent correlation between both measurements, with a difference of less than 1 cm from each other.
In this study, we used a similar methodology, except for one important difference: the speech samples used for anal-ysis — the phones ([p], [t], and [k]), classiied as occlusive, voiceless, and distinguished as bilabial, alveolar, and velar respectively, by manner of articulation. We avoided the iso-lated use of [k] because this plosive presents as articulators not only the soft palate but also the tongue, a variable not previously controlled. Nasopharyngeal volume was measured in the impounding phase of intraoral pressure, maintained by the patient for a few seconds. Preliminary data from an ongo-ing study usongo-ing videoluoroscopy have shown the absence of participation of the tongue in velopharyngeal closure in all patients studied so far, which reduces the likelihood of such articulation in rhinometry. Independent of this ind-ing, we decided to also use [t], to exclude the inluence of tongue on the volumetric variation observed. Also, [p] was used for purposes of comparison with rhinomanometry, data for which this phone is a standard sample. At irst, we also considered the possibility of including phone /f/, produced in a prolonged and quiet way, as proposed by Dalston(12).
But conirming preliminary observations, its use proved to be unfeasible due to the instability observed in the curves recorded during prolonged production of [f]. This insta-bility was attributed to the friction of expiratory air in its passage through the oral vocal tract, typical of the fricative sound, and more pronounced in patients with VPD. Thus, Figure 3. Relationship between volume variation of the nasopharynx
(|ΔVA|) measured by acoustic rhinometry and area of velopharyngeal orifice (“rampa”) measured by modified anterior rhinomanometry
|∆V
A|
16
14
12
10
8
6
4
2
0
0.0 0.2 0.4 0.6 0.8 1.0 1.2 1.4
Area “rampa”
r=0.14; p>0.050
Table 5. Distribution of individuals with velopharyngeal dysfunction according to velophar yngeal activity measured by acoustic rhinometry (volumetric variation of the pharynx), and rhinomanometry (velopharyngeal closure), in the production of phone [p]
Velopharyngeal activity
Rhinometry (Volumetric variation)
Rhinomanometry (velopharyngeal closure)
Marginal or
Inadequate Adequate Total
|∆VA|<3 cm3
inadequate 19 4 23
|∆VA|≥3 cm3
adequate 16 2 18
Total 35 6 41
the evaluations made during the production of fricative [f] have been disregarded.
Statistical analysis showed that the average volume and the absolute and relative volume variation in the production of [p] and [t] did not differ from those observed for [k]. It is noteworthy that the number of patients correctly iden-tified as having inadequate velopharyngeal activity was similar for the three plosives. Taken together, these obser-vations validate the measurement technique and the com-bined or isolated use of these speech samples for the analysis of velopharyngeal activity, which, in patients with VPD, proves to be very useful, because of the articulation disor-ders that usually affect plosives.
Moreover, we also observed a high proportion of cases that showed noncompatible result with VPD on rhinometry, that is, volumetric variation that indicates good “velar and pharyngeal mobility” in the presence of clinically diagnosed VPD. This observation limits the value of acoustic rhinometry as a diagnostic method of VPD. However, Fukushiro et al.(25)
showed differences in velopharyngeal closure in the produc-tion of syllables compared to sentences in patients with VPD. The authors found that a greater number of patients with repaired cleft lip and palate and VPD achieved adequate velopharyngeal closure on the emission of syllables than in the production of sentences. At least in part, this may be the explanation for the results obtained here because rhinomano-metric examination is based on the production of single syl-lables. In addition among the 41 individuals included in the study, 59% were classiied as having marginal velopharyngeal function, using the protocol proposed by Trindade et al.(4,6).
In marginal cases, velopharyngeal closure can be achieved in short emissions, such as syllables, from aerodynamic strate-gies such as increased breathing effort and thus intraoral pres-sure(26), which may have occurred on rhinometry.
The diagnostic accuracy of a test as the acoustic rhinom-etry to identify a “disease” as VPD requires the study of the relationship between the test result and the occurrence of the disease that needs to be identiied, diagnosed by another test considered gold standard. In this study, we used the mod-iied anterior rhinomanometry, which is a well-established method in the literature for measuring the cross-sectional area of the velopharyngeal oriice(19). The technique has as
advantage that it assesses the velopharyngeal mechanism in its functional aspect, and it is not invasive. The area is usually determined during the production of voiceless bilabial plosive [p] inserted in the word “hamper.” The sequence /mp/ allows to test the velopharyngeal functioning in continuous speech because it requires quick adjustments of the velopharyngeal structures, which go from rest in /m/ to maximum activity in [p](9). The exam showed that most patients (73%) were
clas-siied as having inadequate velopharyngeal function, showing better performance in identifying VPD than acoustic rhinom-etry, which best performance was able to identify VPD in 67% cases (phone [t]). It was also noted that the correspond-ing volume variation to the three categories diagnosed by rhinomanometry did not differ (adequate = 18% reduction; marginal = 13% reduction; inadequate = 16% reduction), and
there was no signiicant correlation between the individual results obtained by both methods, suggesting rhinomanom-etry has a better accuracy as a diagnostic method.
Considering that the accuracy of a test corresponds to the proportion of true positive and true negative cases in relation to the total results(27), to better analyze acoustic rhinometry
performance, it was decided to adjust the classiication of VPD in rhinomanometry to a dichotomous model, that is, present or absent VPD. Therefore, the “marginal” closure was included as “inadequate” in rating. Moreover, consider-ing that in acoustic rhinometry, a positive result (presence of VPD) is the observation of a |ΔVA|<3 (inadequate velopha-ryngeal activity) and a negative result is a |ΔVA|≥3 (adequate velopharyngeal activity) and, in rhinomanometry, a positive result is the observation of marginal and inadequate velopha-ryngeal closure, and a negative result is the adequate closure, low agreement was found among the methods (50%), which deinitely shows low accuracy of rhinometry in identifying VPD. The low agreement between both techniques can be explained by factors related to the prolonged sound tested, prerequisite in acoustic rhinometry:
1. prolonged [p], which does not require much skill of the velopharyngeal mechanism as the sequence /mp/ used in rhinomanometry;
2. loss of sealing ability for deiciency in the contact force between the nasal surface of the soft palate and the poste-rior pharyngeal wall or muscle fatigue, which, as a matter of fact, explains the inconsistent closing at times observed(28);
and/or
3. closure delay(29).
Another limitation to eventually explain the mismatch percentage found between the techniques concerns the fact that the tests were not conducted simultaneously. This means that inconsistent defects may have inluenced measurements at different occasions. We could also question the type of speech sample used, as plosives in syllabic context do not reproduce spontaneous speech. However, this limitation is not exclusive of acoustic rhinometry, it also applies to rhi-nomanometry. What is restricted to rhinometry is the need to extend the articulatory gesture sound that initiate the syl-lable, in this case the plosives, which leads to a somewhat artiicial production that may not represent the operation functioning of the velopharyngeal mechanism in normal con-ditions. As for other possible limitations, widely discussed in other publications of the Laboratory of Physiology of the HRAC/USP(6,22,30), all were considered, in the context of a
project that aims to contribute to the analysis of the feasi-bility of using a technique as a complementary method for assessing velopharyngeal function.
in activity, generated by nasopharyngoscopy and video-fluoroscopy. Faults of the velar activity and/or pharyngeal walls could explain the observations made up to this point. Ongoing studies are exploring these approaches.
CONCLUSION
From the results, we can observe, once again, the capacity of acoustic rhinometry in identifying individuals with VPD. However, the comparison with rhinomanometry showed that its accuracy as a diagnostic method is an unclariied question. In future studies, it is necessary to compare the technique with direct methods of VPD evaluation and test its applications in monitoring therapeutic, surgical, prosthetic interventions in which the patient is control of him/herself. Apparently, it is in this context that acoustic rhinometry can bring major contribu-tions to the ield of Speech Language Pathology.
*AGNSS participated in the idealization of the study, collection, analysis, and interpretation of data, and writing of the article; ASCS, BMAMA, and RPY participated in data collection; IEKT participated in the superior condition, in the idealization of the study, in the analysis, data interpretation, and writing of the article.
REFERENCES
1. Genaro KF, Yamashita RP, Trindade IEK. Avaliação clínica e instrumental da fala na issura labiopalatina. In: Fernandes FDM, Mendes BCA, Navas ALPGP, editores. Tratado de fonoaudiologia. São Paulo: Roca; 2010. p. 488-503.
2. Kummer AW, Clark SL, Redle EE, Thomsen LL, Billmire DA. Current practice in assessing and reporting speech outcomes of cleft palate and velopharyngeal surgery: a survey of cleft palate/craniofacial professionals. Cleft Palate Craniofac J. 2012;49(2):146-52.
3. Kummer AW, Briggs M, Lee L. The relationship between the characteristics of speech and velopharyngeal gap size. Cleft Palate Craniofac J. 2003;40(6):590-6.
4. Trindade IEK, Genaro KF, Yamashita RP, Miguel HC, Fukushiro AP. Proposta de classiicação da função velofaríngea na avaliação perceptivo-auditiva da fala. Pro-Fono R Atual Cient. 2005;17(2):259-62.
5. Abdel-Aziz M. Speech outcome after early repair of cleft soft palate using Furlow technique. Int J Pediatr Otorhinolaryngol. 2013;77(1):85-8. 6. Trindade IE, Araújo BM, Teixeira AC, Silva AS, Trindade-Suedam IK.
Velar activity in individuals with velopharyngeal insuficiency assessed by acoustic rhinometry. J Appl Oral Sci. 2014;22(4):323-30.
7. Lohmander A, Willandsen E, Persson C, Henningsson G, Bowden M, Hutters B. Methodology for speech assessment in the Scandcleft Project: an international randomized clinical trial in palatal surgery experiences from a pilot study. Cleft Palate Craniofac J. 2009;46(4):347-62. 8. Sweeney T. Nasality: assessment and intervention. In: Howard S,
Lohmander A. Cleft palate speech: assessment and intervention. Malden: Wiley-Blackwell; 2011. p. 199-220.
9. Trindade IEK, Yamashita RP, Gonçalves CGAB. Diagnóstico instrumental da disfunção velofaríngea. In: Trindade IEK, Silva Filho OG, organizadores. Fissuras labiopalatinas: uma abordagem interdisciplinar. São Paulo: Santos; 2007. p. 123-43.
10. Hopper RA, Tse R, Smartt J, Swanson J, Kinter S. Cleft palate repair and velopharyngeal dysfunction. Plast Reconstr Surg. 2014;133(6):852e-64e. 11. Kummer AW. Speech evaluation for patients with cleft palate. Clin Plast
Surg. 2014;41(2):241-51.
12. Dalston RM. Acoustic assessment of the nasal airway. Cleft Palate Craniofac J. 1992;29(6):520-6.
13. Seaver EJ, Karnell MP, Gasparaitis A, Corey J. Acosutic rhinometric measurements of changes in velar positioning. Cleft Palate Craniofac J. 1995;32(1):49-54.
14. Sondhi MM, Gopinath B. Determination of vocal-tract shape from impulse response at the lips. J Acoust Soc Am. 1971;49(6):1867-73.
15. Hilberg O, Pedersen OF. Acoustic rhinometry: recommendations for technical speciications and standard operating procedures. Rhinol Suppl. 2000;16:3-17.
16. Bressmann T, Sell D. Plus ça change: selected papers on speech research from the 1964 issue of the Cleft Palate Journal. Cleft Palate Craniofac J. 2014;51(2):124-8.
17. Warren DW, Dubois AB. A pressure-flow technique for measuring velopharyngeal oriice area during continuous speech. Cleft palate J. 1964;16:52-71.
18. Warren DW. Aerodynamics assessment of velopharyngeal performance. In: Bzoch KR, editor. Communicative disorders related to cleft lip and palate. 3th ed. Austin: Little-Brown; 1989. p. 230-45.
19. Zajac DJ. Speech aerodynamics of cleft palate. In: Kummer AW, editor. Cleft palate and craniofacial anomalies: the effects on speech and resonance. San Diego: Singular Thomson Learning; 2001. p. 377-98.
20. Yamashita RP, Trindade IEK. Exames instrumentais aplicados às funções orofaciais. In: Marchesan IQ, Silva IJ, Tomé MC, editores. Tratado das especialidades em fonoaudiologia. São Paulo: Roca; 2014. p. 488-503.
21. Roithmann R, Cole P, Chapnik J, Shpirer I, Hoffstein V, Zamel N. Acoustic rhinometry in the evaluation of nasal obstruction. Laryngoscope. 1995; 105(3 Pt 1):275-81.
22. Gomes AOC, Sampaio-Teixeira ACM, Trindade SHK, Trindade IEK. Nasal cavity geometry of healthy adults assessed using acoustic rhinometry. Braz J Otorhinolaryngol. 2008;74(5):746-54.
23. Warren DW. Aerodynamics assessment and procedures to determine extent of velopharyngeal inadequacy. In: Bzoch KR, editor. Communicative disorders related to cleft lip and palate. 4th ed. Austin: Pro-Ed; 1997. p. 411-37.
24. Corey JP, Gungor A, Nelson R, Liu X, Fredberg J. Normative standards for nasal cross-sectional areas by race as measured by acoustic rhinometry. Otolaryngol Head Neck Surg. 1998;119(4):389-93.
25. Fukushiro AP, Yamashita RP, Sampaio AC, Trindade IE. Velopharyngeal closure following pharyngeal lap surgery assessed by pressure-low technique. In: 10th International Congress on Cleft Palate and Related Craniofacial Anomalies;2005. Set 04-08. Durban, South Africa. Final programme & book of abstracts. p. 202-3.
26. Warren DW. Compensatory speech behaviors in individuals with cleft palate: a regulation/control phenomenon? Cleft Palate J. 1986;23(4):251-60.
27. Flores RE. A Medicina baseada em evidências e o diagnóstico laboratorial. NewsLab. 2005;73:92-103.
28. Nohara K, Tachimura T, Wada T. Levator veli alatine muscle fatigue during phonation in speakers with cleft palate with borderline velopharyngeal incompetence. Cleft Palate Craniofac J. 2006;43(1):103-7.
29. Kummer AW. Cleft palate and craniofacial anomalies: the effects on speech and resonance. San Diego: Singular; 2001. 481 p.


![Table 2. Mean nasopharyngeal volumes obtained at rest and in different speech activities ([k], [p], and [t]) in subjects with velopharyngeal dysfunction](https://thumb-eu.123doks.com/thumbv2/123dok_br/15190830.527496/5.892.462.828.870.1038/nasopharyngeal-volumes-obtained-different-activities-subjects-velopharyngeal-dysfunction.webp)

