Joana de Figueiredo Grazina Justino
Licenciatura em Ciências da Engenharia do Ambiente
Gas emissions on rice culture and its
importance on air quality
Dissertação para obtenção do Grau de Mestre em Engenharia do Ambiente
Perfil Gestão de Sistemas Ambientais
Orientador: Professora Doutora Alexandra de Jesus Branco Ribeiro, DCEA, FCT-UNL
Co-orientador: Doutora Ana Cristina Caldeira da Silva Gouveia Carvalho, CENSE, DCEA, FCT-UNL
Júri:
Presidente: Prof. Doutora Maria Júlia Fonseca de Seixas
Vogais: Prof. Doutor Nelson Augusto Cruz de Azevedo Barros Doutora Corina Luísa Videira de Abreu Fernandes Carranca Prof. Doutora Alexandra de Jesus Branco Ribeiro
Doutora Ana Cristina Caldeira da Silva Gouveia Carvalho
i
as emissions on rice culture and its
importance on air quality
Copyright
© 2013 Todos os direitos reservados a Joana de
Figueiredo Grazina Justino, FCT/UNL da UNL.
A Faculdade de Ciências e Tecnologia e a Universidade Nova de
Lisboa têm o direito, perpétuo e sem limites geográficos, de arquivar e
publicar esta dissertação através de exemplares impressos
reproduzidos em papel ou de forma digital, ou por qualquer outro meio
conhecido ou que venha a ser inventado, e de a divulgar através de
repositórios científicos e de admitir a sua cópia e distribuição com
objectivos educacionais ou de investigação, não comerciais, desde
que seja dado crédito ao autor e editor
iii
Acknowledgements
A great opportunity occurs in your way, do not waste it! This is my purpose of the last four months.
I had the great chance to work and get involved in this project which represents an important challenge for me. It is a pleasure to thank now to those who made this possible.
First of all I would like to thank my mentor Professora Doutora Alexandra de Jesus Branco Ribeiro from FCT UNL, for the opportunity to collaborate in the present project since the day of its presentation till the end and all the support given, so this can be a reality. I am grateful for your unconditional support.
It was not possible without the always present, Doutora Ana Cristina Carvalho my co-mentor: thanks for sharing your knowledge with me, I did appreciate all our week meetings support.
I would also like to thank Doutora Nazaré Couto, Catarina Oliveira, members of the research team of the project, who presented me, at CotArroz, the rice culture in its environment.
Also thanks to CotArroz and Margarida Paiva Brandão from ARBVS for the permition of visiting rice fields and for the available data.
From INIAV/MADRP, I would like to thank the project coordinator Doutora Corina Carranca and Mestre Nuno Figueiredo for their great reception on laboratory and for sharing their knowledge about field information of the last years of the present project.
Other partners of the present project should also be acknowledged.
I must not forget the financial support which allowed me to reach this end. The present study is included in the research project PTDC/AGR-AAM/102529/2008 financed by Fundação para a Ciência e a Tecnologia (Portuguese Foundation for Science and Technology) “Trace gas emissions from Portuguese irrigated rice fields in contrasting soils, by the influence of crop management, climate and increase concentration of CO2 in the atmosphere”.
A big thank for my family (Francisco, Rita e António) and friends involved, for the believe and patience in this journey of my life.
v
Resumo
No sentido de avaliar o impacte das emissões gasosas provenientes do sector agrícola na qualidade do ar foi utilizado o modelo de transporte químico CHIMERE. O modelo considera as emissões devidas aos vários sectores de actividade de origem antrópica e também as devidas à actividade biogénica e com origem natural.
O modelo foi sujeito a testes de sensibilidade fazendo variar apenas as emissões de NH3 provenientes do sector agrícola, de origem antrópica, em regiões onde se identificou a cultura do arroz através das cartas do uso do solo do CORINE Land Cover (versão de 2006). A análise das séries temporais das concentrações de espécies químicas resultantes da aplicação do modelo foram avaliadas em duas regiões: sobre a área de cultura de arroz de Salvaterra de Magos, onde estão localizados os talhões experimentais que estão na base de toda a experimentação levada a cabo no projeto de investigação “Emissões gasosas medidas em campos regados de arroz produzido em dois solos diferentes, em Portugal, por efeito das práticas culturais, do clima e do aumento da concentração de CO2na atmosfera” (PTDC/AGR-AAM/102529/2008); e sobre a região de Lisboa, que se encontra a jusante. Foi feita, também, uma avaliação dos campos de concentrações médias obtidos sobre o domínio de aplicação do modelo CHIMERE durante o período de simulação.
A escolha dos compostos químicos incidiu sobre os compostos azotados nas três fases e em material particulado indiferenciado.
vii
Abstract
In order toassess the impact ofemissions from theagricultural sector to the atmosphere on the air qualitythe chemical transportmodel CHIMERE was applied.The model considersemissions due to the varioussectorsof anthropogenic originandalso due to biogenic activity and natural origin.
Sensitivity tests to the model results concentrations were performed by varying the NH3 emissions from the agricultural sector of anthropogenic origin, over rice culture regions identified throughland useshapes oftheCORINE LandCover(2006 version). The analysis of time seriesconcentrations ofchemicalspeciesresulting from the applicationof the model were evaluated in two areas: on the rice cultivation area of Salvaterra de Magos, where the experimental plots of the research project "Trace gas emissions from Portuguese irrigated rice fields in contrasting soils, by the influence of crop management, climate and increase
concentration of CO2 in the atmosphere" (PTDC/AGR-AAM/102529/2008) are located; and on the Lisbon region,downwind of Salvaterra de Magos.An evaluation of themean concentrations fields obtained over the CHIMERE model domainduringthe simulation period was also done.
The choice of chemical species wasfocused on the nitrogen compounds in the three phases andonundifferentiated particulate material.
ix
Table of Contents
ACKNOWLEDGEMENTS ... III
RESUMO ... V
ABSTRACT ... VII
TABLE OF CONTENTS ... IX
LIST OF FIGURES ... XI
LIST OF TABLES ... XIII
ACRONYMS AND ABBREVIATIONS... XV
1.
INTRODUCTION ... 1
1.1.
R
ESEARCHS
COPE ANDO
BJECTIVES... 2
1.2.
D
ISSERTATIONS
TRUCTURE... 3
2.
LITERATURE REVIEW ... 5
2.1.
M
ASS EXCHANGES BETWEEN THE ATMOSPHERE AND SURFACE ACTIVITIES... 6
2.1.1.
Air pollution emissions ... 6
2.1.2.
Nitrogen cycle ... 9
2.2.
N
ITROGEN COMPOUNDS MEASUREMENTS... 14
2.3.
R
ICEC
ULTURE... 15
2.3.1.
Importance of rice culture ... 16
2.3.2.
Wetlands ... 17
2.3.3.
Nitrogen compounds gas emissions from rice agriculture fields... 18
2.3.4.
Effect of increased temperature and CO
2on growth, yield and quality of
crops ... 20
2.4.
A
IR QUALITY MODELLING SYSTEMS... 21
2.4.1.
European Monitoring and Evaluating Programme (EMEP) Emissions ... 22
2.4.2.
The Chemical transport model CHIMERE ... 29
2.4.3.
Complementary models inside CHIMERE with interest for the present
study ... 31
3.
METHODS AND DATA ... 35
3.1.
C
LIMATEC
ONDITIONS IN THE REGION OF INTEREST... 35
3.2.
C
OTA
RROZD
ATA... 40
3.3.
C
HIMEREM
ODELA
PPLICATION... 41
4.
RESULTS AND DISCUSSION ... 49
4.1.
EMEP
DATA BASE ANDC
OTA
RROZ FIELD MEASUREMENTS... 49
x
5.
CONCLUSIONS ... 69
xi
List of Figures
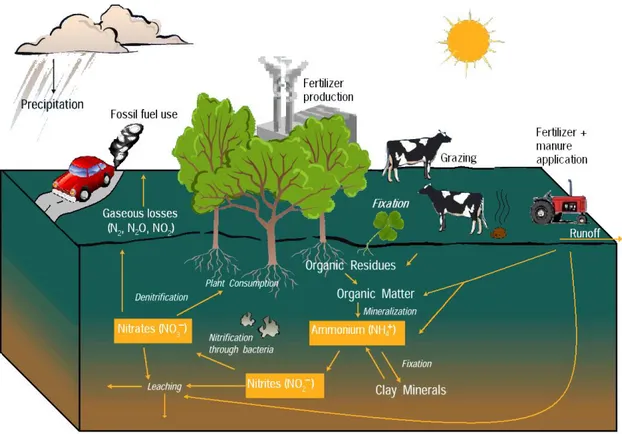
Figure 2.1 - Nitrogen cycle – sources and flows of N (Nol, 2010). ... 9
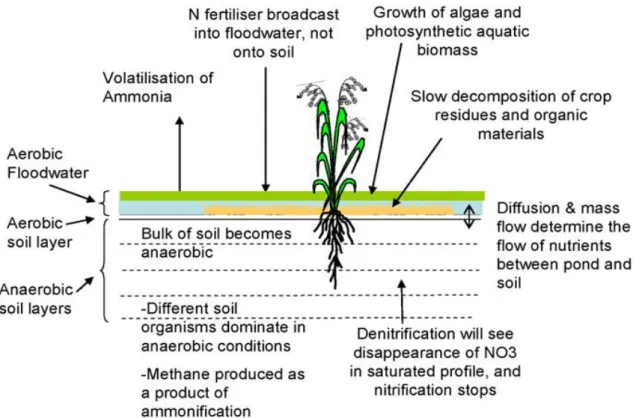
Figure 2.2 - Mechanisms involved in a flooded rice environment (Gaydon et al., 2012). ... 15
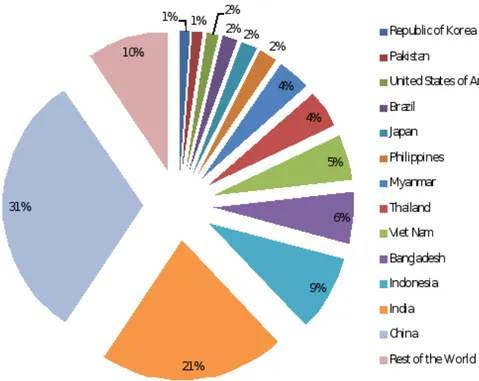
Figure 2.3 - Rice production (%) worldwide from 1992 to 2010 (adapted from FAOSTAT, 2010). ... 16
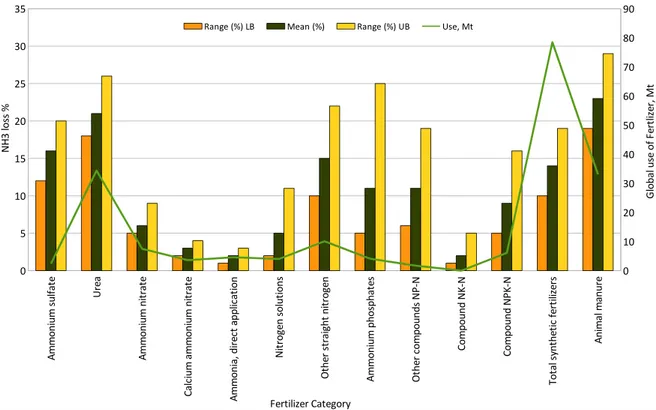
Figure 2.4 - Global consumption and estimated mean and range of NH3 volatilization loss rates for synthetic fertilizer categories (adapted from Bouwman et al., 2002). ... 20
Figure 2.5 - Schematic of chemical and transport processes related to atmospheric composition (Rozaini, 2012). ... 22
Figure 2.6 - National trends of pollutants from 2010 for all sectors of activity (adapted from EMEP database in: http://www.ceip.at/webdab-emission-database). ... 24
Figure 2.7 - National trends of pollutants from 1998-2010 in agriculture sector -S10 (Gg) (adapted from EMEP database in: http://www.ceip.at/webdab-emission-database). ... 25
Figure 2.8 - Methodology for emissions estimations for report to the EMEP programme and the IPCC (APA, 2012). ... 26
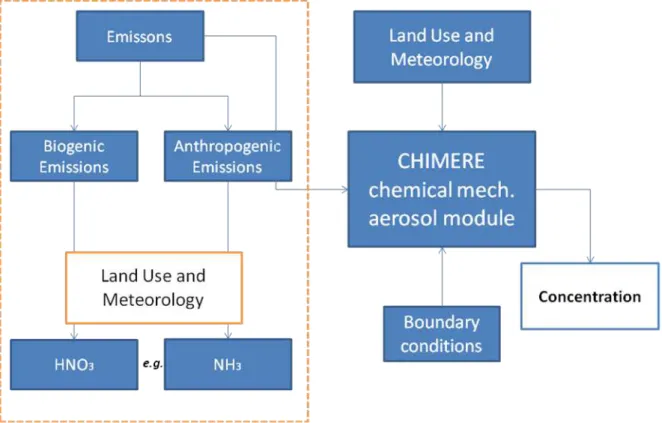
Figure 2.9 - Emissions data of the chemical species of interest for the present work into the CHIMERE model. ... 30
Figure 3.1 - Atmospheric mechanisms in air quality (Sportisse, 2010). ... 35
Figure 3.2 - Temperature and precipitation climate normals in Santarém for the 1981-2010 (provisional) - left column; differential values between climate normal 1981/2010 and 1971/2000 (adapted from IPMA, 2013). ... 37
Figure 3.3 - Monthly averages of daily temperature maximum, minimum and daily averages temperature in 2011 (SNIRH, 2012; ARBVS, 2012). ... 38
Figure 3.4 - Daily values of temperature and precipitation recorded between the 11th May and 10th June 2010 (SNIRH, 2012; ARBVS, 2012). ... 39
Figure 3.5 - Location of CotArroz soil A and soil B. ... 40
Figure 3.6 - Rice fields location in Iberian Peninsula. ... 42
Figure 3.7 - Location of Tejo and Sado rivers rice fields. ... 43
Figure 3.8 - Location of Low Mondego Valley rice fields. ... 44
Figure 3.9 - Representative scheme of grids considered to CHIMERE mechanism. ... 46
Figure 3.10 - Mean sea level pressure fields (white contour lines) over Europe for the 24 (left panel) and 25 of May (right panel) 2011 (http://www.wetterzentrale.de/topkarten/fsreaeur.html). ... 47
Figure 4.1 - EMEP Compounds emission evolution from 1998 to 2010 and total emissions in sector S10 (from T1 in Annexes)... 49
Figure 4.2 - Pollutants NH3 and NOx (Mg) emissions evolution from 1996-2012 in the agriculture sector (S10) over EMEP grid cell 56/6 (EMEP database in: http://www.ceip.at/webdab-emission-database). ... 50
xii
Figure 4.5 - N-NO3- in two different soils in 2010 (adapted from Figueiredo, 2011). ... 52
Figure 4.6 - N-NH4 + in two different soils in 2011 (adapted from Figueiredo, 2011). ... 52
Figure 4.7 - N-NO3 in two different soils in 2011 (adapted from Figueiredo, 2011). ... 52
Figure 4.8 - NH3aq and NH3 time series over Tejo. ... 53
Figure 4.9 - HNO3aq and HNO3 time series over Tejo. ... 54
Figure 4.10 - NOy time series over Tejo. ... 55
Figure 4.11 - pNO3 and pNH3 time series over Tejo. ... 55
Figure 4.12 - HNO3aq and HNO3 time series over Lisbon. ... 56
Figure 4.13 - NH3aq and NH3 time series over Lisbon. ... 57
Figure 4.14 - NOy time series over Lisbon. ... 57
Figure 4.15 - pNO3 and pNH3 time series over Lisbon. ... 58
Figure 4.16 - Time evolution of CHIMERE results on PM10 total and PM10 due to anthropogenic sources over Lisbon and Tejo region. ... 59
Figure 4.17 - Time evolution of CHIMERE results on PM2.5 total and PM2.5 due to anthropogenic sources over Lisbon and Tejo region. ... 60
Figure 4.18 - Time evolution of CHIMERE results on the ratios of (i) anthropogenic PM10 to total PM10 concentrations over Lisbon and Tejo region (left panel) (ii) anthropogenic PM2.5 to total PM2.5 concentrations over Lisbon and Tejo region (right panel). ... 61
Figure 4.19 - Surface concentration fields of NH3 in gas phase (µm/m 3 ) over the Iberian Peninsula at 12H00 UTC. ... 62
Figure 4.20 - Time average surface concentration fields of NH3 in particulate matter (µm/m 3 ) over the Iberian Peninsula, with time average wind field overlapped. ... 63
xiii
List of Tables
Table 2.1 - Atmospheric lifetime of GHG and reactive gases. ... 5
Table 2.2 - Sources and examples of anthropogenic emissions (Beychok and Hogan, 2012). ... 7
Table 2.3 - Sources and examples of biogenic emissions (Beychok and Hogan, 2012). ... 8
Table 2.4 - Area, use of animal manure N, use of synthetic N fertilizers, and NH3 volatilization for wetland rice for different regions of the World for 1995 (based on Bouwman et al., 2002). .. 19
Table 2.5 - NH3 volatilizations emissions factors used by the Portuguese Environmental Agency (APA, 2012) according to fertilizer category. ... 26
Table 2.6 - NH3 volatilizations emissions on the main phases of manure of life cycle (APA, 2012). ... 27
Table 2.7 - Emission factors used in the NH3 volatilizations from animal housing, land spreading and grazing in pasture (kg N-NH3/kg N excreted). ... 29
Table 3.1 - Station characteristics (SNIRH, 2012). ... 38
Table 3.2 - Cultural operations calendar of 2011 (adapted from Figueiredo, 2011). ... 41
xv
Acronyms and abbreviations
ARBVS Associação de Regantes e Beneficiários do Vale da Sorraia
CH2O Formaldehyde
CH3CN Acetonitrile
CH3OH Methanol
CH4 Methane
C2H2 Acetylene
C2H6 Ethane
C2H6O Ethanol
C3H6O Acetone
C3H8 Propane
C4H10 Butane
C5H8 Isoprene
C5H12 Pentane
C6H5CH3 Toluene
C6H6 Benzene
CHIMERE Chemical Transport Model
CLC Corine Land Cover
CO2 Carbon dioxide
CTM Chemical transport models
DMS Dimethyl sulphate
EEA European Environment Agency
EMEP European Monitoring and Evaluation Programme FAO Food and Agriculture Organization of the United Nations
GHG Greenhouse gases
INIAV Instituto Nacional de Investigação Agrária e Veterinária ISORROPIA Thermodynamic equilibrium model
MEGAN Model of Emissions of Gases and Aerosols from Nature MODIS Moderate Resolution Imaging Spectroradiometer
N2O Nitrous Oxide
NH3 Ammonia
NH4 +
Ammonium
O3 Ozone
PM Particulate matter
PM10 Particulate matter with aerodynamic diameter smaller than 10 µm PM2.5 Particulate matter with aerodynamic diameter smaller than 2.5 µm SNIRH Sistema Nacional de Informação de Recursos Hídricos
SOx Sulfur Oxide
INTRODUCTION 1
1. INTRODUCTION
The main objective of this work is to contribute to the understanding of regional air quality models responses of air pollutants concentrations to particulate and gaseous emissions to the atmosphere, resulting from human activities and natural sources, particularly focusing on agricultural activity and emissions from rice cultivation.
The motivation for the present work relies on data collected through the execution of the research project “Trace gas emissions from Portuguese irrigated rice fields in contrasting soils, by the influence of crop management, climate and increase concentration of CO2 in the
atmosphere”, coordinated by Doutora Corina Carranca, researcher at Instituto Nacional de Investigação Agrária e Veterinária – INIAV, Portugal. As stated in the project purpose, flux measurements of nitrogen compounds to the atmosphere from rice cultures are rare in Southern Europe. However, the knowledge of these emissions fluxes is of paramount importance to air quality modeling, both on global and regional scales.
The emissions considered in models are one of the terms, and an important one, of the chemical mechanisms concentrations calculated through diferential equations in several chemical transport models (CTM). This is one of the reasons why the knowledge of emissions fluxes is very important. However, downstream implications may arise from it since these CTM were and are used to develop air quality policies in Europe. As it is the case of the European Monitoring and Evaluation Programme (EMEP) model which since the seventies of last century
start to support the work under the “Convention of Long-Range Transboundary air Pollution”. It has become the reference dispersion model in the frame of the Integrated Assessment Models supporting air quality policies under the EU Commission (EMEP, 2013). Examples are the impacts on air quality of the implementation of the National Emissions Ceilings Directive (NEC Directive), the impact assessment of the Thematic Strategy on Air Pollution, the Directive on
Ambient Air Quality and Cleanear Air for Europe, the “Clean Air For Europe – CAFE”
programme (EU, 2013).
INTRODUCTION 2
In general, the main scope of this study is to assess the sensitivity of a CTM model concentrations results to the nitrogen compounds emissions, as NH3, from the agricultural sector. Due to its wide use, the considered emissions are the ones available by EMEP. The chosen CTM was the CHIMERE model.
The sensitivity study was performed changing the value of the NH3 emissions considered by the model over three main regions over Portugal, which are Mondego, Tejo and Sado Estuaries. Analysis of particulate matter and chemical compounds on gas phase resulting from the CHIMERE model applications were done over a period were rice paddies fertilization has occurred in Salvaterra de Magos, the experimental site of the Portuguese project “Trace gas emissions from Portuguese irrigated rice fields in contrasting soils, by the influence of crop
management, climate and increase concentration of CO2 in the atmosphere”, above mentioned.
The emissions considered by the CHIMERE model during the period of simulation were compared to the ones measured in the site experiment and made available on the last report of the project, early March 2013.
1.1.
R
ESEARCH
S
COPE AND
O
BJECTIVES
What is known about the natural and anthropogenic agents that contribute to air quality, and the underlying processes that are involved?
Indentify importance and complementarily of global and regional projections;
Understanding the processes involved in the exchange of trace gases between the earth´s surface and the atmosphere;
Importance of the emissions of the agricultural sector used as inputs on air quality models;
Analyze how different land cover representations potentially introduce systematic errors into the results of regional N emission inventories;
Analyze NH3 emissions from the agricultural sector;
INTRODUCTION 3
1.2.
D
ISSERTATION
S
TRUCTURE
The present dissertation is divided in the following chapters:
1. Introduction: details of research scope, main objectives and structure of the dissertation are revealed.
2. Literature Review: this chapter includes earlier work developed on the scope, main studies and relation between them.
3. Methods and Data: description of methods of analyses, details how the data will be treated.
4. Results and Discussion: all data obtained by methodology and formulation of hypotheses.
5. Conclusions: responses of the objectives and future investigations.
6. References
LITERATURE REVIEW 5
2. LITERATURE
REVIEW
Air pollutant emissions, either greenhouse gases (GHG), reactive gases or particulate matter, resulting from anthropogenic or natural sources are variable in space and time. However, their atmospheric lifetime1 (or residence time) is highly dependent on the atmospheric chemical specie reactivity and the chemical mechanisms on which they are involved. Examples of few GHG and reactive gases are presented in Table 2.1.
The previously referred research project (Carranca et al., 2013) that motivated the present work presented as principal objectives measuring N and C fluxes and microbial population in two soils cultivated with flooded rice (Oryza sativa L. cv. Ariete) in open field and open chambers, in three replicated plots, during two years (Carranca et al., 2013; Carranca et al., 2012; Carranca et al., 2011; Figueiredo, 2011). Parallel results with interest for the present work are the ones
concerning the emissions due to the fertilization process, since they are responsible for the NH3 agricultural emissions with further impacts on aerosol particles formation in the atmosphere, as will be shown.
The importance on the knowledge of the emissions of the agricultural sector used as inputs on air quality models will also be acknowledged. Hence, the literature review will start with an overview of the exchanges between the atmosphere and surface activities (either anthropogenic or natural), focusing then on rice culture and on the compounds measurements, finally a short mention on air quality modelling systems, their needs as emission input data and uncertainties.
Table 2.1 - Atmospheric lifetime of GHG and reactive gases.
Greenhouse gas Atmospheric lifetime CO2 ~ 100 years
CH4 ~12 years
N2O ~ 114 years
Reactive gases
O3 (in ppb) hours - days
C2H6 2-4 months
C3H8 3 weeks
C2H2 3 weeks
C5H8 1-2 hours
Terpenes 1 hour Dimethyl sulphate (DMS) 1 day
CH2O 2 hours – 2 days
1Atmospheric lifetime, “ The atmospheric lifetime is used to characterize the decay of an instantaneous pulse input to the atmosphere, and can be likened to the
time it takes that pulse input to decay to 0.368 (l/e) of its original value. The analogy would be strictly correct if every gas decayed according to a simple
LITERATURE REVIEW 6 Reactive gases Atmospheric lifetime
CH3CN 0.4 – 1 year
CH3OH 2 weeks
C2H6O 1 week
C3H6O 1 month
C6H6 1 week
C6H5CH3 2 days
Iso-/n-C4H10 2-3 days
Iso-/n-C5H12 2-3 days
*Adapted from CDIAC 2013 and WMO 2013.
2.1.
M
ASS EXCHANGES BETWEEN THE ATMOSPHERE AND
SURFACE ACTIVITIES
Human activities contribute to climate change by causing changes in Earth’s atmosphere in the amounts of greenhouse gases, aerosols (small particles), and cloudiness. The largest known contribution comes from the burning of fossil fuels, which releases carbon dioxide gas to the atmosphere. Greenhouse gases and aerosols affect climate by altering incoming solar radiation
and outgoing infrared (thermal) radiation that are part of Earth’s energy balance. Changing the atmospheric abundance or properties of these gases and particles can lead to a warming or cooling of the climate system. Since the start of the industrial era (about 1750), the overall effect of human activities on climate has been a warming influence. The human impact on climate during this era greatly exceeds that due to known changes in natural processes, such as solar changes and volcanic eruptions (Forster et al., 2007).
For better understanding of the processes involved in the exchange of trace gases and aerosols
between the earth’s surface and the atmosphere it is necessary to consider the soil environment is a complex ecosystem with numerous interacting physical, chemical and biological processes. This complexity is exemplified by transitions between flooded and non-flooded conditions. Some system elements are complex to model and the relevant variables even more complex to measure, making it difficult to directly confirm correct simulation (Gaydon et al., 2012).
2.1.1.
A
IR POLLUTION EMISSIONSLITERATURE REVIEW 7
activities (Beychok and Hogan, 2012). This study will take in to account emissions result from both types: anthropogenic and biogenic sources of air pollution emissions.
Sources of air pollution anthropogenic emissions enclose stationary point sources, which is a single, identifiable source of air pollutant emissions such as combustion furnace flue gas stack or diesel engine exhaust stack. Point sources are also characterized as being either elevated or at ground-level, a point source has no geometric dimensions (Beychok and Hogan, 2012; MDAQMD, 2013).
Another is mobile sources from exhaust emission from vehicles driven by fuel burning engines. Area sources is an area that is a two-dimensional source of diffuse air pollutant emissions such as the emissions from a forest fire, a landfill or the evaporated vapors from a large spill of volatile liquid. Evaporative sources are volatile liquids that, when not completely enclosed in a tank or other container, evaporate and release vapors overtime; controlled burns which occurs in forestry management and in agriculture; waste disposal landfills.
Examples by source, of such anthropogenic emissions are following presented in Table 2.2.
Table 2.2 - Sources and examples of anthropogenic emissions (Beychok and Hogan, 2012).
Source of air pollution Example
Anth ropo ge ni c Em is s io ns
Stationary point sources Combustion furnace flue gas stack
Mobile sources Automobiles, trucks, trains, airplanes, marine vessels. Area sources Methane emissions from livestock
Evaporative sources Solvents, pesticides, perfumes, aerosols sprays and gasoline Controlled burns Release of smoke, ash, dust, CO2, nitrogen oxides and other air
pollutants
Waste disposal landfills Gas escaped from landfill (CH4, CO2 and others)
When we talk about biogenic emissions we consider emissions from sources like volcanic activity; geysers; digestive gases by digestion of food and emitted by animals; oceans, rivers and estuaries by digestive systems of marine life, methanogenesis in sediments and drainage areas along coastal regions and possibly seepage from methane hydrates on the ocean floors. Biogenic sources, a subset of natural sources, include only those sources that result from some sort of biological activity. Biogenic emissions represent a significant portion of the natural source emissions, and VOC, NOx, and the greenhouse gases discussed above can all be emitted from
biogenic sources (Beychok and Hogan, 2012; EPA, 1996).
LITERATURE REVIEW 8
The estimated contributions of these sources may be significant when a modeling domain extends into areas that do not have a high anthropogenic contribution (EPA, 1996).
Other sources are dust from windblown from areas with little or no vegetation such as desert areas; sea salt from windblown sea water; radioactive decay occurring in the Earth´s crust; forest fires created by lightning, or other natural causes (Table 2.3).
It is important to distinguish primary air pollutants and secondary air pollutants. The first ones are those that are directly emitted from an emission source mentioned on Table 2.2 and Table 2.3. The second ones are those that are formed by reactions between the primary air pollutants and normal atmospheric constituents, using energy derived from sunlight. Examples of secondary air pollutants are: sulfuric acid, nitric acid, nitrogen dioxide, ozone, ammonium nitrate and ammonium sulfate.
Table 2.3 - Sources and examples of biogenic emissions (Beychok and Hogan, 2012).
Source of air pollution Example
Biog e ni c E m is s io ns
Volcanoes Smoke, ash, CO2, sulfur dioxide among others
Geysers Hydrogen sulfides, arsenic and other heavy metals
Digestive gases Methane
Oceans, rivers and estuaries Methane
Dust Windblown dust
Sea-salt Windblown sea water that releases sodium chloride
Radioactive decay Radon gas
Forest fires (natural causes) Smoke, ash, dust, CO2, nitrogen dioxides and others
Plants and trees Volatile Organic Compounds (VOC) emissions
Wetlands Methane
Termites Methane
Lightning Nitrogen oxides
Soil outgassing Nitrogen oxides
LITERATURE REVIEW 9
The nitrogen compounds data set regarding the nitrogen cycle of the rice crop in Salvaterra de Magos have permitted the calculation of the NH3 losses from the system soil/plant (Carranca et al., 2013). In order to understand the factors that may have impact in this loss, a small review of the nitrogen cycle was carried out.
2.1.2.
N
ITROGEN CYCLEHuman alteration of the nitrogen cycle represents a major driver of global environmental change (Sutton et al., 2012). As nitrogen is a limiting nutrient in many ecosystems, these modifications of the natural cycling have profound effects on ecosystem function, biodiversity and atmospheric composition.
The highest nitrogen cycle mass flows are found in terrestrial ecosystems mostly because of biological nitrogen fixation from free living microorganisms or symbiotic nitrogen fixing plants, and also due to the decomposition of organic matter which may occur both as denitrification to nitrous oxide and volatilization of ammonia (Figure 2.1). Nitrogen is often most limiting in many ecosystems, as only few bacteria can fix nitrogen. Plants from the legume family (Fabaceae or Leguminosae) like clover, host N-fixing bacteria in their roots as suppliers of reactive forms of
nitrogen - NO3 ¯
and NH4 +
(Watanabe and Ortega, 2011; Nol, 2010).
LITERATURE REVIEW 10
According to Nol, (2010), human activities are responsible for causing increased nitrogen deposition in a variety of ways, including burning of both fossil fuels and forests, which releases nitrogen into the atmosphere, fertilizing crops with nitrogen-based fertilizers, which then enter the soil and water, ranching, during which livestock waste releases ammonia into the soil and water, allowing sewage and septic tanks to leach into streams, rivers, and groundwater.
The consequences of human-caused nitrogen deposition are profound and influence many aspects of the Earth system, including ecosystems: nitrogen additions to the soil can lead to changes that favor weeds over native plants, which in turn reduce species diversity and changes ecosystems. Research shows that nitrogen levels are linked with changes in grassland species, from mosses and lichens to grasses and flowers; precipitation: nitrogen oxides react with water to form nitric acid, which along with sulfur dioxide is a major component of acid rain.
Acid rain can have broad impacts in several human made structures as well as on different reservoirs, it may damage and kill aquatic life and vegetation:
on human building structures, it can corrode buildings, bridges, and other structures;
on air quality: high concentrations of nitrogen oxides in the lower atmosphere are a precursor to tropospheric ozone which is known to damage living tissues, including human lungs, and decrease plant production;
on water quality: adding large amounts of nitrogen to rivers, lakes, and coastal systems results in eutrophication, a condition that occurs in aquatic ecosystems when excessive nutrient concentrations stimulate blooms of algae that deplete oxygen, killing fish and other organisms and ruining water quality. Parts of the Gulf of Mexico, e.g., are so inundated with excess fertilizer that the water is clogged with algae, suffocating fish and other marine life;
on the carbon cycle: the impacts of nitrogen deposition on the global carbon cycle are uncertain, but it is likely that some ecosystems have been fertilized by additional nitrogen, which may boost their capture and storage of carbon. Sustained carbon sinks are unlikely, however, because soil acidification, ozone pollution, and other negative effects eventually compromise nitrogen-enhanced carbon uptake.
LITERATURE REVIEW 11
also a precursor to nitric acid, a principal component of acid deposition; (Nol, 2011; Choudhury and Kennedy, 2005).
Five gases, NH3, N2O, NO, NO2 and N2, dominate the movement of nitrogen between the earth's surface and the atmosphere (Jenkinson, 2001).
Nitrogen oxide (NOx)
Nitrogen oxides are emitted by soil microbes during nitrification and denitrification processes. Yienger and Levy (1995) compute NO emission fluxes as a function of vegetation type, temperature, precipitation history, fertilizer usage if any, and a canopy reduction factor, η.
Parameter η is the fraction of soil emitted NOx that is deposited within the canopy before it is exported to the atmosphere; it reflects the oxidation of NO to NO2 in the canopy air followed by uptake of NO2 by vegetation (Jacob and Bakwin, 1991). NOy refers to all oxides of nitrogen, principally NO2, NO, nitric acid, dinitrogen pentoxide, nitrate aerosol and peroxyacetylnitrate. Deposition fluxes of NO2 are more commonly observed than emission fluxes (Skiba et al., 1997).
NOx are a class of compounds that are respiratory irritants and that react with VOC to form ozone (O3). The primary combustion product of nitrogen is nitrogen dioxide (NO2). However, several other nitrogen compounds are usually emitted at the same time (nitric oxide [NO], nitrous oxide [N2O], etc.), and these may or may not be distinguishable in available test data. The convention followed in emission factor documents is to report the distinctions wherever possible, but to report total NOx on the basis of the molecular weight of NO2. NOx compounds are also precursors to acid rain. Motor vehicles, power plants, and other stationary combustion facilities emit large quantities of NOx (EPA, 2001).
For regional climate model applications, due to the chemical species involved which are also part of the chemical mechanisms of the majority of the CTM, the most interesting reactions are the nitrification, the nitrifier - denitrification and denitrification,
Nitrification
The oxidation of NH4 +
(ammonium) to NO2
(nitrite) and to NO3 -
(nitrate),
Nitrifier Denitrification NO3
and NO2
are transformed into N2 and N2O
Denitrification The reduction of NO3
LITERATURE REVIEW 12
Nitrous oxide is emitted by human activities such as fertilizer use and fossil fuel burning. Natural processes in soils and the oceans also release N2O. Nitrous oxide and NO are products of the denitrification process in soil. The formation of N2O is associated with high nitrate concentrations in soil, with environments which are not strongly reducing and with acid soils. The main concern about N2O and NO has to do with their role in ozone destruction (Shaviv and Mikkelsen, 1993)
N2O emissions affected by nitrogen fertilizers were measured in rice paddy fields under intermittent irrigation in 1994, by Cai et al., (1997). Their results shows that N2O emission increased significantly with the increase in the nitrogen application rate and the N2O flux was very small when the rice paddy plots were flooded, but peaked at the beginning of the disappearance of floodwater.
Ammonia (NH3)
Volatilization
NH3 emissions are related to agricultural activities such as storage of manure, soil fertilizing, animal husbandry. Particularly conditions in lowland (wetlands) rice field are conducive to ammonia volatilization loss. During the volatilization process, gaseous ammonia is formed:
NH4 +
↔ NH3 + H +
(2.1)
That is, H+ is released for each conversion of:
NH4 +
→ NH3 (g)
(2.2)
The pH and buffering capacity of oxidized, as well as reduced, soil layers, thus influence the process. The overall inorganic ammonium nitrogen (equilibrium) system (Nt) in floodwater can be written as:
Nt = NH3 (aq) + NH4 +
(2.3)
According to Batyee et al., 1994 and FAO, 2004, influencing factors of NH3 emissions include:
Meteorological conditions such as temperature, air humidity, wind speed and precipitation. In generally, emissions increase with temperature, but decrease with air humidity and during and after precipitation periods. The temperature increase the relative proportion of NH3 to NH4
+
LITERATURE REVIEW 13
increases the diffusion of NH3 away from the air-water or air-soil interface. Wind speed regulates the exchange between soil and air;
Irrigation water as a regulating factor;
Properties of soil (pH, calcium content, water content, buffer capacity and porosity. The emissions generally increase with pH, calcium content, and porosity, but decrease with increasing buffer capacity and water content;
Properties of manures (pH, viscosity, content of dry matter). The emissions generally increase with increasing pH, viscosity and content of dry matter. A high viscosity prevents the manure or fertilizer form entering the soil;
Fertilizer applied/area. The fraction of N in manure which evaporates increases with the amount applied;
The way of applying the manure or fertilizer. If it is by injection, a much lower emission results (Batyee et al., 1994; FAO, 2001).
Atmospheric methane (CH4) is mainly originated from biogenic sources, such as rice paddies and natural wetlands; the former account for at least 30 % of the global annual emission of methane to the atmosphere. Approximately 10-30 % of the methane produced by methanogenesis in rice paddies is consumed by methane-oxidizing bacteria associated with the roots of rice. Methane has increased as a result of human activities related to agriculture, natural gas distribution and landfills. Methane is also released from natural processes that occur, for example, in wetlands. Methane concentrations are not currently increasing in the atmosphere because growth rates decreased over the last two decades (Forster et al., 2007).
The reasons for the decrease in the atmospheric CH4 growth rate and the implications for future changes in its atmospheric burden are not understood (Prather et al., 2001) but are clearly related to changes in the imbalance between CH4 sources and sinks. Most CH4 is removed from the atmosphere by reaction with the hydroxyl free radical (OH), which is produced photochemically in the atmosphere (Prather et al., 2001).
Methane will introduce long-term climate forcings. However, in the short term the environmental problems involved on these processes are eutrophication and acidification of natural ecosystems. In the denitrification process it is expected the formation of tropospheric ozone, a major atmospheric pollutant that affects human health, agricultural crops, and natural ecosystems.
LITERATURE REVIEW 14
algal inhibitors; deep placement of nitrogen fertilizers; and use of modified forms of urease and a slow-release fertilizers (Choudhury and Kennedy, 2005).
As pointed out in the introductory part and is further developed under the section 2.4 (Air quality modelling systems), measurements of nitrogen compounds emissions to the atmosphere are crucial to further development on emissions estimates to be included in emission inventories and subsequent use atmospheric composition assessment and studies. Due to the implications of several aspects above described, on the emissions from the ecossystems (natural or from agriculture), the knowledge on fluxes compounds is limited.
2.2.
N
ITROGEN COMPOUNDS MEASUREMENTS
Regarding the nitrogen cycle and its influence on the GHG balance, several partners from all over the world joined together in the NitroEurope project (NEU, 2013a). Within this project, nitrogen and GHG were measured, and budgets were calculated for 56 sites across Europe. The sites cover the main European climate zones and key ecosystems types: 30 forests, 8 wetlands/shrublands, 9 grasslands and 9 arable. Given the infeasibility of deploying a large network for all reactive nitrogen (Nr) measurements, a measurement strategy was developed that matches different data objectives to three levels of measurements. This tiered strategy included 3 different levels (NEU, 2013a):
Level 1: 56 'Inferential Sites', combining basic reactive nitrogen concentration monitoring and indicators with micrometeorological data-sets to infer nitrogen fluxes;
Level 2: 9 'Regional Sites', focusing on long-term time integrated flux measurements, increasing regional coverage;
Level 3: 13 'Super Sites' with intensive measurements quantifying nitrogen budgets and advancing process understanding.
Portugal was also a partner in this project, where two sites were located. These sites are classified as Level 1 and represents two types of ecosystems grassland (Mitra) and forest (Espirra) (NEU 2013b).
The obtained results under the frame of the project “Trace gas emissions from Portuguese irrigated rice fields in contrasting soils, by the influence of crop management, climate and
LITERATURE REVIEW 15
2.3.
R
ICE
C
ULTURE
Rice paddy ecosystems are complex, with crop growth, soil thermo–hydro conditions, and microbial activities interacting through a number of processes. For example, any change in irrigation will simultaneously affect the temperature, moisture, pH, Eh, and substrate concentration in the soil. The altered soil environmental factors will simultaneously and collectively affect a series of biochemical or geochemical reactions that finally determine transport and transformation of the chemical elements, including C sequestration and trace gas emissions. There is usually not a linear or monotonic correlation between the cause and the result. Only models containing the fundamental processes can be capable of predicting the behaviors of the complex systems (Li et al., 2006).
Figure 2.2 presents the mechanism involved in a flooded rice environment, according to Gaydon et al. (2012).
Figure 2.2 - Mechanisms involved in a flooded rice environment (Gaydon et al., 2012).
LITERATURE REVIEW 16
2.3.1.
I
MPORTANCE OF RICE CULTUREAccording to FAOSTAT (2010), rice paddies from 1992 to 2010 present China as the major rice producer of the world with 1.875 x 10⁸ tonnes, representing 31 % of world production (Figure 2.3). India follows the tendency with a close percentage of 21 %, becoming second world producer. Asia, by cultural alimentary reasons, climate conditions, soil properties among others allows and represents the highest producers and consumers of this cereal.
Figure 2.3 - Rice production (%) worldwide from 1992 to 2010 (adapted from FAOSTAT, 2010).
Rice culture will be productive under certain condition and environment including soil, water and nutrients. Some researchers have shown that traditional method with continues flooding need tremendous amount of water for rice cultivation and gives low water productivity. To increase the water productivity, a number of water saving irrigation techniques have been studied and applied. Sujono et al., (2011) studied the effect of number of a water irrigation treatments on water productivity of rice.
To improve water use efficiency is necessary in every aspect of life, including irrigation to support agriculture, especially for paddy cultivation. This is a major challenge for paddy rice cultivators, to increase the water productivity (Hidayah et al., 2009; Sujono et al., 2011).
LITERATURE REVIEW 17
sequestered about 1.74 billion tones of CO2 from the atmosphere to produce about 1.16 billion tonnes of biomass at 0% moisture content (FAO, 2004).
2.3.2.
W
ETLANDSThe Intergovernmental Panel on Climate Change (IPPC) considers wetlands (peat lands, marshes, bogs and mangroves) a globally major carbon store and that understanding is increasing, so in 2011 they decided to extend their methods to cover wetlands. More available information is expected to be published in the next year (Krug and Hiraishi, 2012).
A range of solutions has been proposed to meet the challenges of providing food security while adapting to climate change and reducing the environmental footprint of agriculture. The global bodies such as the United Nations Framework Convention on Climate Change (UNFCC), the Group of 20 nations (G20) and the United Nations Convention on Sustainable Development (Rio+20) have a fundamental role in the adoption of appropriate policy and financial actions to support implementation of these solutions on a global level.
Food insecurity and climate change are already inhibiting human well-being and economic growth throughout the world and these problems are poised to accelerate. Countries vary in their vulnerability to climate change, the amount and type of GHG they emit and their opportunities to reduce GHG emissions and improve agricultural productivity (Beddington et al., 2012).
Recommendations from the Commission on Sustainable Agriculture and Climate Change include (Beddington et al., 2012):
1. Integrate food security and sustainable agriculture into global and national policies; 2. Significantly raise the level of global investment in sustainable agriculture and food
systems in the next decade;
3. Sustainably intensify agricultural production while reducing GHG emissions and other negative environmental impacts of agriculture;
4. Develop specific programmes and policies to assist populations and sectors that are most vulnerable to climate change and food security;
5. Reshape food access and consumption patterns too ensure basic nutritional needs are met to foster healthy and sustainable eating patterns worldwide;
6. Reduce loss and waste in food systems, targeting infrastructure, farming practices, processing, distribution and household habits;
LITERATURE REVIEW 18
2.3.3.
N
ITROGEN COMPOUNDS GAS EMISSIONS FROM RICE AGRICULTUREFIELDS
The five nitrogen compounds gases above identified as dominating the movement between earth's surface and the atmosphere were NH3, N2O, NO, NO2 and N2 (Jenkinson, 2001). Since N2O is a GHG not considered into the chemical mechanism of regional CTM, N2 is the major gas present in the atmosphere (~ 78 % by volume), major interest arise on the emissions of NO, NO2 and NH3, namely derived by the fertilizer application.
Yan et al., (2003) refer that the percentage of NO emitted due to fertilization over rice crop fields over Southern East, East and Southern Asia is around 0,48 %.
According to authors cited by Figueiredo (2011), volatilization of NH3 may be 50 % of the N in fertilizer applied application. These discrepancies justified the values encountered by EMEP estimations in the agricultural sector in Portugal.
Previous work carried out by Mathews (1994) has identified that the most widely used fertilizers are urea and NH4NO3. The estimate as their annual consumption rates are of 28 Tg N and 17 Tg N, respectively, which together account for 64 % of the total global N use. In terms of cost, urea is much cheaper than NH4NO3 and is predominantly applied in Asia and South America. NH4NO3 is most commonly used in Europe and North America (Skiba, 2007).
Bouwman et al., (2002) have compiled a set of 1667 NH3 volatilizations measurements. In their work the authors have assessed several factors influencing the NH3 volatilization due to fertilization on several crop types, namely crop type, fertilizer type, and rate and mode of application and temperature, as well as soil organic carbon, texture, pH, CEC, measurement technique, and measurement location. Based on their work, Table 2.4 summarizes what they have found only for wetland rice crops in several regions of the world.
LITERATURE REVIEW 19 Table 2.4 - Area, use of animal manure N, use of synthetic N fertilizers, and NH3 volatilization for wetland
rice for different regions of the World for 1995 (based on Bouwman et al., 2002).
Region
Fertilized Animal manure N Area, Mha N use kt NH3-N loss kt N use kt NH3-N loss kt
U.S.A 1 168 15 10 2
Central America 0 32 5 3 0
South America 3 234 43 32 5
North Africa 1 78 16 3 1
Western Africa 1 26 4 3 1
Eastern Africa 1 1 0 6 1
Southern Africa 0 3 0 2 0
OCDE Europe 0 32 3 7 1
Eastern Europe 0 1 0 0 0
Former USSSR 1 14 1 15 2
Middle East 1 71 18 2 1
South Asia 44 4646 1031 965 175
East Asia 26 4490 829 1650 276
Southeast Asia 35 1811 335 396 62
Oceania 0 12 2 0 0
Japan 2 171 24 175 28
Total 117 11788 2328 3270 555
Based on the presented studies, Bouwman et al., (2002) have developed a model to estimate the global NH3 losses to the atmosphere from agriculture on a grid of 0.5° resolution data on land use and soils.
Sommer et al., (2004) have also organized in a review paper filed and laboratory experimental data regarding NH3 volatilization from fertilizers and fertilized crops. They concluded this loss ranges between 0 and 50 % of the nitrogen applied as fertilizers. This interval is dependent on the fertilizer type, soil parameters as calcium content, cation exchange capacity, acidity and meteorological conditions, namely temperature, wind speed and rain.
LITERATURE REVIEW 20 A m m o n iu m s u lf a te Ur e a A m m o n iu m n it ra te C a lc iu m a m m o n iu m n it ra te A m m o n ia , d ir e ct a p p lic a ti o n Ni tr o ge n s o lu ti o n s O th e r st ra igh t n it ro ge n A m m o n iu m p h o sp h a te s O th e r co m p o u n d s N P -N C o m p o u n d N K -N C o m p o u n d N P K -N T o ta l s yn th e ti c fe rt ili ze rs A n im a l m a n u re 0 5 10 15 20 25 30 35 0 10 20 30 40 50 60 70 80 90
Range (%) LB Mean (%) Range (%) UB Use, Mt
Fertilizer Category NH 3 lo ss % G lo b a l u se o f F e rt liz e r, Mt
Figure 2.4 - Global consumption and estimated mean and range of NH3 volatilization loss rates for
synthetic fertilizer categories (adapted from Bouwman et al., 2002).
Studies cited by the European Environmental Agency on the emission inventory guidebook (EEA, 2012), focused on flooded rice soils pointed that NH3 losses due to fertilization is greater than from other cropping systems (work performed by Fenn and Hossner 1985). Older work carried out by Vlek and Crasswell (1979) have shown that NH3 losses depend on the fertilizer type ranging from 50 % tp 60 %, if urea or ammonium sulfate was applied respectively. Also over flooded soils, the EMEP, 2009 show ammonia losses median values of 30 %, framed in a range between 8-56 %.
The above mentioned studies give an insight of the uncertainties expected for NH3 loss estimation, mainly for rice croplands.
2.3.4.
E
FFECT OF INCREASED TEMPERATURE ANDCO
2 ON GROWTH,
YIELDAND QUALITY OF CROPS
Rise in atmospheric temperature (+1 to +3 ºC) caused substantial reduction in yield of rice, groundnut and wheat at varying N levels.
LITERATURE REVIEW 21
economic yield of rice, groundnut and wheat substantially at low, medium and high N levels owing to increase in leaf area, photosynthetic rate, spikes and grains/spike. Elevated CO2 caused a reduction of grain protein content in rice and wheat, while it increased under high temperature (IARI, 2011).
Flooded rice culture studies carried out by Allen et al., (2003) evidence that both elevated CO2 and higher temperatures cause increased CH4 emissions in flooded rice culture they also showed that the effect of the combination of CO2 enrichment and elevated temperature on increasing photosynthetic CO2 uptake, and subsequent impact of increasing photosynthesis on increasing CH4 emissions.
2.4.
A
IR QUALITY MODELLING SYSTEMS
The use and interpretation of complex models through models that are either conceptually simpler, or limited to a number of processes or to a specific region, have been investigated, therefore enabling a deeper understanding of the processes at work or a more relevant comparison with observations. With the development of computer capacities, simpler models have not disappeared; on the contrary, a stronger emphasis has been given to the concept of a
‘hierarchy of models’ as the only way to provide a linkage between theoretical understanding and the complexity of realistic models (Held, 2005). The notion of model hierarchy is linked to the idea of scale: global circulation models are complemented by regional models that exhibit a higher resolution over a given area, or process oriented models, such as cloud resolving models or large eddy simulations (Solomon, 2007).
Atmospheric composition studies on the physical and chemical processes associated to it are mainly done on global and regional scales. Recently, due to the increase on power computional efforts, they are also made with models at local scale. These studies comprehend past (e.g. PMIIP, 2009), actual and future (IPPC, 2007a).
For example, in the 2007 IPCC report on The Physical Science Basis, the so call AR4 reports, global ozone budget estimates are driven by 13 global chemical transport models (IPPC, 2007b), developed mainly by European and North American Research Institutions. The results obtained by these models are subject of analysis but may also be used as inputs in a hierarchy of models from global to local scale, passing through the regional scale.
Regarding air quality issues, climate change scenarios impacts (IPCC 2007a, AR4), compliance policies (e.g, http://www.ec4macs.eu/) and air quality forecast (http://www.gmes-atmosphere.eu/services/aqac/) are three main fields of these model cascate applications. For
LITERATURE REVIEW 22
chemical transport models. However, due to its atmospheric lifetime, on regional applications GHG are considered well mixed in the atmosphere since their reactions are slow when compared to the time step of the model run calculations. In this case, emissions of reactive gases and particulate matter are of great concern.
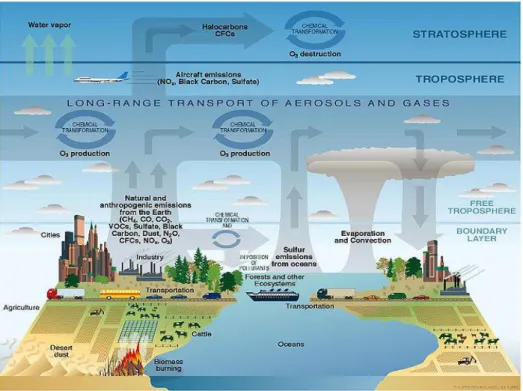
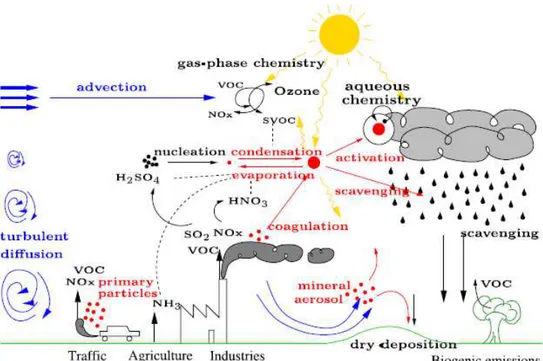
In the present study regional Eulerian chemical transport models was used. These models are forced by global concentrations at their lateral and top boundaries, meteorological fields (including information on temperature, wind, cloudiness, radiation, relative humidity, among others), air pollutants emissions, orography, land use, with the objective to produce atmospheric concentration species (Figure 2.5). These concentrations are calculated in time updating all the variations in the above mentioned factors.
Figure 2.5 - Schematic of chemical and transport processes related to atmospheric composition (Rozaini, 2012).
2.4.1.
E
UROPEANM
ONITORING ANDE
VALUATINGP
ROGRAMME(EMEP)
E
MISSIONS“The European Monitoring and Evaluation Programme (EMEP) is a scientifically based and
policy driven programme under the Convention on Long-range Transboundary Air Pollution
LITERATURE REVIEW 23
In order to achieve its goals, the EMEP programme has four main task forces were assigned and work is performed in five centers, which relies on three main activities: collection of emission data, measurements of air quality as well as precipitation quality and modelling of atmospheric transport and deposition of air pollutions. As already previously pointed out the EMEP model is one of the reference models regarding policy compliance and European legislation concerning the air pollutants concentrations and depositions obtained by it.
Hence, and up to recent times, due to the amount of data and coordination among the reporting countries, the emissions collected by the EMEP programme were the only ones available for regional chemical transport models applications. These emissions are available as officially reported by the Parties to the Convention on Long Range Transboundary Air Pollution to the EMEP programme and as grid emissions to be used, primarily by the EMEP dispersion model, but also by other models, namely by the CHIMERE model and the EURAD model (Colette et al., 2011). Other studies, comparing chemical transport model results over Europe considering the EMEP emissions, may be found in Vautard et al., (2009).
Figure 2.6 presents the portuguese trends of pollutants from 2010 for all sectors of activity (adapted from EMEP database in: http://www.ceip.at/webdab-emission-database).
The grid EMEP emissions considered by the air quality models includes several reactive pollutants emitted by eleven sectors. The pollutants are: CO (carbon monoxide), NH3 (ammonia), NMVOC (non methane volatile organic compounds), NOx (nitrogen oxides as NO2), SOX (sulphur oxides as SO2), PMcoarse and PM2.5. These pollutants are then considered to be emitted by Sector 1 (S1) - Combustion in energy and transformation industries; S2 - Non-industrial combustion plants; S3 - Combustion in manufacturing industry; S4 - Production processes; S5 - Extraction and distribution of fossil fuels and geothermal energy; S6 - Solvents and other product use; S7 - Road transport; S8 - Other mobile sources and machinery; S9 - Waste treatment and disposal; S10 - Agriculture and S11 – Other sources (http://webdab1.umweltbundesamt.at/scaled_country_year.html?cgiproxy_skip=1).
LITERATURE REVIEW 24 Figure 2.6 - National trends of pollutants from 2010 for all sectors of activity (adapted from EMEP
database in: http://www.ceip.at/webdab-emission-database).
From the EMEP official data used in the models (http://www.ceip.at/webdab-emission- database/emissions-as-used-in-emep-models/), as the CHIMERE model, the emissions
reported regarding the year 2010 (updated in 2012) in Figure 2.6, it is possible to identify S2 and S7, respectively, non-industrial combustion plants (stationary sources) and road transport, as major activities of CO emissions. NH3 emissions are clearly emitted by S10 – Agriculture as long as S9 – waste treatment and disposal but in a smaller quantity. Solvent use and other product use (S6), production processes (stationary sources) (S4) and S7 present the highest values of NMVOC emissions, followed by S2, S9 and S3 – combustion in manufacturing industry (stationary sources). NOx (as NO2) are emitted by road transport in a very high scale and followed by S3 and S8 -other mobile sources and machinery, as long as S1 – combustion in energy and transformation industries (stationary sources). S1 and S3 present a similar emission in what concerns SOx (as SO2).
Low temperature combustion processes, from domestic burning of coal, wood, dung and burning of forests and other land, have led to an increase in both NOx and ammonia (NH3) emissions. Together with the emissions of Nr from agricultural systems in the form of NH3, NOx, nitrous oxide (N2O), nitrates (NO3) and many organic nitrogen forms, this human alteration of the nitrogen cycle is causing multiple effects on global change (Sutton et al., 2012).
LITERATURE REVIEW 25
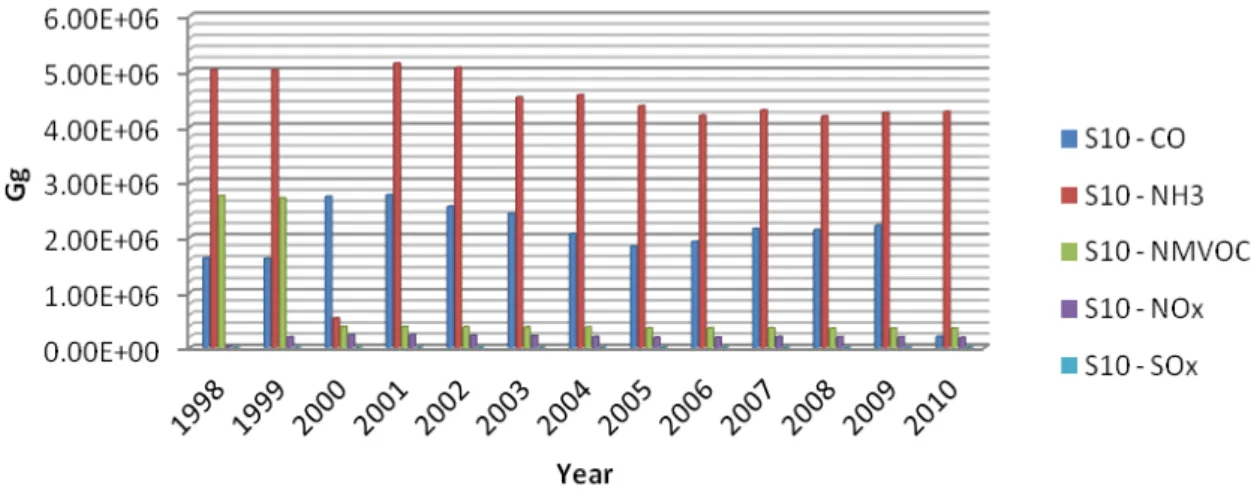
to 2007, from that year on the emission of the last 3 years (2008, 2009 and 2010) seem to increase in a smaller scale.
Figure 2.7 - National trends of pollutants from 1998-2010 in agriculture sector -S10 (Gg) (adapted from EMEP database in: http://www.ceip.at/webdab-emission-database).
Longe-range transport of aerosol particles was specifically added to the work programme in 1999. Some of the major challenges were to evaluate formation of secondary and organic particulate matter and particle dynamics among others (NILU, 2012).
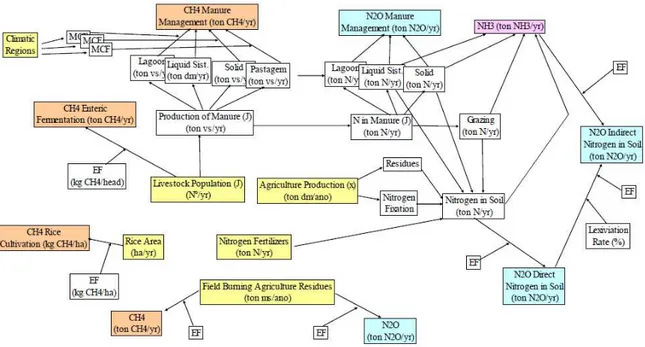
LITERATURE REVIEW 26 Figure 2.8 - Methodology for emissions estimations for report to the EMEP programme and the IPCC
(APA, 2012).
Ammonia volatilization due to mineral fertilizers (SN_NH3) is estimated based on:
SN_NH
3=N
Fert*Frac
GASF(2.4)
where,
N
fertis the total amount of nitrogen in synthetic fertilizers consumed (annual);Frac
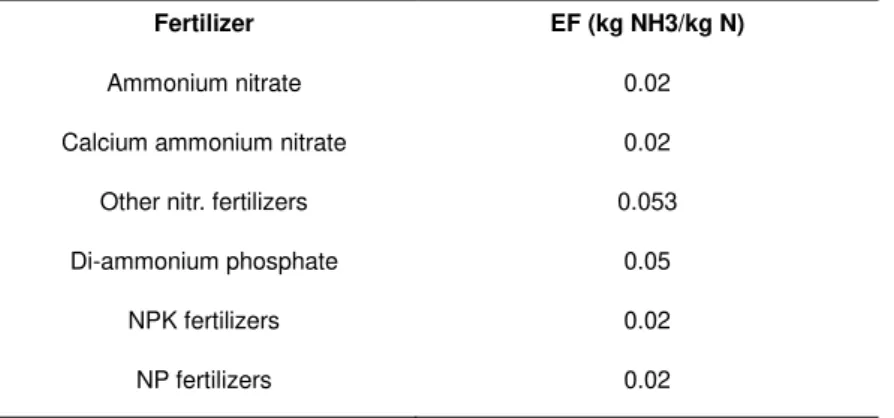
GASF is the fraction of nitrogen in fertilizers that volatilizes as NH3 or NOx.The NH3 volatilization emission factors considered by EMEP varies according to the fertilizer category (Table 2.5).
Table 2.5 - NH3 volatilizations emissions factors used by the Portuguese Environmental Agency
(APA, 2012) according to fertilizer category.
Fertilizer EF (kg NH3/kg N)
Nitrogen solution 0.08
Urea 0.15
Ammonium sulfate 0.08
LITERATURE REVIEW 27 Fertilizer EF (kg NH3/kg N)
Ammonium nitrate 0.02
Calcium ammonium nitrate 0.02 Other nitr. fertilizers 0.053
Di-ammonium phosphate 0.05
NPK fertilizers 0.02
NP fertilizers 0.02
Regarding ammonia emissions from manure, EMEP considers four stops in the life cycle of manure, which implies different emissions factors (APA, 2012):
(i) housing;
(ii) outside storage;
(iii) land spreading of manure collected in each manure management system;
(iv) ammonia volatilized from direct soil deposition of droppings during grazing.
Table 2.6 - NH3 volatilizations emissions on the main phases of manure of life cycle (APA, 2012).
Manure life cycle phase Emissions estimations
Housing Outside storage Manure management system
Grazing
The factors included into the expressions shown in Table 2.6, are subsequently defined, according to APA (2012).
Emissions from nature during housing and storage are estimated together, hence factors in the expression for estimation are:
- :number of individuals from livestock category I in the country;
- :annual country average N excretion per head of animal specie/categorie I;
- :fraction of nitrogen from livestock category I that is lost to the atmosphere as
ammonia during housing and manure storage;
- . fraction of Manure/Nitrogen from livestock category I that is managed in
LITERATURE REVIEW 28
Regarding Manure management systems, their ammonia emissions include: - : Number of individuals from livestock category I in the country;
- : annual country average N excretion per head of animal specie/category i; - : fraction of manure/nitrogen from livestock category that is managed in Manure
Management systems s, except grazing;
- : fraction of manure/nitrogen from livestock category I treated in Manure
Management system s that is used as fertilizer in agriculture soils;
- : fraction of nitrogen in manure management systems S from livestock category
I that is lots to atmosphere as ammonia during housing and manure storage;
- : fraction of nitrogen in mature that is lost to the atmosphere as ammonia after
application to soil fertilizer.
Finally, ammonia emission from grazing includes the knowledge of data on; - i : animal/species category of livestock;
- : number of individuals from livestock category I in the country;
- : annual country average N excretion per head of animal specie/category i;
- :fraction of manure/nitrogen from livestock category I that is managed in
pasture Range and Paddock;
- : fraction of nitrogen excreted from livestock category i during grazing that is lost
to the atmosphere as ammonia.
Table 2.7 summarizes the emissions factors used for NH3 emissions estimations during whole manure life cycle.
LITERATURE REVIEW 29 Table 2.7 - Emission factors used in the NH3 volatilizations from animal housing, land spreading and
grazing in pasture (kg N-NH3/kg N excreted).
Classe Housing & Outside Storage Land spreading of Manure Grazing in Pasture
Dairy cows 0.17 0.17 0.08
Other cattle 0.17 0.17 0.08
Sheep 0.10 0.07 0.04
Goats 0.10 0.07 0.04
Swine 0.22 0.16 0.08
Equines 0.12 0.07 0.08
Poutry 0.22 0.16
Hens 0.23 0.15
Rabbits 0.22 0.16
According to APA (2011), the total amount of NH3 emitted in 2009 was of 52 kt. At the national level, the higher contributors to this value are livestock and agriculture, 47.6 % and 37.2 %, respectively.
The relevance of the total treated above relies on the fact that emissions are considered into the chemistry transport models as input values, that need further treatment, in order to be used in any CTM calculation.
2.4.2.
T
HEC
HEMICAL TRANSPORT MODELCHIMERE
The purpose of this multi-scale chemistry-transport model, developed by Institut Pierre-Simon Laplace, is to produce daily forecasts of ozone, aerosols and other pollutants and make
long-term simulations for emission control scenarios. In what concerns spatial scale, it runs over a range of spatial scales from the regional scale (several thousand kilometers) to the urban scale (100-20 km), with resolutions from 1-2 km to 100 km. Most data are valid only for Europe and should be revisited for applications on other continents. This model proposes many different options for simulations which make it a powerful research tool for testing parameterizations and hypotheses (CHIMERE, 2012). Among others the input data required by CHIMERE can be divided in meteorology, boundary conditions, land-use and emissions.
LITERATURE REVIEW 30
Input data required
As a portable model it can run with different types of initial input data, among them the model consider meteorological data, boundary conditions, land-use information and emissions. The user of the model is responsible by the refinements of the input data in what concerns the following conditions:
Meteorology: Meteorological data is not provided on the server, but CHIMERE interfaces for the WRF and MM5 mesoscale models are proposed. WRF and MM5 (free software) can be used combined with AVN/NCEP (as forcing) public weather forecasts.
Boundary conditions: A set of boundary conditions from the MOZART and/or LMDz-INCA models is proposed as a default solution. Data are kindly provided by Max-Planck Institut, Hamburg, thanks to M. Schultz, G. Brasseur, C. Granier and D. Niehl, and IPSL/LSCE, thanks to Sophie Szopa and Didier Hauglustaine. This allows tropospheric simulations below 200 hPa. For aerosols, a set of boundary conditions based on GOCART global simulations (thanks to Mian Chin, NASA) is proposed in addition to the LMDz data.
Land-use: CHIMERE needs input landuse information for a number of processes. The proposed land use databases are GLCF3 and GlobCover4.