ISSN: 1524-4628
Copyright © 2004 American Heart Association. All rights reserved. Print ISSN: 0039-2499. Online
Stroke is published by the American Heart Association. 7272 Greenville Avenue, Dallas, TX 72514
DOI: 10.1161/01.STR.0000109226.67085.5A
2004;35;415-419; originally published online Jan 15, 2004;
Stroke
Lycklama and Frederik Barkhof
António J. Bastos Leite, Elisabeth C.W. van Straaten, Philip Scheltens, Geert
Inversion Recovery (FLAIR) Imaging
Thalamic Lesions in Vascular Dementia: Low Sensitivity of Fluid-Attenuated
http://stroke.ahajournals.org/cgi/content/full/35/2/415
located on the World Wide Web at:
The online version of this article, along with updated information and services, is
http://www.lww.com/reprints
Reprints: Information about reprints can be found online at
[email protected]
410-528-8550. E-mail:
Fax:
Kluwer Health, 351 West Camden Street, Baltimore, MD 21202-2436. Phone: 410-528-4050.
Permissions: Permissions & Rights Desk, Lippincott Williams & Wilkins, a division of Wolters
http://stroke.ahajournals.org/subscriptions/
Low Sensitivity of Fluid-Attenuated Inversion Recovery (FLAIR) Imaging
António J. Bastos Leite, MD; Elisabeth C.W. van Straaten, MD; Philip Scheltens, MD, PhD;
Geert Lycklama, MD, PhD; Frederik Barkhof, MD, PhD
Background and Purpose—The criteria of the National Institute of Neurological Disorders and Stroke (NINDS)–
Association Internationale pour la Recherche et l’Enseignement en Neurosciences (AIREN) include thalamic lesions for
the diagnosis of vascular dementia (VaD). Although studies concerning VaD and brain aging advocate the use of
fluid-attenuated inversion recovery (FLAIR) or T2-weighted images (T2-WI) to detect ischemic lesions, none compared
the sensitivity of these sequences to depict thalamic lesions.
Methods—We performed a blinded review of T2-WI and FLAIR images in 73 patients fulfilling the radiological part of
the NINDS-AIREN criteria (mean age, 71 years; range, 49 to 83 years). This sample was drawn from a large multicenter
trial on VaD and was expected to have a high prevalence of thalamic lesions. In a side-by-side review, including
T1-weighted images as well, lesions were classified according to presumed underlying pathology.
Results—The total number of thalamic lesions was 214. Two hundred eight (97%) were detected on T2-WI, but only 117
(55%) were detected on FLAIR (
2⫽5.1; P⬍0.05). Although the mean size of lesions detected on T2-WI and not on
FLAIR (4.4 mm) was significantly lower than the mean size of lesions detected on both sequences (6.7 mm) (P
⬍0.001),
5 of the 29 lesions
⬎10 mm on T2-WI were not visible on FLAIR. FLAIR detected only 81 (51%) of the 158 probable
ischemic lesions and 30 (60%) of the 50 probable microbleeds.
Conclusions—FLAIR should not be used as the only T2-weighted sequence to detect thalamic lesions in patients suspected
of having VaD. (Stroke. 2004;35:415-419.)
Key Words: dementia, vascular
䡲 magnetic resonance imaging 䡲 thalamus
I
n 1937, Papez
1described an anatomic circuit beginning
and ending in the hippocampal formation possibly related
to emotional experience. The projections of the Papez circuit
involve the fornix, mammillary bodies, mamillothalamic
tracts, anterior thalami, cingulate cortex, and cingulate
bun-dles. The early notion that the Papez circuit subserves
emotion has been abandoned and replaced by the proposal it
is primarily involved in mnemonic functions. Lesions of the
major components of this circuit have been shown to disrupt
memory in humans, particularly those localized in the
ante-rior group of thalamic nuclei.
2– 6However, lesions affecting
other thalamic components or connections not considered in
the circuit, such as the mediodorsal (dorsomedial),
intralami-nar, and pulvinar nuclei or the thalamofrontal networks, may
also cause cognitive deficits and marked behavioral
changes.
2,7–11MRI and CT are crucial for the diagnosis of
cerebrovas-cular diseases. The first studies using CT for the evaluation of
brain lesions in patients with ischemic stroke confirmed the
importance of thalamic infarctions as a cause of dementia.
12,13Therefore, the criteria of the National Institute of
Neurolog-ical Disorders and Stroke (NINDS)–Association
Internation-ale pour la Recherche et l’ Enseignement en Neurosciences
(AIREN) include radiological evidence of thalamic lesions
for the diagnosis of probable vascular dementia (VaD).
14Moreover, a single thalamic infarction may induce VaD.
15MRI studies concerning VaD and brain aging advocate the
use of fluid-attenuated inversion recovery (FLAIR) or
T2-weighted images (T2-WI) to detect and characterize brain
abnormalities.
16 –18However, to our knowledge no
compara-tive study was performed to assess which MRI sequence
yields the highest sensitivity for thalamic lesions. In this
study we sought to compare the sensitivity of each of these
sequences to depict thalamic lesions in patients with VaD.
Subjects and Methods
Patients
The subjects were derived from cases belonging to the VantagE study, a multicenter, phase III, prospective, randomized, double-blind clinical trial on the effects of rivastigmine in patients with
Received August 15, 2003; final revision received September 22, 2003; accepted October 1, 2003.
From the Department of Radiology (A.J.B.L., G.L., F.B.), Department of Neurology (E.C.W. van S., P.S.), Image Analysis Center (E.C.W. van S., F.B.), and Alzheimer Center (P.S.), Vrije Universiteit Medical Center, Amsterdam, Netherlands; and Department of Neuroradiology, Hospital Geral de Santo António, Oporto, Portugal (A.J.B.L.).
Correspondence to Dr Frederik Barkhof, Department of Radiology, VU Medical Center, PO Box 7057, 1007 MB Amsterdam, Netherlands. E-mail [email protected]
© 2004 American Heart Association, Inc.
Stroke is available at http://www.strokeaha.org DOI: 10.1161/01.STR.0000109226.67085.5A
VaD. For the present study we selected a sample of 73 patients (mean age, 71 years; range, 49 to 83 years) fulfilling the radiological part of the NINDS-AIREN criteria.14On the basis of earlier central
reading of the images for trial inclusion, we knew that approximately 75% of the current sample might be expected to have either unilateral or bilateral focal thalamic lesions. To avoid any clinical bias, we were blinded to all clinical and center data of the patients.
MRI Technique
The patients were scanned on different scanners operating from 0.5 to 1.5 T. Axial T2 spin-echo weighted images (echo time [TE] 80 to 120 ms, repetition time [TR] 3000 to 4000 ms, slice thickness 5 mm); axial FLAIR (TE 110 to 150 ms, TR 9000 to 10000 ms, inversion time 2000 to 2200 ms, slice thickness 5 mm); and axial, sagittal, and coronal T1 spin-echo weighted images (TE 11 to 20 ms, TR 500 to 700 ms, slice thickness 5 mm) were acquired. To maintain blinding, we were restricted from access to information about the type of the scanner used for each particular patient as well as the location of the imaging center.
Image Assessment
The initial assessment was performed in a blinded way, in which the T2-WI and FLAIR images were evaluated in pseudorandom order, with the use of 16-bit digital imaging files. All lesions were marked and numbered with digital overlays. We included only focal thalamic abnormalities⬎1 mm and excluded those suggestive of perivascular spaces. Perivascular spaces were defined as sharply demarcated areas with a signal isointensity relative to cerebrospinal fluid (CSF), following the course of a perforating vessel on sagittal or coronal images.19Care was also taken to avoid the inclusion of pulsation
artifacts, recognizable by linear patterns of signal banding due to phase misregistration.
For further subtyping and analysis, T2-WI, FLAIR, and T1-weighted images (T1-WI) were evaluated side by side. The greatest dimension of each focal abnormality was measured, and all were classified on each of the 3 imaging sequences in the following categories: hyperintense, hypointense, predominantly hypointense (hypointense with a small hyperintense component), and hypointense with a peripheral rim of hyperintensity.
Statistical Evaluation
Statistical analysis was performed with the use of SPSS 11.0. We used2statistics to compare categorical data, such as proportions of
lesions detected by each sequence. For comparisons of continuous variables, Student’s t test was applied because the data were normally distributed.
Results
The total number of focal thalamic lesions detected was 214.
One hundred twenty-four (58%) of the 214 measured
⬍5 mm, 61 (29%) between 5 and 10 mm, and 29 (14%)
⬎10 mm. One hundred nine (51%) were localized in the right
thalamus and 105 (49%) on the left.
Two hundred eight (97%) of the 214 lesions were
identi-fied on T2-WI, but only 117 (55%) were detected on FLAIR
(
2⫽5.1; P⬍0.05). Almost half (47%) of the lesions found on
T2-WI were not detected on FLAIR (Table 1). Although the
mean size of lesions detected on T2-WI and not on FLAIR
(4.4 mm) was significantly lower than the mean size of
lesions detected on both sequences (6.7 mm) (P
⬍0.001), 5 of
the 29 lesions
⬎10 mm on T2-WI were not visible on FLAIR
(Table 2) (Figure).
One hundred eight (50%) of the lesions were hyperintense
on T2-WI and hypointense on T1-WI and probably
corre-spond to infarctions. Fifty lesions (23%) were hyperintense
on T2-WI and isointense on T1-WI and may correspond to
areas of myelin pallor. Fifty lesions (23%) were hypointense
on T2-WI and T1-WI and probably represent microbleeds
(hemorrhagic lacunae).
FLAIR detected 61 (56%) of the 108 probable infarctions,
30 (60%) of the 50 probable microbleeds, and 20 (40%) of the
50 probable areas of myelin pallor. Thirty-two of the probable
infarctions were hyperintense on FLAIR (incomplete or
noncystic infarctions), and 29 were totally or partially
hy-pointense (cystic and partially cystic infarctions).
The vast majority (79%) of the 97 lesions not detected on
FLAIR were hyperintense on T2-WI (Table 3).
Discussion
Our study shows that FLAIR imaging is not very sensitive in
detecting focal thalamic lesions and is therefore not well
suited as a stand-alone sequence in the evaluation of patients
suspected of VaD.
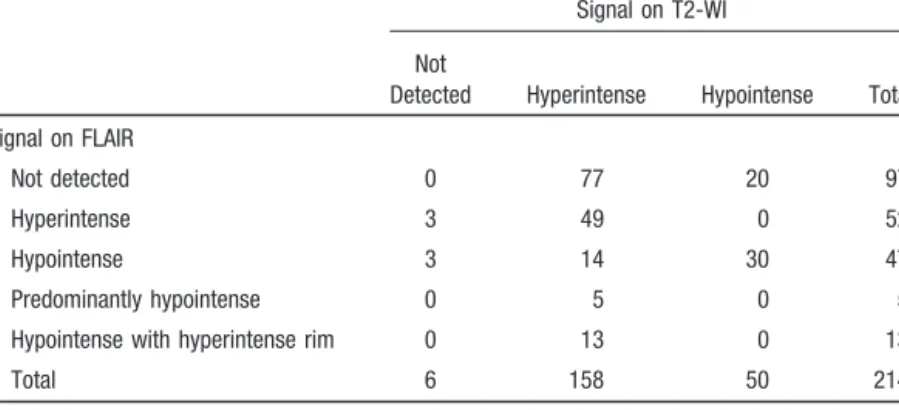
TABLE 1.
Lesions on T2-WI and FLAIR
Signal on T2-WI Not
Detected Hyperintense Hypointense Total Signal on FLAIR
Not detected 0 77 20 97
Hyperintense 3 49 0 52
Hypointense 3 14 30 47
Predominantly hypointense 0 5 0 5
Hypointense with hyperintense rim 0 13 0 13
Total 6 158 50 214
TABLE 2.
Detection on FLAIR and Distribution by Size of Focal
Lesions on T2-WI
Detection on FLAIR Not Detected Detected Total Size on T2-WI
1–5 mm 66 53 119
5–10 mm 26 34 60
⬎10 mm 5 24 29
FLAIR sequences employ a long inversion time that
suppresses the signal from CSF and a long TE that provides
heavy T2 weighting. Therefore, the major interest of FLAIR
is to detect and characterize brain lesions around CSF
spaces.
20,21Most studies advocate superiority of FLAIR over
conventional spin-echo imaging in a wide range of
patholo-gies.
22–32FLAIR images also have the advantage of easily
identifying CSF-like lesions.
33Some studies showed that FLAIR was more often
associ-ated with image artifacts
22,34or could not corroborate the
aforementioned superiority of FLAIR.
34,35Disadvantages of
FLAIR include a reduced sensitivity to detect infratentorial or
spinal cord lesions.
34,36 –38The reason for this is unknown but
most likely reflects different relaxation characteristics in
those regions, both in normal-appearing tissue and in lesions.
For example, T1 and T2 relaxation times of infratentorial
lesions in patients with multiple sclerosis are closer to the
relaxation times of local normal-appearing white matter than
those of supratentorial lesions, resulting in reduced contrast
between posterior fossa lesions and the background.
39Age-related increases in T1 relaxation times of human brain also
have been shown, particularly in the thalami,
40and may serve
to explain the lack of sensitivity of FLAIR for thalamic
lesions in elderly patients with VaD.
Alternatively, the occurrence of cystic changes in lacunar
infarctions
41will lead to a prolongation of T1 relaxation time,
and the signal from these lesions may be suppressed, as in
CSF spaces. The same may occur with multiple sclerosis
lesions severely hypointense on T1-WI.
42MRI-pathological
correlation studies performed to determine the background of
age-related subcortical gray and white matter hyperintensities
on T2-WI found different types of pathology: infarctions,
gliosis, myelin and axonal loss, breakdown of the ependymal
lining, and enlarged perivascular spaces.
17,43– 47Areas of
myelin pallor can be hyperintense on T2-WI but isointense on
T1-WI,
17,45and it seems possible that differences in type of
pathology can also influence detection on FLAIR.
Although the proposed neuropathological classification of
lacunae includes both ischemic (type I) and hemorrhagic
(type II) vascular abnormalities and enlarged perivascular
spaces (type III),
41in VaD it is important to differentiate the
vascular lesions. MRI-pathological correlation studies found
that the great majority of enlarged perivascular
(Virchow-Robin) spaces normally surround perforating arteries that
enter the striatum in the anterior perforated substance, just
above the internal carotid artery bifurcation and lateral to the
anterior commissure. They are responsible for the so-called
état criblé of the basal ganglia
19,48 –52and are much less
frequently located in the thalami.
52Therefore, it is unlikely
that those lesions classified as cystic infarctions on the basis
of MRI are in fact Virchow-Robin spaces or could account for
the greater number of lesions detected on T2-WI. Actually,
FLAIR performed more poorly for all types of presumed
pathology.
A limitation of our study is that we used images acquired
on a wide range of scanners and sequences, not all of which
a, c, and e, T2-weighted images showing a left tuberothalamic artery infarction and 2 right-sided paramedian thalamic infarc-tions in 3 different patients (aged 68, 52, and 79 years). b, d, and f, Correspondent fluid-attenuated inversion recovery images do not reveal thalamic abnormalities.
TABLE 3.
Detection on FLAIR and Signal on T2 and T1-WI
Detected on FLAIR Not Detected on FLAIR Hyperintense on T2-WI Hypointense on T2-WI Hyperintense on T2-WI Hypointense on T2-WI Isointense on T1-WI 20 10 30 13 2⫽0.079 P⫽0.779 Hypointense on T1-WI 61 20 47 7 2⫽2.785 P⫽0.095 Total 81 30 77 20 2⫽1.164 P⫽0.281
may be optimally tuned. On the other hand, this reflects the
normal variability of vendor-supported sequences, and given
the more complex contrast mechanisms in FLAIR, these may
be less stable than for T2-WI. For the detection of type II
hemorrhagic lacunae,
53,54both spin-echo and FLAIR are
insensitive compared with T2*-WI gradient-echo
sequenc-es,
55,56but these were not available in the context of this trial.
Nevertheless, we detected a fair amount of probable
microbleeds.
In conclusion, the accuracy of T2-WI for the detection of
thalamic lesions in patients with probable VaD is far superior
to FLAIR. Given the great clinical importance of these
lesions, FLAIR should not be used as the only T2-weighted
sequence in patients suspected of having VaD.
In addition to the posterior fossa and spinal cord, the
diencephalon seems to represent another region not suitable
for evaluation by FLAIR MRI.
References
1. Papez JW. A proposed mechanism of emotion. Arch Neurol Psychiatry. 1937;38:725–734.
2. Bogousslavsky J, Regli F, Uske A. Thalamic infarcts: clinical syndromes, etiology, and prognosis. Neurology. 1988;38:837– 848.
3. Gaffan EA, Gaffan D, Hodges JR. Amnesia following damage to the left fornix and to other sites: a comparative study. Brain. 1991;114: 1297–1313.
4. Clarke S, Assal G, Bogousslavsky J, Regli F, Townsend DW, Leenders KL, Blecic S. Pure amnesia after unilateral left polar thalamic infarct: topographic and sequential neuropsychological and metabolic (PET) cor-relations. J Neurol Neurosurg Psychiatry. 1994;57:27–34.
5. Saito K, Kimura K, Minematsu K, Shiraishi A, Nakajima M. Transient global amnesia associated with an acute infarction in the retrosplenium of the corpus callosum. J Neurol Sci. 2003;210:95–97.
6. Schott JM, Crutch SJ, Fox NC, Warrington EK. Development of selective verbal memory impairment secondary to a left thalamic infarct: a longi-tudinal case study. J Neurol Neurosurg Psychiatry. 2003;74:255–257. 7. Guard O, Bellis F, Mabille JP, Dumas R, Boisson D, Devic M. Thalamic
dementia after a unilateral hemorrhagic lesion of the right pulvinar. Rev Neurol (Paris). 1986;142:759 –765.
8. Bogousslavsky J, Regli F, Delaloye B, Delaloye-Bischof A, Assal G, Uske A. Loss of psychic self-activation with bithalamic infarction: neu-robehavioural, CT, MRI and SPECT correlates. Acta Neurol Scand. 1991;83:309 –316.
9. Sandson TA, Daffner KR, Carvalho PA, Mesulam MM. Frontal lobe dysfunction following infarction of the left-sided medial thalamus. Arch Neurol. 1991;48:1300 –1303.
10. Tatemichi TK, Desmond DW, Prohovnik I, Cross DT, Gropen TI, Mohr JP, Stern Y. Confusion and memory loss from capsular genu infarction: a thalamocortical disconnection syndrome? Neurology. 1992;42: 1966 –1979.
11. Van der Werf YD, Weerts JG, Jolles J, Witter MP, Lindeboom J, Scheltens P. Neuropsychological correlates of a right unilateral lacunar thalamic infarction. J Neurol Neurosurg Psychiatry. 1999;66:36 – 42. 12. Ladurner G, Lliff LD, Sager WD, Lechner H. A clinical approach to
vascular (multiinfarct) dementia. Exp Brain Res. 1982;suppl 5:243–250. 13. Ladurner G, Sager WD, Flooh E. Computer tomography and vascular (multiinfarct) dementia: a qualitative and quantitative investigation. Exp Brain Res. 1982;suppl 5:264 –271.
14. Roman GC, Tatemichi TK, Erkinjuntti T, Cummings JL, Masdeu JC, Garcia JH, Amaducci L, Orgogozo JM, Brun A, Hofman A, et al. Vascular dementia: diagnostic criteria for research studies: report of the NINDS-AIREN International Workshop. Neurology. 1993;43:250 –260. 15. Leys D, Scheltens P, Vermersch P, Pruvo JP. Morphological imaging in
the diagnosis of dementia, II: vascular dementia. Rev Med Interne. 1995; 16:195–200.
16. O’Brien JT, Wiseman R, Burton EJ, Barber B, Wesnes K, Saxby B, Ford GA. Cognitive associations of subcortical white matter lesions in older people. Ann N Y Acad Sci. 2002;977:436 – 444.
17. Udaka F, Sawada H, Kameyama M. White matter lesions and dementia: MRI-pathological correlation. Ann N Y Acad Sci. 2002;977:411– 415.
18. Schmidt R, Enzinger C, Ropele S, Schmidt H, Fazekas F. Progression of cerebral white matter lesions: 6-year results of the Austrian Stroke Pre-vention Study. Lancet. 2003;361:2046 –2048.
19. Jungreis CA, Kanal E, Hirsch WL, Martinez AJ, Moossy J. Normal perivascular spaces mimicking lacunar infarction: MR imaging. Radiology. 1988;169:101–104.
20. De Coene B, Hajnal JV, Gatehouse P, Longmore DB, White SJ, Oatridge A, Pennock JM, Young IR, Bydder GM. MR of the brain using fluid-attenuated inversion recovery (FLAIR) pulse sequences. AJNR Am J Neuroradiol. 1992;13:1555–1564.
21. Hajnal JV, Bryant DJ, Kasuboski L, Pattany PM, De Coene B, Lewis PD, Pennock JM, Oatridge A, Young IR, Bydder GM. Use of fluid attenuated inversion recovery (FLAIR) pulse sequences in MRI of the brain. J Comput Assist Tomogr. 1992;16:841– 844.
22. Rydberg JN, Hammond CA, Grimm RC, Erickson BJ, Jack CR Jr, Huston J, Riederer SJ. Initial clinical experience in MR imaging of the brain with a fast fluid-attenuated inversion-recovery pulse sequence. Radiology. 1994;193:173–180.
23. Hashemi RH, Bradley WG Jr, Chen DY, Jordan JE, Queralt JA, Cheng AE, Henrie JN. Suspected multiple sclerosis: MR imaging with a thin-section fast FLAIR pulse sequence. Radiology. 1995;196:505–510. 24. Alexander JA, Sheppard S, Davis PC, Salverda P. Adult cerebrovascular
disease: role of modified rapid fluid-attenuated inversion-recovery sequences. AJNR Am J Neuroradiol. 1996;17:1507–1513.
25. Filippi M, Yousry T, Baratti C, Horsfield MA, Mammi S, Becker C, Voltz R, Spuler S, Campi A, Reiser MF, Comi G. Quantitative assessment of MRI lesion load in multiple sclerosis: a comparison of conventional spin-echo with fast fluid-attenuated inversion recovery. Brain. 1996;119: 1349 –1355.
26. Thurnher MM, Thurnher SA, Fleischmann D, Steuer A, Rieger A, Helbich T, Trattnig S, Schindler E, Hittmair K. Comparison of T2-weighted and fluid-attenuated inversion-recovery fast spin-echo MR sequences in intracerebral AIDS-associated disease. AJNR Am J Neuro-radiol. 1997;18:1601–1609.
27. Aprile I, Iaiza F, Lavaroni A, Budai R, Dolso P, Scott CA, Beltrami CA, Fabris G. Analysis of cystic intracranial lesions performed with fluid-attenuated inversion recovery MR imaging. AJNR Am J Neuroradiol. 1999;20:1259 –1267.
28. Arakia Y, Ashikaga R, Fujii K, Nishimura Y, Ueda J, Fujita N. MR fluid-attenuated inversion recovery imaging as routine brain T2-weighted imaging. Eur J Radiol. 1999;32:136 –143.
29. Jager HR, Albrecht T, Curati-Alasonatti WL, Williams EJ, Haskard DO. MRI in neuro-Behcet’s syndrome: comparison of conventional spin-echo and FLAIR pulse sequences. Neuroradiology. 1999;41:750 –758. 30. Bynevelt M, Britton J, Seymour H, MacSweeney E, Thomas N, Sandhu
K. FLAIR imaging in the follow-up of low-grade gliomas: time to dispense with the dual-echo? Neuroradiology. 2001;43:129 –133. 31. Essig M, Metzner R, Bonsanto M, Hawighorst H, Debus J, Tronnier V,
Knopp MV, van Kaick G. Postoperative fluid-attenuated inversion recovery MR imaging of cerebral gliomas: initial results. Eur Radiol. 2001;11:2004 –2010.
32. Herskovits EH, Itoh R, Melhem ER. Accuracy for detection of simulated lesions: comparison of fluid-attenuated inversion-recovery, proton density-weighted, and T2-weighted synthetic brain MR imaging. AJR Am J Roentgenol. 2001;176:1313–1318.
33. Barkhof F, Scheltens P. Imaging of white matter lesions. Cerebrovasc Dis. 2002;13:21–30.
34. Okuda T, Korogi Y, Shigematsu Y, Sugahara T, Hirai T, Ikushima I, Liang L, Takahashi M. Brain lesions: when should fluid-attenuated inversion-recovery sequences be used in MR evaluation? Radiology. 1999;212:793–798.
35. Baratti C, Barkhof F, Hoogenraad F, Valk J. Partially saturated fluid attenuated inversion recovery (FLAIR) sequences in multiple sclerosis: comparison with fully relaxed FLAIR and conventional spin-echo. Magn Reson Imaging. 1995;13:513–521.
36. Keiper MD, Grossman RI, Brunson JC, Schnall MD. The low sensitivity of fluid-attenuated inversion-recovery MR in the detection of multiple sclerosis of the spinal cord. AJNR Am J Neuroradiol. 1997;18: 1035–1039.
37. Stevenson VL, Gawne-Cain ML, Barker GJ, Thompson AJ, Miller DH. Imaging of the spinal cord and brain in multiple sclerosis: a comparative study between fast FLAIR and fast spin echo. J Neurol. 1997;244: 119 –124.
38. Tubridy N, Barker GJ, MacManus DG, Moseley IF, Miller DH. Optimi-sation of unenhanced MRI for detection of lesions in multiple sclerosis:
418
Stroke
February 2004
a comparison of five pulse sequences with variable slice thickness. Neu-roradiology. 1998;40:293–297.
39. Stevenson VL, Parker GJ, Barker GJ, Birnie K, Tofts PS, Miller DH, Thompson AJ. Variations in T1 and T2 relaxation times of normal appearing white matter and lesions in multiple sclerosis. J Neurol Sci. 2000;178:81– 87.
40. Steen RG, Gronemeyer SA, Taylor JS. Age-related changes in proton T1 values of normal human brain. J Magn Reson Imaging. 1995;5:43– 48. 41. Poirier J, Derouesne C. Cerebral lacunae: a proposed new classification.
Clin Neuropathol. 1984;3:266.
42. van Waesberghe JH, Castelijns JA, Weerts JG, Nijeholt GJ, Hillegers JP, Polman CH, Barkhof F. Disappearance of multiple sclerosis lesions with severely prolonged T1 on images obtained by a FLAIR pulse sequence. Magn Reson Imaging. 1996;14:209 –213.
43. Awad IA, Johnson PC, Spetzler RF, Hodak JA. Incidental subcortical lesions identified on magnetic resonance imaging in the elderly, II: postmortem pathological correlations. Stroke. 1986;17:1090 –1097. 44. Braffman BH, Zimmerman RA, Trojanowski JQ, Gonatas NK, Hickey
WF, Schlaepfer WW. Brain MR: pathologic correlation with gross and histopathology, II: hyperintense white-matter foci in the elderly. AJR Am J Roentgenol. 1988;151:559 –566.
45. Fazekas F, Kleinert R, Offenbacher H, Payer F, Schmidt R, Kleinert G, Radner H, Lechner H. The morphologic correlate of incidental punctate white matter hyperintensities on MR images. AJNR Am J Neuroradiol. 1991;12:915–921.
46. Chimowitz MI, Estes ML, Furlan AJ, Awad IA. Further observations on the pathology of subcortical lesions identified on magnetic resonance imaging. Arch Neurol. 1992;49:747–752.
47. Scheltens P, Barkhof F, Leys D, Wolters EC, Ravid R, Kamphorst W. Histopathologic correlates of white matter changes on MRI in Alzhei-mer’s disease and normal aging. Neurology. 1995;45:883– 888.
48. Braffman BH, Zimmerman RA, Trojanowski JQ, Gonatas NK, Hickey WF, Schlaepfer WW. Brain MR: pathologic correlation with gross and histopathology, I: lacunar infarction and Virchow-Robin spaces. AJR Am J Roentgenol. 1988;151:551–558.
49. Pullicino PM, Miller LL, Alexandrov AV, Ostrow PT. Infraputaminal ‘lacunes’: clinical and pathological correlations. Stroke. 1995;26: 1598 –1602.
50. Adachi M, Hosoya T, Haku T, Yamaguchi K. Dilated Virchow-Robin spaces: MRI pathological study. Neuroradiology. 1998;40:27–31. 51. Bokura H, Kobayashi S, Yamaguchi S. Distinguishing silent lacunar
infarction from enlarged Virchow-Robin spaces: a magnetic resonance imaging and pathological study. J Neurol. 1998;245:116 –122. 52. Takao M, Koto A, Tanahashi N, Fukuuchi Y, Takagi M, Morinaga S.
Pathologic findings of silent, small hyperintense foci in the basal ganglia and thalamus on MRI. Neurology. 1999;52:666 – 668.
53. Challa VR, Moody DM. The value of magnetic resonance imaging in the detection of type II hemorrhagic lacunes. Stroke. 1989;20:822– 825. 54. Fazekas F, Kleinert R, Roob G, Kleinert G, Kapeller P, Schmidt R,
Hartung HP. Histopathologic analysis of foci of signal loss on gradient-echo T2*-weighted MR images in patients with spontaneous intracerebral hemorrhage: evidence of microangiopathy-related microbleeds. AJNR Am J Neuroradiol. 1999;20:637– 642.
55. Kim DE, Bae HJ, Lee SH, Kim H, Yoon BW, Roh JK. Gradient echo magnetic resonance imaging in the prediction of hemorrhagic vs ischemic stroke: a need for the consideration of the extent of leukoariosis. Arch Neurol. 2002;59:425– 429.
56. Ripoll MA, Siosteen B, Hartman M, Raininko R. MR detectability and appearance of small experimental intracranial hematomas at 1.5 T and 0.5 T. Acta Radiol. 2003;44:199 –205.