Characterisation of Ti/Al multilayered structures with slow positron
beams applying a simplified positron depth distribution model
M. Duarte Naia
1, a, P.M. Gordo
2,b, O.M.N.D. Teodoro
3,c,
A.P. de Lima
2,dand A.M.C. Moutinho
3,e1Dep. Física, Universidade de Trás-os-Montes e Alto Douro, 5001-911 Vila Real, Portugal 2CMUC®, Dep. Física FCTUC, Universidade de Coimbra, 3004-516 Coimbra, Portugal 3CEFITEC, Dep. Física FCT, Universidade Nova de Lisboa, 2829-516 Caparica, Portugal
a[email protected], b[email protected], codt@fct,unl.pt, d[email protected], e[email protected]
Keywords: multilayer, thin films, interfaces, slow positron, SIMS.
Abstract. In this work the depth of interfaces in multilayered structures was estimated. The
fractions of positron annihilation as function of the implantation energy were estimated from an
S-W plot and then converted into a function of the sample depth through the positron implantation
profile in the multilayer system computed from a reduced positron profile. The results of this method in Ti/Al samples are comparable to those using the common analysis based on positron diffusion equations. The positron analyses results were compared with SIMS profiles for the same samples.
Introduction
The technologies to produce new materials and devices are nowadays greatly based in thin film and multilayer techniques. This trend demands better and better analyses methods to characterise and control profiles and interfaces. There are a considerable number of approaches to this issue, but all of them present advantages and drawbacks. For elemental depth profiling analysis the much-used techniques are based in the surface ion erosion with analysis by the Secondary Ions Mass Spectrometry (SIMS) and the Electron Auger Spectroscopy (AES) and do not give structural information.
The advent of the slow positron beams with variable energy enabled the use of positrons to probe near surface regions of solids and has offered a powerful and non-destructive technique for materials science characterisation, especially sensitive to free volume defects [1]. The most widespread method, here designated as Slow Positron Implantation Spectroscopy (SPIS), consists of the implantation, at a controlled depth, z, in the solid, of monoenergetic positrons which annihilate with local electrons after diffusing in the material and, eventually, being captured by a defect. The emitted gamma photons can reveal the momentum distribution of the electrons that broaden the annihilation peak due to Doppler effect. For data analysis, the shape of the annihilation peak is characterized by two parameters: the sharpness S (ratio of a central area to the total area) and the wings W (ratio of the area under the wings to the total area). The evolution of these parameters as function of the positron energy E (or the mean implantation depth <z>) enables the adjustment of a structural model of the sample used to solve the positron diffusion equation. The SPIS has proved to be a very good method for defect depth profiling in ion implantation experiments with elemental or homogeneous samples, e.g. in semiconductors [2], albeit the potentialities demonstrated that the generalisation of this analysis technique to non-homogeneous samples depends on the knowledge of the positron implantation profile. Moreover, the fitting procedure usually produces more than one solution with comparable quality accuracy.
In the literature there are some Monte Carlo calculations of the positron implantation profile
P(E, z) for multilayered structures [3], but the algorithms are too demanding for routine analysis.
some scaling properties that enable to compute a reduced profile P(z/<z>) [4]. The reduced profile is independent of the positron implantation energy and has a weak dependence on the atomic number of the material. A reflection effect on the interfaces due to different densities of the layers can also be included [5]. Once the reduced profile is parameterised for all the elements present in the sample, the implantation profile P(E, z) can be reconstructed to compute the mean implantation depth, which is actually the depth probed by the positrons.
The studies presented in this work were carried out on films of Ti and Al. The multilayered system Ti/Al is known to be very stable at the ambient temperature; therefore, they form very sharp interfaces without layer interdiffusion. In fact, this system is used to produce conductive certified reference coatings [6].
Experimental
The films of Ti and Al were deposited by DC magnetron sputtering on a rapid steel M2 substrate. Before deposition, the M2 disks (of 10 mm diameter) were mechanically polished and annealed, during one hour, in a vacuum better than 10-4 Pa. The nominal layer thickness of each film - measured with stylus profilometry - was determined by extrapolation from control samples. The characteristics of the samples – including the thickness values – are listed in Table 1.
Table 1 – Characteristics of samples analysed in this work.
Sample Nominal characteristics Observations
M2 M2 substrate (reference)
Al(50)/M2 Al 50 nm / M2 aluminium film Ti(50)/M2 Ti 50 nm / M2 titanium
Ti(150)/Al(800)/M2 Ti 150 nm / Al 800 nm / M2 titanium/aluminium film Ti(50)/Al(800)/M2 Ti 50 nm / Al 800 nm / M2 titanium/aluminium film
The positron studies were carried out in Coimbra with a variable energy slow positron beam system [7]. The positron beam was operated with energies ranging from 100 eV to 30 keV that enabled to probe the upper 1000 nm of the above samples. The positron implantation profile was reconstructed with the method described by Aers et al. [5], using the nominal values of the film thickness from Tab. 1. The SPIS data were analysed with the usual method based on the positron diffusion inside the material with the code VEPFIT [8] and also trough the alternative method explained ahead.
The same Al and Ti layered samples were analysed by X-ray Photoelectron Spectroscopy (XPS) and the depth composition measured with SIMS in a multitechnique apparatus at Lisbon and described elsewhere [9].
Comparison of depth profile analyses)
Using the S versus W plot representation in the positron data analysis the agglomeration of the measured points identifies the annihilations centres. Therefore annihilations events occurring in the substrate, at the surface or in each layer, including eventual defects can be identified. As an illustrative example, the Fig. 1 shows the S-W plot of the sample Ti(50)/Al(800)/M2. In the figure, it can be clearly observed that as the positron beam energy is increased the predominant annihilation sites are changing from surface states, to the titanium layer and then to the aluminium and finally reach the steel M2. When the beam energy is such that positrons annihilate in two
different states, the corresponding point lies on a straight line joining (Si, Wi) clusters characteristic
of each annihilation centre.
0.44 0.46 0.48 0.50 0.52 0.04 0.05 0.06 0.07 0.08 0.09 0.10 Titanium Aluminium Surface M2 W Pa ra me te r S Parameter
Fig. 1 - The S-W plot for the sample Ti(50)/Al(800)/M2 with the identification of the different annihilation centres.
The energy linearity of the annihilation parameters, i.e., i
i i S E f E S( )=
∑
( ) and i i i E W f EW( )=
∑
( ) , are used to determine the fractions of positron annihilation fi(E), whose sumis, obviously, normalised to unity. If the annihilation centres are correctly identified, this approach enable the calculation of a profile as function of the implantation energy by splitting the S-W plot in a number of intervals each one involving just three cluster sites. The conversion of the profile into a function of sample depth depends on the ability to reconstruct the positron implantation profile P(E,
z). 10 100 1000 0.0 0.2 0.4 0.6 0.8 1.0 1.2 Ti(50)/Al(800)/M2 An ni hi la tio n fra ct io n Depth [nm] Surface Titanium Aluminium M2
Fig. 2 – Fractions of positron annihilation due to surface states, Ti, Al and M2 for the sample Ti(50)/Al (800)/M2, as function of depth.
Fig. 2 shows an example of this analysis using the code SWAN [10]. The depth of each interface was established at half of maximum height of the annihilation fraction and their uncertainties by a statistics over several runs with different program parameters. It is important to stress the inclusion
of the surface state in the analysis, which was confirmed by XPS measurements to be attributed to oxides and carbon contamination.
To verify this depth analysis ion erosion was performed with a 4 keV Ar+ beam with a spot diameter of 400 µm on the sample followed by positive SIMS measurements. An atmosphere of oxygen (5×10⁻⁵ Pa) was used in order to follow Al+, Ti+ and Fe+, since the presence of oxygen enhances the positive ions signal intensity [11]. The secondary ion signal was taken just in the central part of crater produced by the ion beam to avoid border effects. In Fig. 3 we show an example of the measured profile and of the estimated erosion rate.
0 50 100 150 200 250 300 101 102 103 104 105 0 200 400 600 800 1000 1200 Ti(50)/Al(800)/M2 C ou nts
Erosion time [min]
Al+ Ti+ Fe+ Al M2 Ti D ep th [n m ] Estimated rate Mean rate
Fig. 3 - Profile (a) and estimated erosion rate (b) obtained for the sample Ti(50)/Al(800)/M2. The erosion rate was calculated using the crater depth measured with a stylus profilometer, assuming that the erosion rate was constant in each layer and proportional to the sputtering yield of the principal constituent element. The validity of these assumptions was confirmed by the consistency of the results obtained in the same samples with profiles with different rastered areas; only in shallow profiles - where the surface state becomes important- were some discrepancies observed.
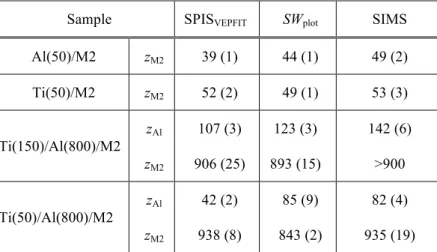
Table 2 - Depth of the interfaces (in nm) as determined by the different analyses performed.
Sample SPISVEPFIT SWplot SIMS
Al(50)/M2 zM2 39 (1) 44 (1) 49 (2) Ti(50)/M2 zM2 52 (2) 49 (1) 53 (3) Ti(150)/Al(800)/M2 zAl zM2 107 (3) 906 (25) 123 (3) 893 (15) 142 (6) >900 Ti(50)/Al(800)/M2 zAl zM2 42 (2) 938 (8) 85 (9) 843 (2) 82 (4) 935 (19) The estimated uncertainties are indicated in parentheses
(a)
All the results for the layer thicknesses are summarised in Table 2. It includes the conventional SPIS analysis with VEPFIT, the SWplot analysis and the depth profiles obtained with SIMS.
The consistency of the results obtained through the three types of analyses proves that the new method presented here can be applied with success to depth profile studies in multilayer systems. Although a full characterisation of interfaces with positrons, if really possible, will require an accurate description of interactions within the probe, for nanometer-scale multilayers the methods applied here can be used as an orientation to select the best solution with the VEPFIT solution.
Conclusions
This work shows that using a reduced implantation profile it is possible to estimate the mean implantation depth and calculate the fraction of annihilations, from an S-W plot, as a function of depth. The method does not make any assumptions about the diffusion of the positron inside the material. These results are confirmed by the SIMS profiles on the same samples. These results support that this direct method, intrinsically non-destructive, could be very competitive with other profiling techniques on multilayered structures particularly when they include films of strongly different densities.
Acknowledgements
This worked was support by the Portuguese Foundation for Science and Technology through the project POCTI/FAT/40924/2001 co-financed by European Union fund FEDER. Likewise, the authors gratefully acknowledge Dr. Zs. Kajcsos comments to the original manuscript.
References
[1] P.G Coleman: Positron beams and their applications (World Scientific, Singapore 2000). [2] P. Asoka-Kumar, K.G. Lynn and D.O. Welch: J. Appl. Phys. Vol. 76 (1994), p. 4935. [3] V.J. Ghosh, and G.C Ares: Phys. Rev. B Vol. 91(1995), p. 54.
[4] G.C. Aers: Appl. Phys. Lett. Vol. 64(1994), p. 661.
[5] G.C Aers, P.A. Marshall, T.C. Leung and R.D. Goldberg: Appl Surf. Sci. Vol. 85(1995), p.196 [6] U. Beck, G. Reiners, Th. Wirth, V. Hoffmann and F. Prässler: Thin Sol. Films Vol.
290-291(1996), p. 57.
[7] A.P. de Lima, C. Lopes Gil, P.M. Gordo and M. Duarte Naia, in: Proceedings of the workshop
on ion and slow positron beam utilisation, edit by C. Nordborg and J.C. Soares, OECD, Paris
(1999), p. 121.
[8] A. van Veen, J. de Vries, R. Hakvoort and M.R IJpma, in: Positron beams for solids and surfaces SLOPOS – 4, edited by P.J. Schultz, G.R. Masiumi, and P.G. Simpson, AIP,
Ontario(1990), p. 171.
[9] O.M.N.D. Teodoro, J.A.M.C. Silva, and A.M.C. Moutinho: Vacuum Vol. 46 (1995), p. 1205. [10] A.V. Fedorov, A. van Veen and H. Schut: Mat. Sci. Forum Vol. 363-365(2001), p. 646.
[11] A. Benninghoven, F.G. Rüdenauer and H.W. Werner: Secondary ion mass spectroscopy (John Wiley & Sons, New York 1987).