CORRECTION
Correction to: Northerly wind trends along the Portuguese marine
coast since 1950
Francisco Leitão
1 &Paulo Relvas
1&Fernando Cánovas
1&Vânia Baptista
1&Alexandra Teodósio
1 Published online: 24 April 2019# Springer-Verlag GmbH Austria, part of Springer Nature 2019
Correction to: Theoretical and Applied Climatology
https://doi.org/10.1007/s00704-018-2466-9
The original version of this article unfortunately contained
mistakes. All figure captions are not accurate. Also, there is a
repeated error in most figures because the vertical scales
incor-rectly show
BWind Strenght^ instead of BWind Strength^ and
in Fig. 4 (mid-panel)
B2003^ instead of B2004^. The corrected
figures are given below.
Publisher’s note Springer Nature remains neutral with regard to jurisdic-tional claims in published maps and institujurisdic-tional affiliations.
The online version of the original article can be found athttps://doi.org/ 10.1007/s00704-018-2466-9
* Francisco Leitão fleitao@ualg.pt
1 Ceentro de Ciências do Mar, Universidade do Algarve, Campus de
Gambelas, 8005-139 Faro, Portugal https://doi.org/10.1007/s00704-019-02806-y
Fig. 1 Map of the Portuguese coast, showing the areas studied and information on the satellite (left panel) and ICOADS (right panel) observation points used to extract the mean wind velocity between the surface and 200 m height for each area. The delimitation of each area (Northwestern - NW,
Southwestern - SW and Southern - S) was adopted according to oceanographic studies and fisher-ies stocks division (ICES sub-division)
-5 -4 -3 -2 -1 0 -15 -10 -5 0 5 10 15 1960 1965 1970 1975 1980 1985 1990 1995 2000 2005 Smo o th w ind s tr e ngt h ( m s -1) W ind stren g th (m s -1) Northwestern
ICOADS Observed Satellite Observed ICOADS Smoothed Satellite Smoothed
a
-5 -4 -3 -2 -1 0 -12 -8 -4 0 4 8 1960 1965 1970 1975 1980 1985 1990 1995 2000 2005 Sm oo th w in d s tr e n g th (m s -1) Win d str e ng th (m s -1) Southwestern -4 -3 -2 -1 0 -8 -4 0 4 8 1960 1965 1970 1975 1980 1985 1990 1995 2000 2005 Smo o th w ind s tr e n g th ( m s -1) W ind st re g th (m s -1) South -6 -5 -4 -3 -2 -1 0JAN FEB MAR APR MAY JUN JUL AUG SEP OCT NOV DEC
W in d str e ng th (m s -1) Month
IXaCN IXaCS IXaS-Algarve
b
Fig. 2 a Observed and smoothedvalues (after LOESS) of monthly northerly wind time series intensity (v-wind) for both ICOADS and Satellite data by study area: Northwestern (NW), Southwestern (SW) and Southern (S). The horizontal line represents the average monthly v-wind values between 1960 and 2010 (ICOADS data). b Observed mean monthly v-wind values for ICOADS data between 1960 and 2010
ICOADS: y = -0.0241x - 1.5283 Satellite: y = -0.0407x - 0.9681 -6 -5 -4 -3 -2 -1 0 1 1960 1965 1970 1975 1980 1985 1990 1995 2000 2005 W ind st rengt h (m s -1) Northwestern ICOADS Sattelit
Linear (ICOADS) Linear (Sattelit)
a
ICOADS: y = -0.0089x - 2.739 Satellite: y = -0.0308x - 2.2657 -6 -5 -4 -3 -2 -1 0 1960 1965 1970 1975 1980 1985 1990 1995 2000 2005 W ind st rengt h ( m s -1) Southwestern ICOADS: y = -0.0149x - 1.0663 Satelite: y = -0.0317x - 0.9527 -4 -3 -2 -1 0 1960 1965 1970 1975 1980 1985 1990 1995 2000 2005 W ind st rengt h ( m s -1) South -0.6 -0.4 -0.2 0.0 0.2 0.4 0.6 19 6 0-1 9 64 19 6 5-1 9 69 19 7 0-1 9 74 19 7 5-1 9 79 19 8 0-1 9 84 19 8 5-1 9 89 19 9 0-1 9 94 19 9 5-1 9 99 20 0 0-2 0 04 20 0 5-2 0 09 W ind st rengt h A nom al ies Northwesternb
-0.6 -0.4 -0.2 0.0 0.2 0.4 0.6 19 60 -19 6 4 19 65 -19 6 9 19 70 -19 7 4 19 75 -19 7 9 19 80 -19 8 4 19 85 -19 8 9 19 90 -19 9 4 19 95 -19 9 9 20 00 -20 0 4 20 05 -20 0 9 W ind st rengt h A nomal ie s Southwestern -0.6 -0.4 -0.2 0.0 0.2 0.4 0.6 19 6 0-1 9 64 19 6 5-1 9 69 19 7 0-1 9 74 19 7 5-1 9 79 19 8 0-1 9 84 19 8 5-1 9 89 19 9 0-1 9 94 19 9 5-1 9 99 20 0 0-2 0 04 20 0 5-2 0 09 W ind st rengt h A nomal ies SouthFig. 3 a Observed and linear adjusted annual ICOADS and Satellite northerly wind (v-wind) trends by study area (left panel): Northwestern (NW), Southwestern (SW) and Southern (S). b Half-decadal anomalies in the northerly wind (v-wind)
-6 -5 -4 -3 -2 -1 0 1 1960 1964 1968 1972 1976 1980 1984 1988 1992 1996 2000 2004 2008 Wind strength (m s-1) Northwestern
Observed Regime Shift Analyses
2003 -6 -5 -4 -3 -2 -1 0 1960 1964 1968 1972 1976 1980 1984 1988 1992 1996 2000 2004 2008 Wind strength (m s-1) Southwestern 2004 -3 -2 -1 0 1960 1964 1968 1972 1976 1980 1984 1988 1992 1996 2000 2004 2008 Wind strength (m s-1) South 1998
Fig. 4 Sudden shifts in the annual northerly wind (v-wind) by study area (black lines representing the RSI - Regime Shift Index): Northwestern (NW), Southwestern (SW) and Southern (S-Algarve). The significant regime shift index periods and inflection year are indicated
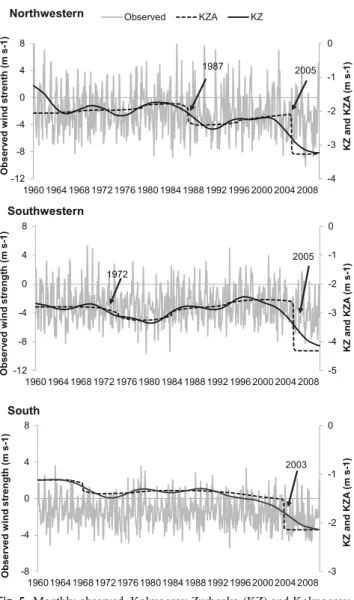
-4 -3 -2 -1 0 -12 -8 -4 0 4 8 1960 1964 1968 1972 1976 1980 1984 1988 1992 1996 2000 2004 2008 KZ and KZA ( m s-1 ) Obs e rv ed w in d s trenth (m s -1 )
Northwestern Observed KZA KZ
1987 2005 -5 -4 -3 -2 -1 0 -12 -8 -4 0 4 8 1960 1964 1968 1972 1976 1980 1984 1988 1992 1996 2000 2004 2008 KZ and KZA ( m s-1 ) Obs e rv e d w ind s tre ngt h ( m s -1 ) Southwestern 2005 1972 -3 -2 -1 0 -8 -4 0 4 8 1960 1964 1968 1972 1976 1980 1984 1988 1992 1996 2000 2004 2008 KZ and KZA (m s -1 ) Obs e rv e d w ind s tre ngt h ( m s -1) South 2003
Fig. 5 Monthly observed, Zurbenko (KZ) and Kolmogrov-Zurbenko Adaptative filter (KZA) trends in northerly wind (v-wind) sud-den shifts by study area: Northwestern (NW), Southwestern (SW) and Southern (S)
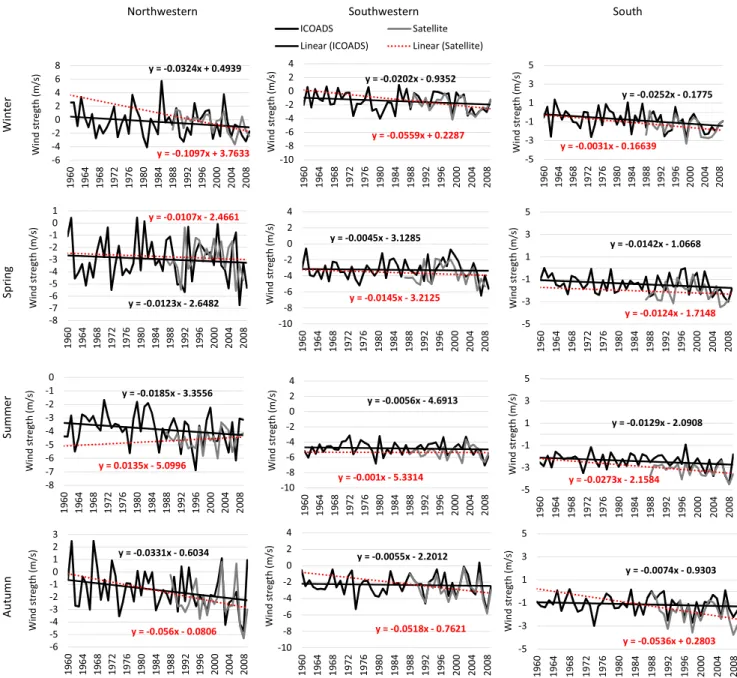
Au tu m n h t u o S n r e t s e w h t u o S n r e t s e w h t r o N Winter Sp ri n g Su m m e r y = -0.0324x + 0.4939 y = -0.1097x + 3.7633 -6 -4 -2 0 2 4 6 8 19 6 0 19 6 4 19 6 8 19 7 2 19 7 6 19 8 0 19 8 4 19 8 8 19 9 2 19 9 6 20 0 0 20 0 4 20 0 8 Wi nd s tr e g th (m /s ) y = -0.0123x - 2.6482 y = -0.0107x - 2.4661 -8 -7 -6 -5 -4 -3 -2 -1 0 1 1 960 1964 1968 1972 1976 1980 9841 1988 1992 1996 2000 2004 2008 Wi nd str e gth (m/ s) y = -0.0185x - 3.3556 y = 0.0135x - 5.0996 -8 -7 -6 -5 -4 -3 -2 -1 0 19 6 0 19 6 4 19 6 8 19 7 2 19 7 6 19 8 0 19 8 4 19 8 8 19 9 2 19 9 6 20 0 0 20 0 4 20 0 8 Wi nd s tr e g th (m /s ) y = -0.0331x - 0.6034 y = -0.056x - 0.0806 -6 -5 -4 -3 -2 -1 0 1 2 3 196 0 196 4 196 8 197 2 197 6 198 0 198 4 198 8 199 2 199 6 200 0 200 4 200 8 Wi nd str e gth (m /s ) y = -0.0202x - 0.9352 y = -0.0559x + 0.2287 -10 -8 -6 -4 -2 0 2 4 19 6 0 19 6 4 19 6 8 19 7 2 19 7 6 19 8 0 19 8 4 19 8 8 19 9 2 19 9 6 20 0 0 20 0 4 20 0 8 Wi nd s tr e gt h (m /s ) ICOADS Satellite
Linear (ICOADS) Linear (Satellite)
y = -0.0045x - 3.1285 y = -0.0145x - 3.2125 -10 -8 -6 -4 -2 0 2 4 196 0 196 4 196 8 197 2 197 6 198 0 198 4 198 8 199 2 199 6 200 0 200 4 200 8 Wi nd s tr e g th (m /s ) y = -0.0056x - 4.6913 y = -0.001x - 5.3314 -10 -8 -6 -4 -2 0 2 4 19 6 0 19 6 4 19 6 8 19 7 2 19 7 6 19 8 0 19 8 4 19 8 8 19 9 2 19 9 6 20 0 0 20 0 4 20 0 8 Wi nd s tr e g th (m /s ) y = -0.0055x - 2.2012 y = -0.0518x - 0.7621 -10 -8 -6 -4 -2 0 2 4 19 6 0 19 6 4 19 6 8 19 7 2 19 7 6 19 8 0 19 8 4 19 8 8 19 9 2 19 9 6 20 0 0 20 0 4 20 0 8 Wi nd s tr eg th (m /s ) y = -0.0252x - 0.1775 y = -0.0031x - 0.16639 -5 -3 -1 1 3 5 1 960 1964 1968 1972 1976 1980 9841 1988 1992 1996 2000 2004 2008 Wi nd s tr e g th (m /s ) y = -0.0142x - 1.0668 y = -0.0124x - 1.7148 -5 -3 -1 1 3 5 196 0 196 4 196 8 197 2 197 6 198 0 198 4 198 8 199 2 199 6 200 0 200 4 200 8 Wi n d st re gth (m /s) y = -0.0129x - 2.0908 y = -0.0273x - 2.1584 -5 -3 -1 1 3 5 19 6 0 19 6 4 19 6 8 19 7 2 19 7 6 19 8 0 19 8 4 19 8 8 19 9 2 19 9 6 20 0 0 20 0 4 20 0 8 Wi nd s tr eg th (m /s ) y = -0.0074x - 0.9303 y = -0.0536x + 0.2803 -5 -3 -1 1 3 5 19 6 0 19 6 4 19 6 8 19 7 2 19 7 6 19 8 0 19 8 4 19 8 8 19 9 2 19 9 6 20 0 0 20 0 4 20 0 8 Wi nd s tr eg th (m /s )
Fig. 6 Inter-annual seasonal observed and linear adjusted northerly wind (v-wind) values by study area: (a) Northwester (NW); (b) Southwestern (SW); and c) Southern (S)
y = -0.0801x + 1.86 y = -0.1259x + 4.914 -8 -4 0 4 8 1960 1963 1966 1969 1972 1975 1978 1981 1984 1987 1990 1993 1996 1999 2002 2005 2008 W ind S tre n g th ( m s -1) JAN
ICOADS Linear (ICOADS)
y = -0.0507x + 0.7315 y = -0.0712x + 1.4293 -8 -4 0 4 8 12 1960 1963 1966 1969 1972 1975 1978 1981 1984 1987 1990 1993 1996 1999 2002 2005 2008 W ind S tre n gt h ( m s -1) FEB
Satellite Linear (Satellite)
y = -0.0052x - 2.2536 y = 0.0792x - 5.6313 -12 -8 -4 0 4 1960 1963 1966 1969 1972 1975 1978 1981 1984 1987 1990 1993 1996 1999 2002 2005 2008 W in d S tr e n g th (m s -1) MAR y = -0.0113x - 2.9451 y = -0.1416x + 2.6248 -12 -8 -4 0 4 1960 1963 1966 1969 1972 1975 1978 1981 1984 1987 1990 1993 1996 1999 2002 2005 2008 Wi n d S tr e ng th (m s -1) MAY y = 0.0736x - 6.9551 y = -0.0101x - 3.2079 -12 -8 -4 0 4 1960 1963 1966 1969 1972 1975 1978 1981 1984 1987 1990 1993 1996 1999 2002 2005 2008 Wi n d S tr e ng th (m s -1) JUN y = -0.0193x - 3.5822 y = 0.0156x - 5.7624 -12 -8 -4 0 4 19 60 19 63 19 66 19 69 19 72 19 75 19 78 19 81 19 84 19 87 19 90 19 93 19 96 19 99 20 02 20 05 20 08 Wi n d S tr e ng th (m s -1) JUL y = -0.0486x - 2.5813 y = -0.0262x - 3.2766 -12 -8 -4 0 4 1960 1963 1966 1969 1972 1975 1978 1981 1984 1987 1990 1993 1996 1999 2002 2005 2008 W ind S tr e n g th (m s -1) AUG y = -0.0586x - 1.1065 y = 0.0506x - 5.3607 -12 -8 -4 0 4 1960 1963 1966 1969 1972 1975 1978 1981 1984 1987 1990 1993 1996 1999 2002 2005 2008 W ind S tr e n g th (m s -1) SEP y = -0.0007x - 1.4578 y = -0.0259x - 0.2884 -8 -4 0 4 8 1960 1963 1966 1969 1972 1975 1978 1981 1984 1987 1990 1993 1996 1999 2002 2005 2008 W ind S tr e ng th (m s -1) OCT y = -0.0148x - 0.4154 y = -0.2178x + 6.5767 -12 -8 -4 0 4 8 1960 1963 1966 1969 1972 1975 1978 1981 1984 1987 1990 1993 1996 1999 2002 2005 2008 Wi n d S tr e ng th (m s-1 ) NOV y = -0.1319x + 4.9466 y = 0.0335x - 1.1097 -12 -8 -4 0 4 8 12 1960 1963 1966 1969 1972 1975 1978 1981 1984 1987 1990 1993 1996 1999 2002 2005 2008 W ind S tr e n g th (m s -1) DEC y = -0.0203x - 2.7459 y = 0.0304x - 4.3599 -12 -8 -4 0 4 8 1960 1963 1966 1969 1972 1975 1978 1981 1984 1987 1990 1993 1996 1999 2002 2005 2008 Wi n d S tr e ngth (m s -1) APR
Fig. 7 Inter-annual monthly observed and linear adjusted northerly wind (v-wind) values in Northwestern (NW) coast. January; February; March; April; May; June; July; August; September; October; November; December
y = -0.0331x - 0.5911 y = -0.0883x + 1.8085 -12 -8 -4 0 4 8 1960 1963 1966 1969 1972 1975 1978 1981 1984 1987 1990 1993 1996 1999 2002 2005 2008 Wind S tr e ngth (m s -1) JAN
ICOADS Linear (ICOADS)
y = -0.0482x - 0.1043 y = 4E-06x - 2.8203 -8 -4 0 4 8 1960 1963 1966 1969 1972 1975 1978 1981 1984 1987 1990 1993 1996 1999 2002 2005 2008 W ind S tr e ngt h ( m s -1) FEB
Satellite Linear (Satellite)
y = -0.0173x - 2.1404 y = 0.0477x - 5.0607 -8 -4 0 4 19 6 0 19 6 3 19 6 6 19 6 9 19 7 2 19 7 5 19 7 8 19 8 1 19 8 4 19 8 7 19 9 0 19 9 3 19 9 6 19 9 9 20 0 2 20 0 5 20 0 8 W in d S tr e ngt h ( m s -1) MAR y = 0.0508x - 6.2218 y = 0.0086x - 3.6669 -12 -8 -4 0 4 19 6 0 19 6 3 19 6 6 19 6 9 19 7 2 19 7 5 19 7 8 19 8 1 19 8 4 19 8 7 19 9 0 19 9 3 19 9 6 19 9 9 20 0 2 20 0 5 20 0 8 W ind St re ng th (m s -1) APR y = -0.0049x - 3.5781 y = -0.142x + 1.6885 -12 -8 -4 0 4 19 6 0 19 6 3 19 6 6 19 6 9 19 7 2 19 7 5 19 7 8 19 8 1 19 8 4 19 8 7 19 9 0 19 9 3 19 9 6 19 9 9 20 0 2 20 0 5 20 0 8 W ind S tr e ngt h ( m s -1) MAY y = 0.0507x - 6.924 y = -0.0055x - 4.1982 -12 -8 -4 0 1 960 1963 1966 1969 1972 1975 1978 1981 9841 1987 1990 1993 9961 1999 2002 2005 2008 W in d S tr e ngth ( m s -1) JUN y = -0.0185x - 4.7877 y = -0.0065x - 5.6092 -12 -8 -4 0 19 6 0 19 6 3 19 6 6 19 6 9 19 7 2 19 7 5 19 7 8 19 8 1 19 8 4 19 8 7 19 9 0 19 9 3 19 9 6 19 9 9 20 0 2 20 0 5 20 0 8 Wind S tr e n gth (m s -1) JUL y = -0.0472x - 3.461 y = 0.0073x - 5.088 -12 -8 -4 0 196 0 196 3 196 6 196 9 197 2 197 5 197 8 198 1 198 4 198 7 199 0 199 3 199 6 199 9 200 2 200 5 200 8 W ind Str e ngt h ( m s -1) AUG y = 0.005x - 3.2184 y = 0.0478x - 5.6842 -8 -4 0 4 19 6 0 19 6 3 19 6 6 19 6 9 19 7 2 19 7 5 19 7 8 19 8 1 19 8 4 19 8 7 19 9 0 19 9 3 19 9 6 19 9 9 20 0 2 20 0 5 20 0 8 W ind S tr e ngt h ( m s -1) SEP y = -0.0092x - 1.7034 y = -0.0105x - 1.734 -8 -4 0 4 196 0 196 3 196 6 196 9 197 2 197 5 197 8 198 1 198 4 198 7 199 0 199 3 199 6 199 9 200 2 200 5 200 8 Wind S tr e ng ht (m s -1) OCT y = -0.0122x - 1.6816 y = -0.1926x + 5.1318 -8 -4 0 4 8 196 0 196 3 196 6 196 9 197 2 197 5 197 8 198 1 198 4 198 7 199 0 199 3 199 6 199 9 200 2 200 5 200 8 Wind S tr e ngth (m s -1) NOV y = 0.0207x - 2.1101 y = -0.0793x + 1.6978 -12 -8 -4 0 4 8 19 6 0 19 6 3 19 6 6 19 6 9 19 7 2 19 7 5 19 7 8 19 8 1 19 8 4 19 8 7 19 9 0 19 9 3 19 9 6 19 9 9 20 0 2 20 0 5 20 0 8 Wind Str e ng th (m s -1) DEC
Fig. 8 Inter-annual monthly observed and linear adjusted northerly wind (v-wind) values in Southwestern (SW). January; February; March; April; May; June; July; August; September; October; November; December
y = -0.0348x - 0.0842 y = -0.0863x + 1.7418 -8 -4 0 4 8 196 0 196 3 196 6 196 9 197 2 197 5 197 8 198 1 198 4 198 7 199 0 199 3 199 6 199 9 200 2 200 5 200 8 W ind St re n g th ( m s-1) JAN
ICOADS Linear (ICOADS)
y = -0.0426x + 0.2042 y = 0.0684x - 4.6165 -8 -4 0 4 196 0 196 3 196 6 196 9 197 2 197 5 197 8 198 1 198 4 198 7 199 0 199 3 199 6 199 9 200 2 200 5 200 8 Wind St re ngth (m s-1) FEB
Satellite Linear (Satellite)
y = -0.0123x - 1.0173 y = 0.0323x - 3.1453 -8 -4 0 4 1960 1963 1966 1969 1972 1975 1978 1981 1984 1987 1990 1993 1996 1999 2002 2005 2008 W in d S tr e ngt h ( m s -1 ) MAR y = -0.0248x - 0.9203 y = 0.0404x - 4.2358 -8 -4 0 4 1960 1963 1966 1969 1972 1975 1978 1981 1984 1987 1990 1993 1996 1999 2002 2005 2008 W in d Str e ngt h ( m s -1 )
APR
y = -0.0056x - 1.2626 y = -0.1098x + 2.2737 -8 -4 0 4 1960 1963 1966 1969 1972 1975 1978 1981 1984 1987 1990 1993 1996 1999 2002 2005 2008 W ind S tr e ng th (m s-1) MAY y = -0.0072x - 1.7965 y = 0.026x - 3.8907 -6 -4 -2 0 2 1960 1963 1966 1969 1972 1975 1978 1981 1984 1987 1990 1993 1996 1999 2002 2005 2008 W ind S tr e ng th (m s-1) JUN y = -0.0241x - 2.0139 y = -0.0828x - 0.424 -6 -4 -2 0 1960 1963 1966 1969 1972 1975 1978 1981 1984 1987 1990 1993 1996 1999 2002 2005 2008 Wi nd S tr e ngth (m s -1 ) JUL y = -0.0073x - 2.4621 y = -0.0252x - 2.1605 -8 -4 0 1960 1963 1966 1969 1972 1975 1978 1981 1984 1987 1990 1993 1996 1999 2002 2005 2008 W ind S tr e ngt h ( m s -1 ) AUG y = -0.007x - 1.3995 y = 0.0297x - 3.6561 -8 -4 0 4 196 0 196 3 196 6 196 9 197 2 197 5 197 8 198 1 198 4 198 7 199 0 199 3 199 6 199 9 200 2 200 5 200 8 Wind S tr e n gth (m s -1 ) SEP y = -0.0061x - 0.7662 y = -0.0154x - 0.6297 -8 -4 0 4 196 0 196 3 196 6 196 9 197 2 197 5 197 8 198 1 198 4 198 7 199 0 199 3 199 6 199 9 200 2 200 5 200 8 W ind St re ngt h ( m s-1) OCT y = -0.0091x - 0.6251 y = -0.1752x + 5.1267 -8 -4 0 4 8 1 960 1 963 1 966 1 969 1 972 1 975 1 978 1 981 1 984 1 987 1 990 1 993 1 996 1 999 2 002 2 005 2 008 Wind S tr e n gth (m s -1 ) NOV y = 0.0017x - 0.6524 y = -0.0829x + 2.1835 -8 -4 0 4 196 0 196 3 196 6 196 9 197 2 197 5 197 8 198 1 198 4 198 7 199 0 199 3 199 6 199 9 200 2 200 5 200 8 W ind St re n g th ( m s-1) DECFig. 9 Inter-annual monthly observed and linear adjusted northerly wind (v-wind) values in Southern-Algarve (S). January; February; March; April; May; June; July; August; September; October; November; December