A Framework for Usage Modeling and
Anomaly Detection in Large-Scale
802.11 Networks
Dossa Mohamed Massa Tese de Doutoramento Apresentada
à Faculdade de Engenharia da Universidade do Porto em Telecommunications Engineering
Supervisor: Prof. Ricardo Santos Morla (PhD)
Abstract
Wireless 802.11 networks are a popular technology that offers inexpensive ubiquitous access to the Internet in campuses, enterprises, homes, coffee shops, airports, and other public places. Their wide-scale adoption has brought great convenience to many people, giving them anytime and anywhere access to the Internet. As a result people are becoming more and more dependent on these networks and are increasingly demanding reliability and high performance when connecting to the Internet through them. Due to the inherent problems of the wireless medium, these demands from the users pose significant challenges for network administrators. Learning how each part of the network behaves and how it is used is fundamental in addressing these challenges. As a network grows in scale and usage, these demands become an even greater challenge and it may not be feasible for administrators to use the same techniques that are used for small deployments. It is increasingly difficult for network administrators to maintain knowledge of infrastructure usage properties including usage patterns of individual access points (APs), users, and locations as well as their susceptibility to different problems as a deployment scales up. Network administrators require other complementary techniques for network management.
In this thesis, we propose to use the analysis of collected 802.11 network usage data to aid performance and fault management of large-scale networks. Realistic knowledge of the usage patterns of 802.11 networks is critical for performance management, in a bid to make sure that resources are provisioned according to usage and that the network delivers the desired performance with respect to the expected usage. Learning from the collected 802.11 data is also crucial for fault management, as it may help network administrators to efficiently detect and fix different connectivity and performance problems facing the users of large-scale 802.11 networks. To simplify management of large-scale 802.11 networks, in this thesis we contribute with a framework for 1) usage modeling and 2) anomaly detection, both based on the analysis of collected 802.11 usage data.
Most previous works on usage modeling focus on the user perspective of 802.11 including user mobility, registration, dwelling, and encounter patterns. In our framework we propose and evaluate a number of probabilistic models for automatic characterization of access point (AP) usage. We include dependent and time-independent models of AP usage characterization, as well as models that consider AP week structure usage namely weekdays, weekends, and individual days of the week (Monday-Sunday).
On the other hand, most previous works on anomaly detection uses enhanced devices (clients and APs), hardware sensors, sniffers, and controllers for detecting anomalies such as interference, overload, and halted or crashed APs. In our framework, we propose a methodology for detecting patterns of AP usage anomaly based on the
analysis of the relationship between session endings at 802.11 AP. We identify a usage pattern named “abrupt ending” of 802.11 AP connections that happens when a large number of user sessions in the same access point (AP) end within a one second window. We propose an algorithm for automatic detection and characterization of different anomaly-related patterns associated to AP abrupt ending occurrences. We confirm the existence of significant statistical relationship between abrupt ending occurrences, anomaly-related patterns occurrences, and aggregate 802.11 network usage in terms of total number of sessions. We confirm the existence of abrupt endings in other 802.11 deployments. Our findings indicate abrupt endings are primarily the effect of interference across the 802.11 infrastructure and usage pattern behavior of the APs, but also misconfiguration and bugs on the 802.11 APs. Users and their respective device’s specifics play no significant role in abrupt ending manifestation. We finally provide an online implementation of the detection and characterization of abrupt endings and their respective anomaly-related patterns using the Esper complex event driven processing engine.
“The more you know about your 802.11 network, the more you can do with it and the better you can make it”
Resumo
As redes sem fio 802.11 são uma tecnologia popular que oferece acesso ubíquo e barato à Internet no campus, na empresa, em casa, no café, no aeroporto, e noutros espaços públicos. A sua ampla adoção é conveniente para muitas pessoas, dando-lhes acesso à Internet em qualquer altura e em qualquer lugar. Como resultado desta adoção, as pessoas estão a tornar-se cada vez mais dependentes destas redes e exigem cada vez mais fiabilidade e alto desempenho quando se ligam à Internet através destas redes. Devido aos problemas inerentes do meio sem fios, estas exigências dos utilizadores colocam desafios significativos para os administradores destas redes. Aprender como cada parte da rede se comporta e como é utilizada é fundamental para endereçar estes desafios. À medida que a rede cresce em escala e utilização, estas exigências dos utilizadores tornam-se um ainda maior desafio e pode não ser viável os administradores utilizarem as mesmas técnicas que utilizam para pequenas redes. É cada vez mais difícil para os administradores de rede manterem conhecimento das propriedades da utilização da infraestrutura - incluindo padrões de utilização de pontos de acesso sem fio (APs) individuais, utilizadores, e localizações bem como a sua susceptibilidade a diferentes problemas à medida que a rede se torna maior. Os administradores de rede precisam de outras técnicas complementares para a gestão da rede.
Nesta tese propomos utilizar a análise de dados de utilização recolhidos da rede 802.11 para ajudar à gestão de desempenho e falhas em redes de grande escala. O conhecimento realista dos padrões de utilização das redes 802.11 é crítico para a gestão de desempenho, de modo a garantir que os recursos são aprovisionados de acordo com a utilização e que a rede oferece a capacidade desejada para a utilização esperada. Aprender a partir dos dados recolhidos da rede 802.11 é também crucial para a gestão de falhas, já que pode ajudar os gestores de rede a detetar e resolver eficientemente problemas de conectividade e desempenho que afetam os utilizadores de redes 802.11 em grande escala. De modo a simplificar a gestão destas redes, nesta tese contribuímos com uma framework para 1) modelização da utilização e 2) detecção de anomalias, ambas baseadas na análise de dados de utilização recolhidos da rede 802.11.
A maioria dos trabalhos anteriores em modelização da utilização dá ênfase à perspetiva do utilizador incluindo padrões de mobilidade, registo, estadia, e encontro. Na nossa framework propomos e avaliamos vários modelos probabilísticos para a caracterização automática da utilização de APs. Incluímos modelos dependentes e independentes do tempo, bem como modelos que consideram a estrutura semanal da utilização dos APs nomeadamente dias da semana, fins de semana, e dias individuais da semana (Segunda-feira a Domingo).
Por outro lado, a maioria dos trabalhos anteriores em detecção de anomalias utiliza dispositivos aumentados (clientes e APs), sensores em hardware, sniffers, e controladores para detetar anomalias como interferência, sobrecarga, e APs parados ou em falha. Na nossa framework propomos uma metodologia para detetar padrões de
anomalias de utilização de APs baseada na análise de relações entre término de sessões nos APs. Identificamos um padrão de utilização chamado “término abrupto” de ligações a APs 802.11 que ocorre quando um grande número de sessões de utilizador no mesmo AP terminam na mesma janela de um segundo. Propomos um algoritmo para a detecção e caracterização automática de vários padrões anómalos associados a ocorrências de términos abruptos. Confirmamos a existência de uma relação estatística significativa entre ocorrência de términos abruptos, ocorrência de padrões relacionados com anomalias, e utilização agregada da rede 802.11 em termos de número total de sessões. Confirmamos a existência de términos abruptos em outras redes 802.11. O que descobrimos indica que os términos abruptos são principalmente o efeito de interferência através da infraestrutura 802.11 e padrões de comportamento dos APs, mas também configurações erradas e bugs nos APs. Os utilizadores e as características dos seus dispositivos não tomam um papel significativo na manifestação de términos abruptos. Por fim providenciamos uma implementação online da detecção e caracterização de términos abruptos e dos seus respetivos padrões de anomalia utilizando o motor Esper de processamento de eventos complexos.
Acknowledgements
First and foremost, I would like to express my sincere gratitude to my academic advisor Prof. Ricardo Santos Morla, whom his constant support, stimulating discussions, valuable comments and insights provided me the perfect guidance that I needed through my Ph.D. journey. Ricardo’s comments and ideas always come at the appropriate moment and place with the right amount, keeping me busy and focused always. I am very glad that all our efforts were useful and valuable. A part of the effort has turned into completion of this thesis, and the rest prepared me well for my future careers.
I would also like to thank my employer the Institute of Finance Management in Tanzania (IFM) and the Foundation for Science and Technology (FCT) in Portugal for their extended financial support throughout my Ph.D. studies. Certainly, without their support results of this work would not be the same. FCT support was received through grant number SFRH/BD/69824/2010. I am also thankful that in the context of FCT, particularly project SUM through PTDC/EIA/113999/2009, I received UMinho data set which I used for validation of my results in this thesis. Also, I am very grateful to INESC-TEC direction for allowing me to conduct my research in their highly reputable research laboratory (CTM). It's an incredibly positive working environment. In addition, I am very thankful to all my colleagues including those at IFM, in the MAP-tele program, and at INESC-TEC for their constant encouragement, support, and friendship. I am also very grateful to all my friends in Porto for the good moment we spent together. They really helped me in making this beautiful city a home away from home.
Moreover, I would like to thank all members of my family, especially my parents Hajj Mohamed .K. Massa and the late Nibaro Athuman Liku, for being a source of joy in my life and for making me a person I am today both personally and professionally. Also, I am enormously grateful to all my seven brothers, two sisters, and all my in-laws for their endless love, encouragement, advice, and support. They always encouraged me through the rough times and advised me not to give up on this Ph.D. work. I am thankful for all their efforts and I feel very lucky to have them in my family.
Last but not least, I would like to thank my wife Halima Sharifu. She has been very considerate and supportive throughout my Ph.D. process: always turning around the boring situations into laughter and depressing ones into consolations. I am specifically grateful for her encouragement to let me pursue what I dream of rather than what would have seemed convenient for us. I am also enormously grateful to our children Nibaro, Abdillah, and Abdulrahman. Nibaro came just to visit me here with my father and decided to stay until the end of my Ph.D. Little Abdillah was born at the last stage of my Ph.D. work, while a tiny Abdulrahman was born during thesis write-up phase. Indeed, they both brought much fun, happiness, and joy into our lives which are impossible to enumerate all here.
Table of Contents
Chapter 1: Introduction... 1
1.1 Management Challenges of Deployed 802.11 Networks ... 1
1.2 Trace-Based Analysis for 802.11 Network Management ... 2
1.3 Limitation of Current Analyses ... 3
1.4 Framework for Usage Modeling and Anomaly Detection ... 4
1.5 Contributions ... 7
1.6 Thesis Structure ... 8
Chapter 2: Overview of 802.11 Networks ... 9
2.1 Network Architecture ... 9
2.2 Protocol Architecture ... 11
2.2.1 Data Link Layer ... 11
2.2.2 Physical Layer ... 13
2.3 Challenges of Managing 802.11 Networks ... 14
2.4 Network Management ... 16
2.4.1 Network Management Architecture ... 16
2.4.2 Simple Network Management Protocol (SNMP) ... 17
2.4.3 Functions of Network Management Systems ... 18
2.5 Trace-Based Analysis as a complement to Network Management ... 21
2.5.1 SNMP-based Network Management ... 21
2.5.2 Web-based Network Management ... 21
2.5.3 Automated Network Management ... 21
2.5.4 Trace-based Network Management ... 21
2.6 The need for A Framework ... 23
Chapter 3: Related Work ... 25
3.1 Introduction ... 25
3.2 Usage Modeling ... 26
3.2.1 General Statistics ... 26
3.2.2 Mobility Modeling ... 27
3.2.3 User Encounter Patterns ... 31
3.2.4 User Registration Patterns ... 33
3.2.6 Traffic Characterization ... 35
3.2.7 Public 802.11 Infrastructure Usage ... 36
3.3 Anomaly Detection ... 38
3.3.1 Overload Detection ... 38
3.3.2 AP Halt/Crash Detection ... 40
3.3.3 Interference Detection ... 41
3.3.4 Rogue AP Detection ... 42
3.3.5 Performance Anomaly Detection ... 43
3.3.6 Network Management Tools ... 46
3.4 Analysis ... 47
3.5 Conclusion... 51
Chapter 4: Modeling 802.11 AP Usage ... 52
4.1 Introduction ... 52
4.2 Experimental Setup ... 53
4.2.1 Variables... 53
4.2.2 Data Set ... 53
4.2.3 Figures of Merit ... 55
4.3 Statistical Generative Models of 802.11 AP usage ... 56
4.3.1 Overview ... 56
4.3.2 Exponential... 57
4.3.3 Discrete Mixture of Exponentials using K-Means ... 57
4.3.4 Mixture of Exponentials with Gamma Scale ... 58
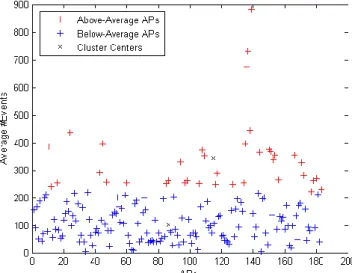
4.3.5 Above-Below AP Daily Event Count Average ... 58
4.3.6 Binary Conditional Probability Models ... 60
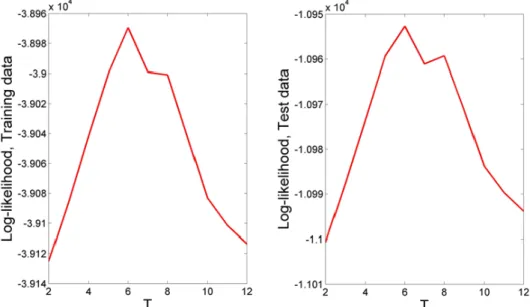
4.3.7 Plugging-in Above-Below Average Models ... 60
4.3.8 ARIMA Model ... 61
4.4 Experimental Evaluation of 802.11AP Usage Models ... 61
4.4.1 Exponential... 61
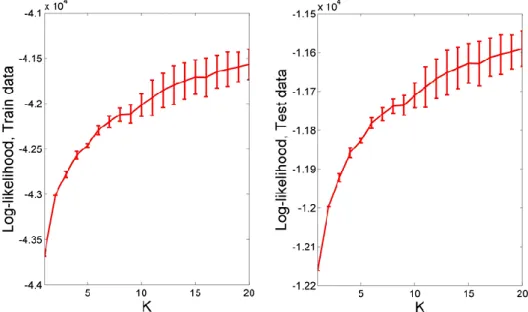
4.4.2 Discrete Mixture of Exponentials using K-Means ... 61
4.4.3 Mixture of Exponentials with Gamma scale ... 62
4.4.4 Above-Below AP Daily Event Count Average ... 62
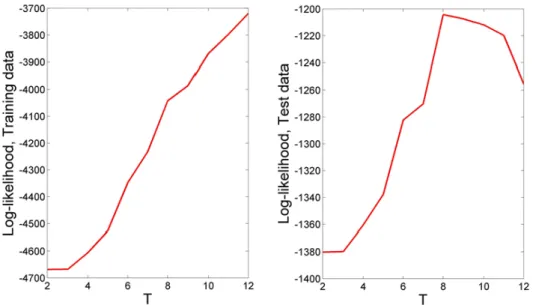
4.4.5 Binary Conditional Probability Models ... 63
4.4.6 Plugging-in Above-Below Average Models ... 63
4.4.7 ARIMA Model ... 64
4.5 Time-Dependent Models Considering Different Settings of Variables ... 66
4.5.1 Overview ... 66
4.5.2 Considering All-days AP Usage Samples ... 66
4.5.3 Considering Week Structure AP Usage Samples ... 67
4.5.4 Comparing All-days Model Vs. Hybrid Model ... 69
4.5.5 Comparing All-days Model Vs. Individual Days Model ... 69
4.5.6 Summary ... 70
4.6 Performance Comparison of AP Usage Models based on Different Data Sets ... 70
4.6.1 Overview ... 70
4.6.2 Binary Conditional Probability Models ... 71
4.6.3 Plugging-in Above-Below Average Models ... 71
4.6.4 Summary ... 71
4.7 Conclusions ... 74
Chapter 5: Anomaly Detection of 802.11 AP Usage - Abrupt Ending of 802.11 AP Connections ... 75
5.1 Introduction ... 75
5.2 Abrupt Ending Characterization ... 76
5.2.1 Definition ... 76
5.2.2 Trace Data Characteristics... 77
5.2.3 Threshold for Abrupt Ending of AP Connections ... 77
5.2.4 Abrupt Ending Data Overview ... 78
5.3 Possible Causes ... 79
5.3.1 Abrupt Ending and User’s Devices ... 79
5.3.2 Abrupt Ending and AP Models ... 79
5.3.3 Abrupt Ending and User IDs ... 80
5.3.4 Abrupt Ending and AP Locations ... 81
5.3.5 Abrupt Ending and Usage ... 81
5.4 Statistical Models of Abrupt Ending Occurrences ... 82
5.4.1 Methodology ... 82
5.4.2 Linear Regression Model ... 83
5.4.3 Continuous probability Distributions Models ... 85
5.5 Conclusions ... 89
Chapter 6: Detecting and Modeling Patterns of Abrupt Ending of 802.11 AP Connections ... 90
6.1 Introduction ... 90
6.2.1 Anomaly-Related Pattern Characterization ... 91
6.2.2 Anomaly-Related Pattern Definition ... 91
6.2.3 Detection Algorithm Overview ... 92
6.3 Anomaly-Related Pattern Detection: Experimental Results ... 93
6.3.1 Interference Across AP Vicinity Patterns ... 93
6.3.2 AP Persistent Intereference Patterns ... 94
6.3.3 AP Overload Patterns ... 95
6.3.4 AP Halt/Crash Patterns ... 95
6.3.5 AP Interferences Patterns ... 96
6.3.6 User Authentication Failure Patterns ... 96
6.3.7 User Intermittent Connectivity Patterns ... 97
6.3.8 Summary ... 98
6.4 Anomaly-Related Pattern Modeling: Experimental Results ... 98
6.4.1 Linear Regression Models ... 98
6.4.2 Continuous Probability Distributions Models ... 101
6.4.3 Summary ... 101
6.5 Anomaly-Related Pattern Detection: Experimental Evaluation ... 102
6.5.1 Using Data sets from different Hotspots ... 102
6.5.2 DBSCAN Clustering Results ... 102
6.6 Online Detection of Anomaly-Related Patterns ... 104
6.6.1 Methodology ... 104
6.6.2 Interference Across AP Vicinity Patterns ... 105
6.6.3 AP Persistent Intereference Patterns ... 106
6.6.4 AP Overload Patterns ... 108
6.6.5 AP Halt/Crash Patterns ... 109
6.6.6 AP Interferences Patterns ... 110
6.6.7 Summary ... 110
6.7 Conclusions ... 111
Chapter 7: Conclusions and Future Work ... 112
List of Acronyms
AIC Akaike Information Criterion
AP Access Point
ARIMA Auto-Regressive Integrated Moving Average BSS Basic Service Set
CDF Cumulative Distribution Function
CORBA Common Object Request Broker Architecture CPD Conditional Probability Distribution
CRC Cyclic Redundancy Check
CSMA/CA Carrier Sense Multiple Access with Collision Avoidance CSMA/CD Carrier Sense Multiple Access with Collision Detection CTS Clear to Send
DBSCAN Density based Clustering Algorithm DCF Distribute Coordination Function DHCP Dynamic Host Configuration Protocol DNS Domain Name Server
DS Distribution System
DSSS Direct Sequence Spread Spectrum ESS Extended Service Set
FCAPS Fault, Configuration, Accounting, Performance, and Security FEUP Faculty of Engineering of the University of Porto
FHSS Frequency Hopping Spread Spectrum GPS Global Positioning System
HTTP Hypertext Transfer Protocol IAB Internet Activities Board IBSS Independent Basic Service Set IETF Internet Engineering Task Force IP Internet Protocol
ISM Industrial, Scientific and Medical ISO International Standard Organization LL Log-likelihood
LLC Logical Link Control MAC Media Access Control
MIB Management Information Base MIMO Multiple-Input and Multiple-Output NIC Network Interface Card
OFDM Orthogonal Frequency Division Multiplexing PCF Point Coordination Function
PDF Probability Density Function PHY Physical Layer
QoS Quality of Service
RADIUS Remote Authentication Dial-In User Service
RF Radio Frequency
RMON Remote Network Monitoring RSSI Received Signal Strength Indicator RTS Request to Send
RTT Round Trip Time
SINR Signal to Interference Noise Ratio SMI Structure of Management Information SNMP Simple Network Management Protocol SSID Service Set Identifier
TCP Transmission Control Protocol UDP User Datagram Protocol
U-NII Unlicensed National Information Infrastructure VoIP Voice Over IP
List of Figures
Figure 1. Proposed framework for usage modeling andanomaly detection ... 4
Figure 2. Wireless 802.11 network architecture ... 10
Figure 3. RTS/CTS Procedure ... 12
Figure 4. Network management system’s architecture ... 17
Figure 5. Underlying features of the access points usage pattern in the hotspot ... 55
Figure 6. Clusters of APs based on above-below average event counts ... 58
Figure 7. Log-likelihood of K-component exponential mixtures ... 62
Figure 8. Log-likelihoods of the T=2:12 different binary CPD models ... 63
Figure 9. Log-likelihoods of the T=2:12 different plugging-in models ... 64
Figure 10. 100 random hold-out cross-validation training (left) and test (right) data sets ... 65
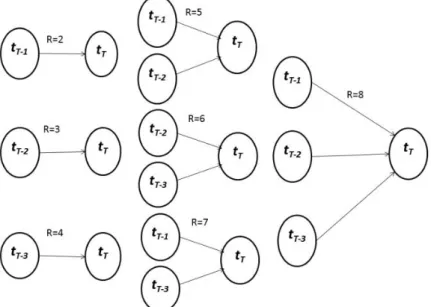
Figure 11. R=2:8 Different modeling proposals ... 66
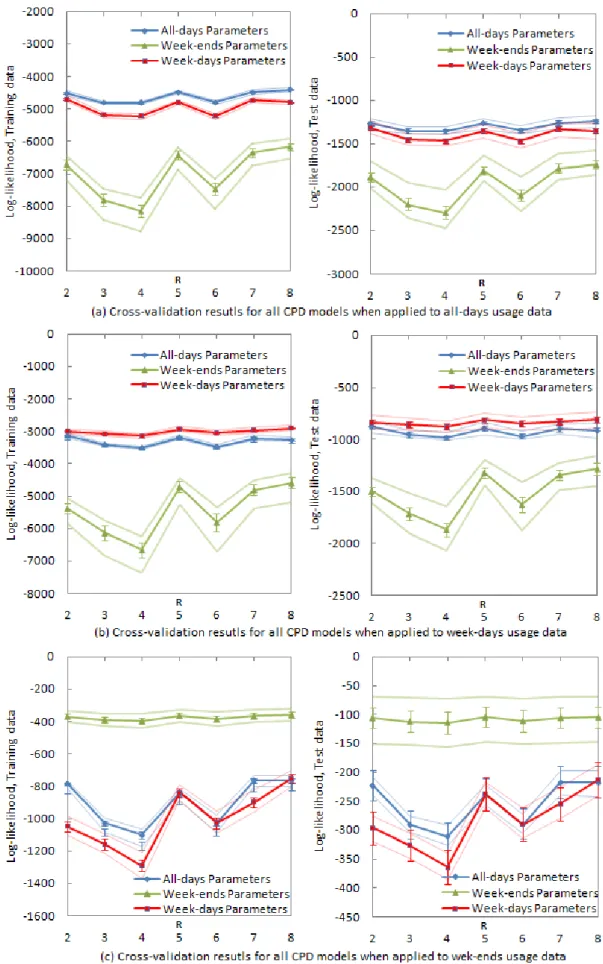
Figure 12. R=2:8 CPD models on different AP usage data ... 72
Figure 13. R=2:8 Plugging-in above-below average models on different AP usage data... 73
Figure 14. Popularity of vendors and abrupt ending occurrences ... 79
Figure 15. Fraction of abrupt ending sessions to the total number of sessions per user ... 80
Figure 16. Fraction of abrupt ending sessions to the total number of sessions for each AP ... 81
Figure 17. Aggregate 802.11 total network usage and total abrupt ending occurrences ... 82
Figure 18. Total 802.11 session count vs. average number of abrupt endings ... 83
Figure 19. Plot of the proposed simple linear regression model fittings ... 84
Figure 20. Simple linear regression model fittings and resulting analysis of fit ... 85
Figure 21. Fitting results for Exponential, Gamma, and Gaussian distributions models ... 87
Figure 22. Model parameters, LL, and AIC results for Exponential, Gamma, and Gaussian ... 88
Figure 23. Algorithm for detection and characterization of anomaly-related patterns ... 92
Figure 24. Different threshold settings vs. counts for across AP vicinity pattern detection ... 93
Figure 25. Linear Regression models fitting for the significant anomaly-related patterns ... 100
Figure 26. DBSCAN clustering results of the abrupt ending data ... 103
Figure 27. Online system’s architecture for anomaly-related patterns detection ... 105
Figure 28. Time windows vs. counts for online detection of across AP vicinity pattern ... 106
Figure 29. Results for online detection of AP persistence interference patterns ... 107
Figure 30. Time windows tested for online detection of AP overload patterns vs. counts ... 108
Figure 31. Time windows tested for online detecting of AP halt/crash patterns vs. counts ... 109
List of Tables
Table 1. Features of the related work ... 49
Table 2. ARIMA Model fitting results ... 64
Table 3. Model parameters ... 65
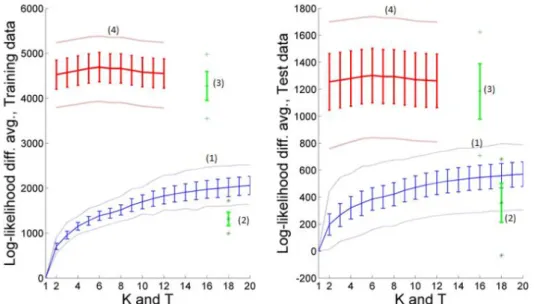
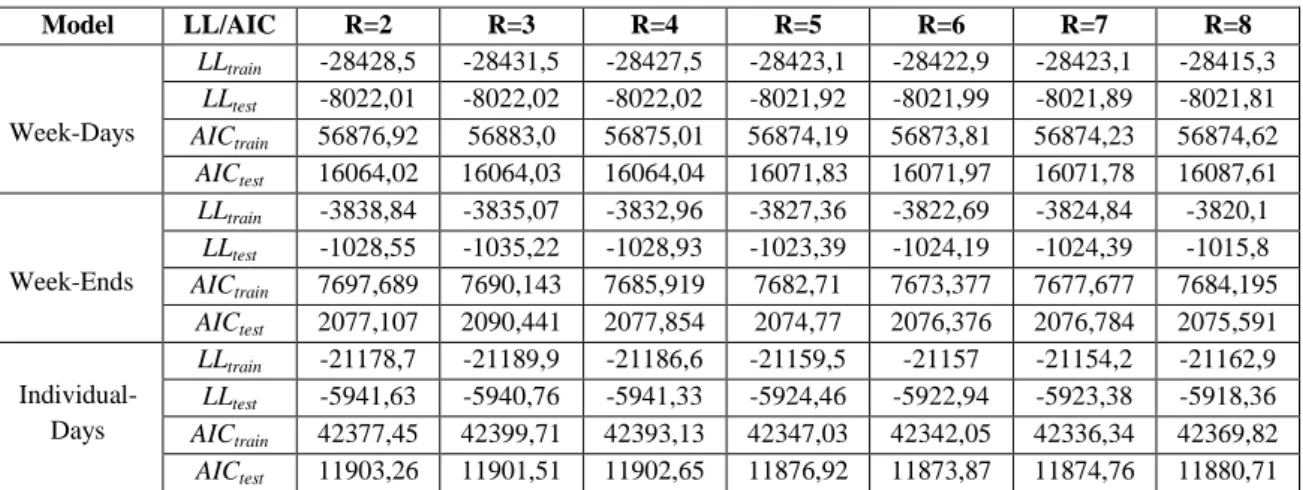
Table 4. Log-likelihood and AIC results R=2:8 CPD models ... 66
Table 5. Log-likelihood and AIC results R=2:8 Plugging-in above-below average models ... 67
Table 6. Log-likelihood and AIC results R=2:8 CPD models across all week-structure ... 68
Table 7. Log-likelihood and AIC results R=2:8 Plugging-in models across week-structure ... 68
Table 8. ARIMA model fitting results for all parts of the week-structure ... 69
Table 9. The gain in LL and AIC values of hybrid model over all-days model... 69
Table 10. The gain in LL and AIC values of individual days model over all-days model ... 70
Table 11. High-level evolution of the hotspot usage over the 2 and a half year ... 77
Table 12. Percentage of n-ending sessions and their respective AP counts ... 78
Table 13. AP models and their associated counts and fraction of abrupt endings ... 80
Table 14. Thresholds tested for detecting AP persistence interference ... 94
Table 15. Thresholds tested for detecting AP overload patterns ... 95
Table 16. Thresholds tested for detecting AP halt/crash patterns ... 95
Table 17. AP Interference patterns occurrence ... 96
Table 18. Characterization of intermittent connectivity patterns ... 97
Table 19. Linear regression models fitting results for each anomaly-related pattern ... 99
Chapter 1
Introduction
1.1 Management Challenges of Deployed 802.11 Networks
Wireless 802.11 networks that span across several buildings in universities and enterprises or that connect several homes and cities are referred to as large-scale networks. Large-scale networks are typically characterized by many network elements such as 802.11 access points mainly for providing coverage and capacity, for supporting a large number of users typically with heterogeneous client devices and a variety of applications, and also for enabling large volumes of traffic that arise due to the intensive use of the network at various distinct locations in the coverage area.
As 802.11 networks grow in scale and usage, the challenges for network management also grow. For a small network, it is straightforward for the administrator to acquire by experience and manual inspection the baseline knowledge of the overall infrastructure usage characteristics. Administrators may know about: 1) usage behavior of individual users, e.g. the APs they tend to associate, their average access durations, application preferences, and the amount of traffic they tend to generate; 2) individual access points usage properties, e.g. when are they busy and idle, the amount of traffic they normally process, and their susceptibility to different problems; and 3) location preferences in terms of network usage (e.g. library, cafeteria, student center, etc.) and locations that are prone to problems such as interference or overload.
In contrast, for a large-scale network this knowledge is difficult to acquire due to the physically distributed nature of the network and its high number of APs, users, and network locations. For example, consider a campus network with several hundred APs and thousands of users, spread across a large physical space, and covering about 30 buildings both indoor and outdoor. In this case, maintaining a mental baseline knowledge of the infrastructure usage characteristics including usage patterns of individual APs, users, and locations is not practical and may not be feasible. Scale poses difficulties in following up usage of APs, users, and locations in the infrastructure, let alone detecting any potential problems.
In addition, challenges associated to shared spectrum and the time varying nature of the wireless medium occur both in small and large 802.11 networks. Wireless channel conditions continuously evolve over time and change differently in different parts of the environment. This means that at any given moment in time one or more access points and users in certain locations of the infrastructure are likely to be facing problems such as interference, intermittent connections, or authentication failure. These problems can
affect multiple APs and locations at the same time in the infrastructure and can be difficult to detect given the scale of the network. Having a device walk/run near every AP for detection of problems in the network proves to be not only inconvenient but also expensive.
To constantly ensure that users of the network have consistent access, that problems on the network can be quickly identified and resolved, and that the network provides desired capacity and reliably, 802.11 administrators require complementary approaches such as learning from the collected 802.11 network usage data.
1.2 Trace-Based Analysis for 802.11 Network Management
Network management encompasses a wide range of activities as depicted by the ISO FCAPS model [15, 16], which defines five areas of network management functions: fault, configuration, accounting, performance, and security. Analysis of the collected network usage data can play a crucial role towards fulfilling some of the goals of these management functions, given the aforementioned complexities of large-scale 802.11 networks. The following discusses how this can be achieved in each of the five management areas. 1) Fault management: different abnormal network usage behaviors of APs, users, and locations can be detected by observing different indicators of abnormality in the data e.g. increased packet error rate or packet retransmissions rate. 2) Configuration management: problems related to device misconfigurations (APs or users) in any location of the network can be detected by observing appropriate patterns in the usage data e.g. authentication failure for legitimate users or frequently disconnected clients. 3) Accounting management: tracking network usage e.g. association durations and amount of bytes/packet sent and received of individual users, group of users, departments or units is possible irrespective of their locations. 4) Performance management: Over-utilized/under-utilized APs and locations in terms of usage in the infrastructure can be observed and together with their corresponding times of the day e.g., their aggregate association durations, number of sessions established, and traffic. 5) Security management: unauthorized access to a network as well as unauthorized access points attached to a network in any location of the network can be identified from the trace data, e.g. unknown/unregistered user and AP MAC addresses.
While configuration, accounting, and security remain important functions of 802.11 network management; our emphasis in this thesis is on the application of trace-based analysis on performance and fault management of a large-scale network. Performance management is focused on ensuring that network performance is maintained at acceptable thresholds. To realize this goal effectively, appropriate plan and models for network usage need to be developed from trace analysis, so that resources in the network can be provisioned with proper balance to achieve the desired network performance, in relation to usage. The goal of fault management is to detect and correct faults that occur in the network. To detect and correct faults quickly and efficiently, appropriate indicators for network usage anomalies must be devised and monitored from the trace data, so that algorithms and models can be developed for identification of their true nature and for their proper characterization. Our approach of using collected
802.11 usage data analysis for performance and fault management aims to fulfill the aforementioned objectives in such a manner. In this way, administrator in charge of managing 802.11 networks can stay ahead of impending capacity and connectivity problems likely to occur in large-scale networks.
1.3 Limitation of Current Analyses
The focus of early 802.11 trace-based works was to understand general characteristics of 802.11 network usage. Numerous basic statistics about 802.11 network usage were then presented: like the average number of users, average session’s duration, bytes sent and received, and protocols used [51 - 55]. Although these statistics helped to understand the underlying usage properties of 802.11 networks, there were no attempts to model this usage.
The major focus of recent studies on 802.11 networks is on user mobility [56 - 80], user encounter patterns at APs [81 - 88], user registration patterns at APs [89 - 95], user dwelling time at APs [96 - 100], and traffic [101 - 109]. These works provide broad classification of users based on their degree of mobility, encounter patterns, arrival and departures patterns to APs, and traffic. However, their focus is more on the users’ perspective of network usage rather than the access point, e.g. mobility, association, and traffic models of individual users or group of users. In addition, it is not possible to derive synthetic samples from these models for using e.g. in a network simulator as most of the proposed models are not probabilistic in nature.
On the other hand, most works for anomaly detection proposed in the literature aim to detect overload and flash crowd at an AP [117 - 128], failed and disconnected clients at AP [129 - 132], anomalous signal strength variations at AP and interference [136 - 147], and rogue AP [145 - 153]. However, in order to detect anomalies most of these works suggest the use of enhanced devices (clients and APs), sniffers, and third party hardware device such as controllers/sensors rather than looking at AP usage patterns. While detecting patterns of anomaly by looking at AP usage data can be simple and effective, deploying and maintaining these devices in 802.11 infrastructures is difficult and expensive.
Along the same line of research there are other works that aim to detect hidden terminals, stations experiencing capture, anomalous traffic, and intrusions at AP [154 - 175]. However, the performance of each proposed 802.11 deployment scenarios in these frameworks is evaluated either based on a small scale network, on a testbed, or on simulations, thus hardly quantifying the underlying characteristics of a large-scale 802.11 deployment. There exist also several open source and commercial-based products that aid 802.11 network management tasks [176 - 179]. However, their main focus is to provide aggregate statistics and graphs of 802.11 network usage rather than detecting patterns of anomaly in AP usage and establishing their respective nature.
Current approaches do not support automatic detection and characterization of anomaly-related patterns in the usage of APs namely AP interference, AP crash, AP overload, user intermittent connectivity and authentication failure patterns at AP which makes them not viable option for immediate adoption as network management tools.
1.4 Framework for Usage Modeling and Anomaly Detection
Our focus in this thesis is on probabilistic models of AP usage and detecting patterns of anomaly in the usage of AP. The emphasis on AP usage and the use of probabilistic generative models is better suited to 1) performance management of large-scale 802.11 infrastructures, e.g. models for capacity planning suitable for resource provisioning of large-scale 802.11 networks, and 2) network simulation tools for evaluating applications and protocols that may run in 802.11 infrastructures. The emphasis on detecting patterns of anomaly in the usage of AP and establishment of their respective nature is better suited to 3) fault management of large-scale 802.11 networks, as it may help network administrators to quickly and efficiently detect and fix problems linked to usage of the large-scale 802.11 networks.
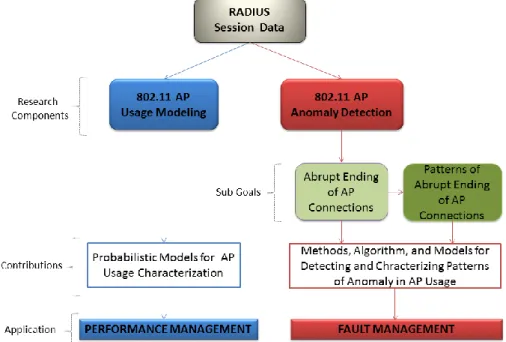
With the aforementioned 1-3 items in mind, in this thesis we propose a framework for realistic usage modeling and anomaly detection for large-scale 802.11 networks. The high level architecture of this framework is shown in figure 1.
Figure 1. Proposed framework for usage modeling and anomaly detection
Our proposed framework can be used in two network management functions as far as FCAPS is concerned, namely performance and fault management. Our proposed framework can be part of a proactive network management strategy for handling network capacity and reliability problems before they affect network and network services. For example, the performance management feature of our framework aims to provide network administrators with the ability to understand and to predict usage of APs in 802.11 infrastructures. Understanding AP usage can be helpful in resource allocations of a large-scale 802.11 network. Proper allocation of network resources may enable 802.11 networks to deliver performance according to the expected usage and traffic demand of 802.11 users, thereby resolving many of performance problems such as AP overload, degraded throughput, and delay. On the other hand, the fault
management feature of our framework aims to help 802.11 administrators in diagnosing and detecting patterns of anomaly associated to usage of APs in the infrastructure. In this way, appropriate remedial actions/decisions can be taken depending on the nature of anomaly diagnosed, as an attempt to offer and guarantee consistent connectivity to wireless users. Being able to properly plan for usage of APs and to quickly and efficiently detect patterns of anomaly in their usages, allows administrators to proactively manage 802.11 networks against performance and connectivity degradations. This is to emphasize the usefulness of our proposed framework to 802.11 administrators in aiding performance and fault management tasks.
To develop our proposed framework, we use a data set collected from the underlying 802.11 environment, namely 802.11 session data collected centrally from the server running RADIUS (Remote Authentication Dial-In User Service) protocol [36]. This is a set of 802.11 traces from the Eduroam hotspot of the Faculty of Engineering of the University of Porto (FEUP). In our 802.11 network access points are configured to monitor associations of individual users in the network, and all association events are recorded in the server running RADIUS authentication protocol. In this way usage activity of individual access points and users extended over seconds, minutes, hours, days, weeks, months, and years is maintained. The collected RADIUS data can therefore be used for different purposes such as realistic 802.11 AP usage modeling and anomaly detection as proposed in this thesis.
In our framework, we investigate different methods of automatic learning from the data and methods for parameter and threshold estimation from the data. We include into our framework: 1) models for characterizing AP usage, 2) methodologies and an algorithm for detecting patterns of anomaly in AP usage, as well as models for characterizing their occurrences in relation to 802.11 network usage - both based on the collected 802.11 AP session data.
For usage modeling: we attempt to derive generative probabilistic models of AP
usage based on daily keep-alive event counts. A keep-alive event is a message sent by a mobile client every 15 minutes for refreshing the client’s association with an AP. Due to their periodic nature, keep-alive statistics give us estimates of the time users stay associated with an AP during which they may generate traffic with different profiles. We decided to model keep-alive event counts given the evidence that user-AP association pattern and event counts are correlated with access duration and traffic at APs [104, 108, 113].
We therefore propose a number of generative statistical models for access point (AP) usage characterization based on daily counts of keep-alive event events and compare them using log-likelihood and Akaike Information Criterion (AIC) values figures of merit. These models include time-independent and time-dependent models for characterizing AP usage i.e., models that consider independency between consecutive usage samples of APs and those that consider dependency in time. The time-independent models investigated are a simple exponential model, a discrete mixture of exponentials, a continuous Gamma mixture of exponentials, and an above-below model that allows thinking about the usage problem in binary terms (i.e. AP usage as either
high or low). The time-dependent models include a table conditional probability distribution model that uses binary variables for predicting the next value of an AP usage given its previous usage samples. We further consider week structure usage samples of AP and evaluate AP usage models: for weekdays, weekends, and individual days of the week (Monday through Sunday). We understand that for any modeling-based efforts to be effective, it is important to assess the performance of the proposed models. With this in mind, we provide cross-validation comparison results of all our models based on log-likelihood and AIC values on specific training and test data sets.
For anomaly detection: we propose a methodology for detecting patterns of AP
usage anomaly and their respective nature from the analysis of AP usage data. We focus on a usage pattern named “abrupt ending” of 802.11 AP connections. Abrupt ending of connections refers to a situation where an 802.11 AP drops all or a significant part of its users’ connections within a one second time window, as seen from RADIUS authentication logs [36]. During abrupt endings, mobile stations typically change association to other APs, and it can take few seconds, minutes, or even hours before an AP starts accepting new connections again. Each time a handoff happens, management frames are exchanged between the station and the target AP, thus keeping the medium busy and preventing other stations from accessing the wireless medium [119, 123, 155]. The need to associate and re-associate, especially during abrupt ending can have significant impact on the users-AP connectivity and traffic performance.
Recognizing potential connectivity disturbance of wireless user connections upon encountering abrupt ending of 802.11 AP connections, in our framework we propose a method for detecting the abrupt ending of AP connections from collected 802.11 AP usage data. We also propose an algorithm for detecting and characterizing abrupt endings into several patterns of AP usage anomaly. We detect AP-related as well as user-related anomalous patterns. The detected AP-related patterns include: 1) interference across AP vicinity, i.e. when neighboring APs encounter abrupt endings in succession within one minute, 2) AP persistent interference, i.e. when a particular AP has encountered abrupt endings repeatedly in one day, 3) AP overload, i.e. when continued user sessions exist after an abrupt ending, meaning the abrupt ending occurred as a result of AP over-utilization by these users, 4) AP halt/crash, i.e. when no single user session/connection existed after abrupt ending during a specified time period, indicating an AP that is not running, and 5) AP interference, i.e. when abrupt ending does not belong to any of the aforementioned patterns. The detected user-related patterns are: 1) user authentication failure, i.e. inability of users to connect to an AP, which is observed when an abrupt ending resulted from a single user; and 2) user intermittent connectivity to AP, i.e. when frequently disconnected user sessions are observed at AP, particularly before and after abrupt ending. We also include in our framework statistical models for characterizing abrupt ending of AP connections occurrence and anomaly-related patterns occurrence in relation to aggregate 802.11 network usage, in terms of total number of sessions. These models include linear regression models and continuous probability models such as Exponential, Gamma, and Gaussian distributions. The proposed models can help 802.11 administrators to estimate
occurrences of abrupt endings and their resulting anomaly-related patterns in the usage of APs of these large-scale 802.11 infrastructures.
1.5 Contributions
The scope of this thesis encompasses two major research thrusts: 1) proposing and evaluating models of 802.11 AP usage applicable to large-scale networks, and 2) investigating patterns of AP usage anomaly and techniques needed to detect and characterize them efficiently. Both 1) and 2) are based on the collected 802.11 AP usage data. The key contributions we make are:
A set of probabilistic models for access point (AP) usage characterization. These include time-independent and time-dependent models for automatic 802.11 AP usage characterizations.
Considering week structure usage samples of APs and proposing AP usage models for weekdays, weekends, and specific individual days (Monday through Sunday). The identification of a new usage pattern named “abrupt ending” of 802.11 AP connections from the analysis of AP usage data. We propose an algorithm for the detection and characterization of different anomaly-related patterns associated to AP abrupt ending, and we also propose statistical models for characterizing their occurrences with respect to aggregate network usage.
The confirmation of the existence of significant statistical relationship between abrupt ending occurrences and aggregate 802.11 network usage, in terms of total number of sessions. We show this relationship is also significant for most anomaly-related patterns we investigate and can be modeled by linear regressions as well as exponential distributions.
The confirmation that abrupt endings and their respective underlying anomaly-related patterns are the general phenomena among the 802.11 deployments we analyzed, and that they are the consequence of interference across the infrastructure, usage pattern behavior of APs, and bugs/misconfigurations of APs, while users and specifics of user devices plays no significant role in their manifestation.
An online implementation of the detection and characterization of abrupt endings and their associated anomaly-related patterns using the Esper complex event driven processing engine.
These contributions can also be found in the following list of our publications:
Massa, D., & Morla, R. (2013). Modeling 802.11 AP Usage through Daily Keep-Alive Event Counts. Wireless networks, 19(5), 1005-1022, [47].
Massa, D., & Morla, R. (2010). Modeling 802.11 AP Usage through Daily Keep-Alive Event Counts. In 16th International Conference on Network-Based
Massa, D., & Morla, R. (2013). Abrupt Ending of 802.11 AP Connections. In
Computers and Communications (ISCC), Symposium on (pp. 000348-000353).
IEEE, [49].
In addition, we have one more paper titled “Detecting and Modeling Patterns of 802.11 AP Abrupt Ending of Connections” submitted to a journal for possible publication at a time of this thesis submission.
1.6 Thesis Structure
In chapter 2 we provide background materials on 802.11 networks. We explain their physical and protocol architectures, their inherent problems and challenges for network management. In chapter 3 we provide survey of the related work pertaining to the problem of usage modeling and anomaly detection in large-scale 802.11 networks. In chapter 4 we present our modeling work of 802.11 AP usage. We evaluate and compare different probabilistic models (time-dependent and time-independent) for characterizing AP usage based on AP daily keep-alive event counts. In chapter 5 we present the first part of our anomaly detection work. We identify a usage pattern named abrupt ending of AP connection from the analysis of 802.11 AP usage data, and we investigate their occurrences and propose models for their characterization. In chapter 6 we present an algorithm for characterizing abrupt endings as one of a set of different forms of anomaly-related patterns in the usage of 802.11 APs, and propose models for characterizing their occurrences with respect to aggregate network usage. We also include an online implementation of the detection and characterization of abrupt endings and their resulting anomaly-related patterns in this chapter. In chapter 7 we provide conclusions and suggest directions for future work.
Chapter 2
Overview of 802.11 Networks
2.1 Network Architecture
A wireless 802.11 network (WLAN or Wi-Fi) is a type of computer network that is designed to offer location-independent network access among various computing devices by means of radio waves rather than a cable infrastructure [1]. In campuses 802.11 networks are typically deployed as the final link connecting the existing backbone wired network to a group of client stations, allowing these users to roam while accessing the full resources and services of the network across buildings or campus. The most obvious motivation and benefit behind these 802.11 deployments is increased nomad behavior. This means wireless 802.11 users are no longer tied to a location. A wireless user can move about freely with their devices from one place to another and access 802.11 networks without the restrictions of connecting to the network backbone. The other benefit includes cost-effective network setup, particularly for locations which are difficult to wire, e.g. older buildings and solid-wall structures. To offer 802.11 wireless services in these areas requires only installation of base stations and antennas, rather than running cables and patching in new Ethernet jacks, while adding users is just a matter of authorization. This can also translate to reduced cost of ownership, particularly in environments which are dynamic in nature that may perhaps require frequent modifications [1].
In 802.11 networks, each device with 802.11 capabilities (whether mobile, portable, or fixed), is referred to as a wireless station. In fact, these wireless stations are of two categories: access points and clients [1]. Wireless Access Points (APs) usually act as base stations to 802.11 networks. They connect wireless clients to the existing wired network and handle any communications between them. Wireless clients are mobile devices equipped with a wireless adapter. These devices include PCs, laptops, PDAs, tablets, and smart phones. Usually, the wireless adapter in the client device communicates with the access point using RF signals. When connection is established, wireless clients can have access to the network and network services just as if they are part of the wired network.
When two or more stations are in communication range and happen to communicate to each other they form a Basic Service Set (BSS) [1]. The smallest possible BSS consists of two stations. A station in the same basic service area can communicate with other members of the BSS. A BSS that is not connected to a base station is called an Independent Basic Service Set (IBSS) or an Ad-Hoc network (figure 2(a)). In an ad-hoc network, stations communicate directly with each other in a peer to peer fashion. There is no base station and thus no device to coordinate
communications. This also implies stations in ad-hoc network cannot connect to any other basic service set. Ad-hoc networks usually involve a few number of stations set up for certain objectives and for a short duration such as in a disaster recovery [2].
When two or more BSS's are interconnected they form an infrastructure network [2]. Infrastructure network uses base stations for all communications, including communication between stations in the same BSS. For communication to be achieved, all stations are required to be within the communication range of the access point. Stations must first associate to the access point in order to use the infrastructure network.
Two or more BSS's can be interconnected using a Distribution System (DS) [1, 2]. DS increases network coverage by linking access points to form an extended, larger network. This means each BSS becomes a component of an extended network, which makes seamless mobility between BSS's easier to achieve. Admission to the DS is via the use of access points, and also data moves between the BSS and the DS with the aid of these access points.
(a) Ad-hoc mode
(b) Infrastructure Mode
Figure 2. Wireless 802.11 network architecture[1]
Creating arbitrarily large and complex networks using BSS's and DS's leads to the next level of hierarchy called the Extended Service Set (ESS) (figure 2(b)). The interesting thing of the ESS is that the entire 802.11 network looks like an independent
basic service set to the Logical Link Control layer (LLC) [2]. This means irrespective of basic service area, stations within the ESS can communicate with each other even when moving between BSS′s.
Distribution system supports the following mobility-related transitions. For example, No-transition: if a station is stationary or is moving only within its own BSS.
BSS-transition: when a station moves between BSS's in the same ESS. ESS transition:
when a station moves between BSS's belonging to different ESS's [3]. However, for a station to use 802.11 networks, it must first associate itself with the BSS infrastructure, typically via an access point. Association events are very dynamic in nature, because stations are always on the move, and are frequently turned on and off. A wireless station can only be associated with one AP at a time [3]. This allows DS to know the identity and the location of access point a station is associated with.
In addition to association, there are two other association-related services supported by DS. When a station moves between BSSs it will switch access point. This service is termed as reassociation [3]. Reassociation is normally initiated by the station, in particular when signal strength indicates different association can be helpful. When reassociation is complete, the DS updates its location records to reflect station reachability via a new access point. Disassociation service is when the existing association between the mobile station and the AP is terminated. This can be triggered by either party. Once disassociation is complete, a disassociated station can no longer send or receive data.
2.2 Protocol Architecture
2.2.1 Data Link Layer
IEEE 802.11 specifications focus on the two lowest layers of the OSI model, incorporating both physical and data link components. Each 802.11 network contains both a MAC and a Physical (PHY) component. The architecture allows multiple physical layers to be developed to support the 802.11 MAC. The MAC layer regulates how to access the medium and send data, while transmission and reception is dealt by the physical layer (PHY).
The data link layer in these 802.11 networks comprises of two sub-layers: Logical Link Control (LLC) and Media Access Control (MAC). 802.11 networks make use of the same 802.2 LLC and 48-bit addressing similar to other 802 LANs, where MAC address is unique. This allows for simple bridging between 802.11 networks and existing IEEE backbone networks. The 802.11 MAC is designed to support multiple competing nodes to share the radio medium [4].
To control access to the transmission media and for collision detection, 802.3 Ethernet LANs employ Carrier Sense Multiple Access with Collision Detection
(CSMA/CD) protocol [4]. In this scheme, a station must first listen to the media before
attempting to transmit, and once a collision is detected, a transmitting station stops its transmission of the frame, transmits a jam signal, and then waits for a random time interval before trying to resend the frame. To detect a collision, a station must have the
ability to both transmit and listen at the same time, which is not the case in 802.11 network environments [5].
Rather than collision detection employed by 802.3 Ethernet (CSMA/CD), 802.11 uses a Carrier Sense Multiple Access with Collision Avoidance (CSMA/CA). The 802.11 standard refers to this scheme as the Distributed Coordination Function (DCF) [5]. CSMA/CA incorporates the use of explicit acknowledgements (ACK) for all transmitted packets. This means an ACK packet is sent by the receiving station to confirm if the data packet has arrived intact. If ACK is not received by the sending station, collision is assumed to have occurred and the data packet is retransmitted after waiting for a random period of time.
Although this explicit ACK mechanism employed by 802.11 systems controls interference and other radio related problem, introduces overhead to 802.11 networks. In this manner, an 802.11 LAN will typically have slower performance in comparison to its Ethernet LAN counterpart.
The hidden node problem is another MAC-layer problem significant to wireless 802.11 networks, when some stations are out of range of other stations or a group of stations (see figure 3). In this case, two stations situated on opposite sides of an access point can both hear activity from a given access point, but not directly from each other, mostly due to a distance or an obstruction [5].
To prevent collision resulting from hidden nodes, 802.11 specifies an optional Request to Send/Clear to Send (RTS/CTS) protocol at the MAC layer [5]. A sending station initiates the process by sending an RTS and waits for CTS reply from the access point. Since the access point is heard by all stations in the vicinity, the CTS cause them to delay any impending transmissions, hence allowing the sending station to transmit and receive a packet acknowledgment without any chance of interference from any hidden nodes. Although RTS/CTS handle the hidden node problem, nevertheless RTS/CTS procedure adds significant overhead to the network by temporarily reserving the medium before any data transmission could commence.
Figure 3. RTS/CTS Procedure [1]
In addition, the 802.11 MAC layer offers two more robustness features named
CRC checksum and packet fragmentation [5]. Each packet has a CRC checksum
hand, packet fragmentation allows for large packets to be broken into smaller units when sent over the wireless channel. This helps to improve reliability when congestion or interference is a factor, because in these situations larger packets stand better chance of being corrupted/dropped than smaller fragments [6]. Fragmentation reduces retransmissions significantly by reducing the amount of data that could be corrupted, which in turn improves overall wireless network performance. The MAC layer in the receiving side is responsible for reassembling fragments, allowing the process to be transparent to higher level protocols.
Moreover, 802.11 MAC specifications provide support for time-bounded data such as voice and video through the Point Coordination Function (PCF) [6]. In PCF mode a single access point controls access to the media, contrary to Distribute Coordination
Function (DCF) where control is distributed to all stations. In PCF mode, access point
polls one station after another for data in a predetermined amount of time. However, a major limitation to PCF is scalability. For an access point to have control of media access and also to poll all associated stations, this can be ineffective for a large-scale network.
2.2.2 Physical Layer
The second major component of 802.11 protocol architecture is the physical layer (PHY). The physical layer essentially provides wireless transmission mechanisms for the MAC, in addition to supporting secondary functions such as evaluating the state of the wireless medium and reporting it to the MAC [7]. The independence between the MAC and PHY has enabled the addition of higher data rates, for example 802.11b (11 Mbit/s), 802.11a (54 Mbit/s), 802.11g (54 Mbit/s) and 802.11n (600 Mbit/s).
The IEEE 802.11 standard originally describes three physical layers: an infrared layer, a frequency-hopping spread-spectrum (FHSS) layer, and a direct-sequence spread-spectrum (DSSS) layer [7]. The original 802.11 wireless standard defines data rates of 1 Mbps and 2 Mbps based on radio waves using frequency hopping spread spectrum (FHSS) or direct sequence spread spectrum (DSSS). FHSS and DSSS are basically different signaling mechanisms that cannot interoperate with each other. With frequency hopping technique, the entire 2.4 GHz band is divided into 75 1-MHz sub-channels. A hopping pattern is agreed between a sender and a receiver, and data is sent over a sequence of the sub-channels [7]. With FHSS in use, each communication takes place in a different hopping pattern within 802.11 systems. The hopping patterns are designed to minimize simultaneous use of the same sub-channel by two senders.
FHSS techniques allow for a fairly simple radio design (only precise timing is required for controlling frequency hops), however, they are limited to speeds of up to 2 Mbps. This limitation is imposed by FCC (Federal Communications Commission, USA) that confines sub-channel bandwidth to 1 MHz. These regulations drive FHSS systems to spread their usage through the entire 2.4 GHz band; meaning they must hop often which results into a high amount of hopping overhead.
The direct sequence signaling technique divides the 2.4 GHz band into 14 22-MHz channels. Adjacent channels may overlap partially. Data can be sent in any one of these 22 MHz channels without needing to hop to other channels.
A technique namely chipping is usually employed to compensate for noise on a specific channel [8]. In this case, each bit of user data is transformed into a series of redundant bit patterns known as chips. The inherent redundancy nature of each chip together with spreading the signal across the available 22 MHz channel offers a form of error checking and correction. Even if it happens that a part of the frequency band is interfered, in most cases data can still be recovered, thereby reducing the need for retransmissions [8].
The most important factor hampering adoption of 802.11 networks is limited throughput. The data-transmission rates specified by the original 802.11 standards are too slow to support most general business requirements. In order to provide support for higher data rates, the IEEE has been rectifying standards from time to time. For example, the 802.11-1997 was the first wireless standard in the family. In terms of acceptance, 802.11b was the first to be accepted broadly and then followed by 802.11a and 802.11g, while presently 802.11n is a latest multi-streaming modulation technique [9].
802.11b and 802.11g make of use of the 2.4 GHz ISM; hence their equipment’s are more susceptible to interference from devices using the same frequency bands such as microwave ovens, cordless telephones, and Bluetooth devices. To control interference, 802.11b and 802.11g equipment use direct-sequence spread spectrum (DSSS) and orthogonal frequency-division multiplexing (OFDM) signaling methods, respectively [10]. 802.11a uses 5 GHz U-NII band that provides at least 23 non-overlapping channels. This is different to the 2.4 GHz ISM frequency band, where adjacent channels are allowed to overlap [10]. Depending on the operating environment, improved or poor performance can be obtained using either higher or lower frequencies (channels). The latest 802.11n has the capability to be enabled in both the 5 GHz mode and 2.4 GHz mode, if there is knowledge about the likelihood of interference from other 802.11 or non-802.11 radio devices operating in the same frequencies. By coupling the MIMO architecture with wider-bandwidth channels allowed 802.11n to have increased transmission speed over 802.11a (5 GHz) and 802.11g (2.4 GHz) [10].
2.3 Challenges of Managing 802.11 Networks
The unique nature of the wireless medium make the management of 802.11 networks very different and more challenging than in the wired network. With wireless systems, the radio waves propagate in space and have to pass through any obstacle, matter, or concrete material that exists in the coverage area e.g. walls, floors, and ceilings. Matter can reflect, scatter, and partially absorb radio waves resulting into weak signal strength and reduced coverage area; the effect can be so severe particularly if the coverage area has lots of metals [11]. Presence of matter in the coverage area can cause dead spots (i.e. areas in which the 802.11 network simply does not work), and RF effects such as hidden terminals.
Another inherent characteristic of the wireless channel is the variation of the channel strength over time and over frequency [4]. As a consequence of the time-varying channel, wireless transmission is often prone to errors. Usually errors on a wireless link occur in long bursts, especially when the node appears to be fading out (i.e. when the received signal strength drops below a certain threshold). In addition to interference caused by broadcast nature of wireless links, where transmission in one link of the 802.11 network interferes with the transmissions in adjacent links, 802.11 wireless transmissions is affected by other radio waves operating in the same frequency range [12, 138]. The interference simply means data rarely makes it through, otherwise requiring lots of retransmissions resulting in overall poor performance.
Central to the problems of 802.11 networks is the association strategy employed by the existing 802.11 architectures, i.e. the method on how to select the best AP to associate to among the available APs. In the existing architecture, the received signal strength is the only criterion used to select an AP for association [13, 126]. This leads to scenarios where some APs in the network have fewer users, while other APs are overloaded with too many users, because their signal strengths as measured by the mobile stations appear to be strong. This can negatively impact stations throughput and overall effective use of the 802.11 network and network services.
Lastly, are the challenges revolving around the unique characteristics of users of 802.11 networks, i.e. evolving nature of their movement and associations to APs. Usually, in these large-scale 802.11 deployments the environment is not static, for example in a campus people and objects constantly move around. In addition to creating obstacles for reflection of 802.11 signals, this behavior is likely to change coverage patterns of APs and their planned capacity [14, 133]. The situation can be particularly problematic when an 802.11 infrastructure becomes densely populated. This means usage requirements for any given AP or physical location are likely to change from time to time. In these circumstances, managing a wireless 802.11 network for high reliability and performance can be a difficult task without efficient and robust models. In fact, this has been an active area of research recently. Examples of existing works that look at the dynamics of users to AP association includes [56-95], association durations at APs [96 - 100], traffic at APs [101 -109], and events counts for APs [48, 49]. All these efforts are attempts to understand the usage patterns behavior of wireless users, APs, location, and 802.11 networks as a whole so that administrators can take timely and proactive management actions when certain 802.11 usage behavior is evident.
Generally speaking, 802.11 networks are never free from problems. At any given moment in time one or more access points and users in the 802.11 infrastructure are likely to encounter problems such as overload, interferences, intermittent connections or authentication failure, and in some cases lack of coverage. To quickly and efficiently detect problems in these infrastructures requires development of automatic diagnostic tools and models.
![Figure 4. Network management system’s architecture [15]](https://thumb-eu.123doks.com/thumbv2/123dok_br/18254625.879658/31.892.222.691.109.462/figure-network-management-system-s-architecture.webp)