333 Bruno Márcio Agostini
Professor
Instituto Federal de Educação, Ciência e Tecnologia do Sudeste de Minas Gerais Campus São João del-Rei
São João del-Rei - Minas Gerais - Brasil [email protected]
Marcílio Sousa da Rocha Freitas Professor-Titular
Universidade Federal de Ouro Preto – UFOP Escola de Minas
Departamento de Engenharia Civil Ouro Preto - Minas Gerais - Brasil [email protected]
Ricardo Azoubel da Mota Silveira Professor-Titular
Universidade Federal de Ouro Preto – UFOP Escola de Minas
Departamento de Engenharia Civil Ouro Preto - Minas Gerais - Brasil [email protected]
Andréa Regina Dias da Silva Professor-Adjunto
Universidade Federal de Ouro Preto – UFOP Escola de Minas
Departamento de Engenharia Civil Ouro Preto - Minas Gerais - Brasil [email protected]
Structural reliability analysis
of steel plane frames
with semi-rigid connections
Abstract
The design codes for structural design traditionally establish the adoption of par-tial safety factors to deal with uncertainties. These standards do not allow one to know the real probabilities of failure of a structure. What is needed, from a practical and sci-entific point of view, is a more consistent approach, based on reliability theory. This ar-ticle addresses an initial attempt at determining the safety levels of structures based on advanced analysis and design with structural reliability theory. In this context, the au-thors consider the effects of the geometric nonlinearity and flexibility of connections in the reliability analysis, which aims at setting a certain displacement as the service limit state. For this purpose, a computer program was written called Structural Reliability Module. This program uses a First Order Reliability Method to analyse reliability. To carry out the structural analysis of steel structures, this study uses the program Compu-tational System for Advanced Structural Analysis. Validating the Structural Reliability Module involved comparing the results from other authors with those generated by the program. Results for the structures under study indicate the efficiency of the imple-mented measures. Results suggest that, when a certain displacement is set as a service limit state, the reliability of the structures under analysis are only slightly influenced by geometric nonlinearity but considerably so by semi-rigid connections.
Keywords: reliability analysis, steel plane frames, geometric nonlinearity, semi-rigid connections.
http://dx.doi.org/10.1590/0370-44672017710044
Civil Engineering
Engenharia Civil
1. Introduction
This article presents the joint compu-tational implementation of theories related to structural reliability and the advanced analysis of structures used by Agostini (2014). This research is the first step in an attempt to evaluate the structural safety of steel portal frames designed with
ad-vanced analysis.
Agostini (2014) aimed at developing a computational program that could pro-vide an analysis of the structural reliability integrated into the structural analysis of steel portal frames. Reliability analysis was carried out with the First Order
Re-liability Method (FORM) method. The structural advanced analysis was carried out with the program Computational System for Advanced Structural Analysis (CS-ASA) (Silva, 2009) considering the nonlinear geometric behavior and the flex-ibility of beam-to-column connections.
2. Computational development and implementation
To create the Structural Reliability Module (SRM) computational program, researchers used the Fortran 95 program-ming language in the Microsoft Visual Studio 2010 environment (Microsoft
Cor-poration, 2010). SRM was designed to be integrated with the mathematical and statistical routines of the numeric library for Fortran, the IMSL™ version 6.0 (Visual Numerics®, 2006), as well as the CS-ASA
structural analysis program version devel-oped by Silva (2009).
334
different types of portal frames. The condi-tion for not fulfilling a certain service limit state is linked to a specific displacement.
The FORM method, present in SRM, requires the calculation of gradients of the performance function for all random vari-ables. SRM uses a central finite difference process for calculating gradients of the per-formance function. This process consists of changing the value of each random variable by a small increase and decrease. For each increase and decrease, a call to the CS-ASA finite element program for the displacement supply occurs. With the calculated displace-ment (cd) for the node and direction under analysis as well as the fixed displacement limit (dl), the performance function G(u)=1-(cd/dl) is evaluated. In the SRM, the perfor-mance function was allocated in a specific subroutine. The two results of the evaluation of the performance function, generated from the increase and decrease in the value of the random variable, will enable the calculation of the performance function gradient for the random variable in question. This entire process is performed for all the random variables present in the reliability analysis to compose the gradient vector of each iteration of the FORM method.
The proposed implementation al-lows one to consider, as random variables, one elastic modulus, two transverse cross-section areas, two moments of inertia, three dead loads, and five live loads. To model these variables, one implements the follow-ing probability distributions: normal, log-normal, and type I extreme (largest value). For the latter two, two subroutines were created with a specific link to the reliability module and aim at calculating the mean and the standard deviation equivalent to a normal distribution.
To transform the variables, a Nataf transformation (Melchers, 1999) was used and, to determine the design point in reduced space, the HLRF algorithm was used (Hasofer and Lind, 1974; Rackwitz and Fissler, 1978). Equations to determine the sensitivity indices and the importance
factors, as shown by Sagrilo (2004), were also implemented in the SRM. To integrate the SRM with the IMSL™ library (Visual Numerics®, 2006), it was necessary to make
adjustments in the project developed on the Microsoft Visual Studio 2010 environment (Microsoft Corporation, 2010), following the orientations available on the Intel®
web-site (Intel® Developer Zone, 2011).
The process of reliability analysis follows the original structure from the CS-ASA program. This program works with three input files. The first input file contains general information such as the type of analysis, coordinates, loads, properties of materials and sections. The second contains the parameters related to the nonlinear so-lution strategy. And, the third, refers to the dynamic analysis, which is not approached herein. A fourth input file was created to carry out the reliability analysis. Readings of this file can only be carried out by SRM. The first parameters that make up the fourth input file are as follows: reliability analysis method, number of iterations for FORM, tolerance for interruption of the iterative process involving the FORM method, displacement limit for the node in analysis, numerical parameter of finite differences for carrying out an increase and a decrease on the value of each random variable, and the indicator of correlated variables. In explana-tion, for the actual version of SRM, it is not possible to consider the correlation between variables. After those parameters and in the same line for each random variable: type of random variable, mean, and standard devia-tion values. Integrating the CS-ASA output files, there was created a specific output file that shows both the input file parameters related to the reliability analysis and the results of this analysis.
The reliability analysis starts, from the CS-ASA program, with readings on the first input file. The SRM is activated as soon as a reliability analysis option is found in this file. If the reliability analysis is not defined, reading of file with general information goes on normally to carry out one of the
types of analysis that make up CS-ASA. Managing the analysis process, SRM calls upon two subroutines which belong to the CS-ASA program. Firstly, the subroutine responsible for assembling the vector of nodal loads. Secondly, the subroutine that is responsible for producing the linear or nonlinear solution of the structure under analysis, providing the structural response in terms of displacements.
Besides taking the geometric nonlin-earity into account, researchers enhanced the SRM with a functionality that enables it to carry out reliability analysis in structures with semi-rigid connections that display lin-ear or nonlinlin-ear moment-rotation behavior. To do this, this study adjusted the Richard and Abbott, (1975) model, already imple-mented in the CS-ASA program, to carry out reliability analyses of structures that show a nonlinear moment-rotation behav-ior. The choice to adjust this model is due to the availability of results by Haldar and Mahadevan, (2000) related to the Richard and Abbott, (1975) model. Also, as affirmed by Pinheiro (2003), this model always offers a positive rigidity, is computationally effec-tive, and is one of the most used to represent semi-rigid connections. To carry out the reliability analysis considering the connec-tions present in the structure as semi-rigid, but with linear moment-rotation behavior, the input file with general information is edited so as to indicate the initial rigidity (Sc) of the connection.
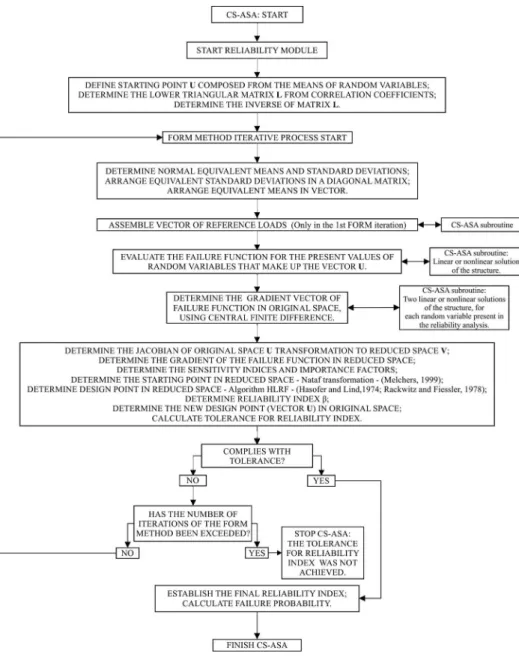
The flow chart in Figure 1 indicates CS-ASA with new functionality in the dotted box, reliability analysis. Interac-tion between static reliability analyses, denoted in Figure 1 by a double-headed arrow, occurs with a command from the SRM and aims at providing a structural response in terms of displacement. The dotted boxes in Figure 1 - labeled “geo-metric nonlinearity” and “rigidity of connections” - indicate the possibility of considering these effects when calculating displacement. Figure 2 presents the flow chart for SRM.
Figure 1
New functionality
335
Figure 2 Flow chart for SRM.
3. Results
Two examples analyzed by Haldar and Mahadevan, (2000) were used to compare with the methodology developed in the previous section. Among the main considerations regarding the geometric nonlinear analysis are the following: adoption of second order formulation
SOF-2 (Silva, 2009) defined in an updated Lagrangian referential and based on the Yang and Kuo, (1994) formulation and Euler-Bernoulli theory, use of a constant load increment strategy, use of constant load iteration strategy, determination of the initial increment in load parameter at
10% of the total load, division of load-ing into 10 increments, and adoption of Newton-Raphson standard method. It should be noted that the validation of the SRM was done by comparing it with data provided by Agostini and Freitas, (2011) and Haldar and Mahadevan, (2000).
Example 1: Plane frame with three elements
The first structure that was analyzed is represented in Figure 3. Statistical prop-erties of random variables considered in the analysis of that structure are described
in Table 1. As regards the present example, structural reliability analysis was carried out considering the geometric nonlinearity and the presence of semi-rigid connections
in the joints between columns and beam. The limit state in question refers to the horizontal displacement of Node 2, lim-ited to 0.0114m in service.
336
Variables Units Nominal values Mean /Nominal value Coefficient of variation Type of distribution
E MPa 199,948.04 1.00 0.06 Lognormal
A m2 0.01271 1.00 0.05 Lognormal
I m4 0.0003970848 1.00 0.05 Lognormal
D (Dead load) kN/m 43.78 1.05 0.10 Lognormal
L (Live load) kN/m 16.05 1.00 0.25 Extreme Type I
W (Wind load) kN 28.91 0.78 0.37 Extreme Type I Table 1
Statistical properties of random variables.
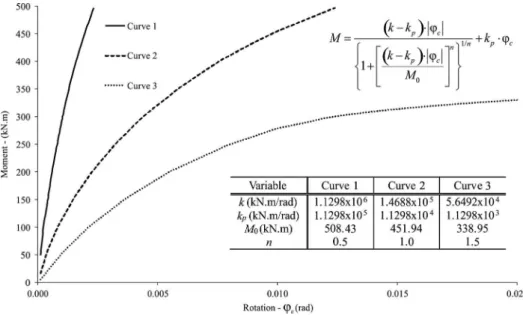
As for the portal frame in Example 1, represented by the structure shown in Figure 3, three different connecting behaviors were simultaneously analyzed for Nodes 2 and 3. These analyses took into account the nonlinear behavior of the connection using the Richard and Abbott, (1975) mathematical model. The model
comprises the following parameters: initial stiffness (k), strain-hardening stiffness (kp), reference moment (M0), and a parameter defining the shape of the curve (n). Figure 4 shows the values of the four parameters for all three analyzed cases; the values were inserted into the analysis as non-random. Haldar and Mahadevan, (2000) analyzed
the reliability considering also the random behavior of the parameters that make up the Richard and Abbott, (1975) model. In order to better visualize the behavior of the connections under analysis, moment (M)-rotation (φc) curves 1, 2, and 3 -
indi-cated in Figure 4 - were generated using the equation presented in the figure.
Figure 4
Moment-rotation curves of semi-rigid connections.
Table 2 presents, for curves 1 to 3, the results from Agostini (2014) on the reliability analysis carried out considering the presence of semi-rigid
connections in the structure. Table 3 presents the comparison between the results of the reliability index β given by Agostini (2014) and those given
by Haldar and Mahadevan, (2000) considering the presence of semi-rigid connections.
Table 2
Results considering the presence of semi-rigid connections.
Variable
Curve 1 Curve 2 Curve 3 Sensitivity
index
Initial value of variable
Final value of variable
Sensitivity index
Initial value of variable
Final value of variable
Sensitivity index
Initial value of variable
Final value of variable E -0.1960 199,948.04 188,354.23 -0.1792 199,948.04 189,840.12 -0.1630 199,948.04 191,314.86 A -0.0047417 0.01271 0.01268 -0.0042829 0.01271 0.01268 -0.003646 0.01271 0.01268
I -0.1587 0.0003970848 0,0003813867 -0.1451 0.0003970848 0.0003834094 -0.1322 0.0003970848 0.0003853952 D 0.009346 45.97 45.95 0.012188 45.97 46.00 0.011894 45.97 45.98 L 0.00814 16.05 15.54 0.010107 16.05 15.56 0.009421 16.05 15.54 W 0.9676 22.55 109.21 0.9729 22.55 101.81 0.9776 22.55 92.84 Performance function - 0.7987 -0.000115 - 0.7829 -0.0000456 - 0.7618 -0.0000155
337
β Rigid connection (nonlinear analysis) β1 (Curve 1) β2 (Curve 2) β3 (Curve 3)
Haldar and Mahadevan, (2000)
Present work
Haldar and Mahadevan, (2000)
Present work
Haldar and Mahadevan, (2000)
Present work
Haldar and Mahadevan, (2000)
Present work
β (Node 2 horizontal displacement) 5.47 5.03 5.17 4.93 4.47 4.66 4.06 4.33
Table 3
Values for β according to Haldar and Mahadevan, (2000) and present work.
Example 2: Plane frame with eleven elements
The second example, shown in Fig-ure 5, consists of a frame with an asym-metric arrangement of its elements. For the actual example, the presence of semi-rigid connections was not taken into account. Statistical properties of the variables related to the structure in question are
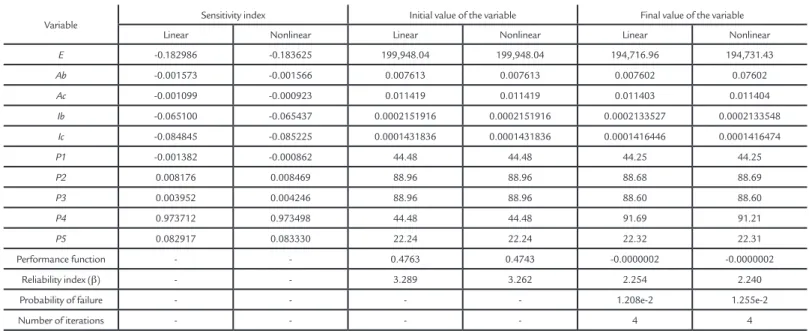
in-dicated in Table 4, in which the sub-indices “b” and “c”, alongside the area and mo-ment of inertia variables, stand for beam and column. The horizontal displacement of Node 1 was limited to 0.0254m, thus representing the service limit state. Table 5 presents the results of the reliability
analy-sis carried out for the structure in Example 2, based both on linear and nonlinear analysis. Table 6 presents a summary of the reliability indexes β determined by linear and geometric nonlinear analyses, including values obtained by Haldar and Mahadevan, (2000).
Figure 5 Plane frame with eleven elements: geometry, loads and discretization.
Variable Unit Mean Coefficient of variation Type of distribution
E MPa 199,948.04 0.06 Lognormal
Ab m2 0.007613 0.05 Lognormal
Ac m2 0.011419 0.05 Lognormal
Ib m4 0.0002151916 0.05 Lognormal
Ic m4 0.0001431836 0.05 Lognormal
P1(Dead load) kN 44.48 0.10 Lognormal
P2(Dead load) kN 88.96 0.10 Lognormal
P3(Dead load) kN 88.96 0.10 Lognormal
P4(Wind load) kN 44.48 0.37 Extreme Type I
P5(Wind load) kN 22.24 0.37 Extreme Type I
Table 4 Statistical properties of random variables.
Variable Sensitivity index Initial value of the variable Final value of the variable Linear Nonlinear Linear Nonlinear Linear Nonlinear
E -0.182986 -0.183625 199,948.04 199,948.04 194,716.96 194,731.43
Ab -0.001573 -0.001566 0.007613 0.007613 0.007602 0.07602
Ac -0.001099 -0.000923 0.011419 0.011419 0.011403 0.011404
Ib -0.065100 -0.065437 0.0002151916 0.0002151916 0.0002133527 0.0002133548
Ic -0.084845 -0.085225 0.0001431836 0.0001431836 0.0001416446 0.0001416474
P1 -0.001382 -0.000862 44.48 44.48 44.25 44.25
P2 0.008176 0.008469 88.96 88.96 88.68 88.69
P3 0.003952 0.004246 88.96 88.96 88.60 88.60
P4 0.973712 0.973498 44.48 44.48 91.69 91.21
P5 0.082917 0.083330 22.24 22.24 22.32 22.31 Performance function - - 0.4763 0.4743 -0.0000002 -0.0000002
Reliability index (β) - - 3.289 3.262 2.254 2.240 Probability of failure - - - - 1.208e-2 1.255e-2 Number of iterations - - - - 4 4
Table 5
338
Table 6
Values for β obtained by Haldar and Mahadevan, (2000) and by present work.
β (linear analysis) β (geometric nonlinear analysis) Haldar and Mahadevan, (2000) Present work Haldar and Mahadevan, (2000) Present work
β (Node 1 horizontal displacement) 2.283 2.254 2.274 2.240
4. Discussion
Comparing the results of Example 1 - presented in Tables 2 and 3 - it can be seen that the presence of semi-rigid connections resulted in a decrease in the reliability index, when the behavior of semi-rigid connections of nodes 2 and 3 goes from more stiff to less stiff. This decrease in the value of the reli-ability index β were also detected by Haldar and Mahadevan, (2000). These authors considered the idealization of connections as perfectly pinned or stiff as inadequate and suggested a careful investigation, even for the serviceability limit state, in frames modelled with
semi-rigid connections. Hadianfard and Razani’s, (2003) reliability analy-sis also showed results that indicated substantial differences in behavior of structures modelled with semi-rigid connections compared to those modelled with ideally pinned or rigid connections. Hadianfard and Razani, (2003) stated that to achieve more reli-able results, it is necessary to consider the semi-rigid behavior of connections in the reliability analysis.
By comparing the results in Ex-ample 2, shown in Table 6, with those determined by Haldar and Mahadevan,
(2000), one is able to notice an agree-ment between values. Results shown in Tables 5 and 6 indicate mainly that the consideration of the geometric nonlin-earity did not result in great differences in the reliability index, sensitivity indi-ces or final values of the variables. How-ever, a small decrease in the reliability index β can be noticed. One noted that, for the incident loading, the properties of the material and the geometric char-acteristics of the structure in Example 2 show only small manifestations of the effects of geometric nonlinearity in the limit state under study.
5. Conclusions
This study was carried out to un-derstand the influence of the effects of geometric nonlinearity and of semi-rigid connections on the reliability of steel plane frames. The results indicate the efficiency of the proposed implementation. The
reliability analyses involved the service limit state and provided evidence of a slight decrease in reliability index β when including the effects of geometric nonlin-earity. When semi-rigid connections were considered, the result was a considerable
decrease in the value of reliability index β
as the stiffness of connections decreased. These results suggest the need to take the semi-rigid behavior of connections into account when carrying out reliability analyses of steel plane frames.
Acknowledgements
This work was supported by the Federal University of Ouro Preto, the IF
Sudeste MG at São João del-Rei, CNPq and FAPEMIG.
References
AGOSTINI, B.M. Análise de confiabilidade estrutural de pórticos metálicos planos
com ligações semirrígidas. Ouro Preto: Universidade Federal de Ouro Preto, 2014.
121 p. (Tese de Doutorado em Engenharia Civil).
AGOSTINI, B.M., FREITAS, M.S.R. Procedimento para avaliação da confiabilidade estrutural de pórticos planos. In: IBERIAN LATIN AMERICAN CONGRESS ON COMPUTATIONAL METHODS IN ENGINEERING, 32. Ouro Preto. Abstracts… Ouro Preto: ABMEC, 2011. p. 210-210.
HADIANFARD, M.A., RAZANI, R. Effects of semi-rigid behavior of connections in the reliability of steel frames. Structural Safety, v. 25, p. 123-138, 2003.
HALDAR, A., MAHADEVAN, S. Reliability assessment using stochastic finite
element analysis. England: John Wiley & Sons, 2000.
HASOFER, A.M., LIND, N.C. An exact and invariant first-order reliability format.
Journal of Engineering Mechanics, v. 100, p. 111-121, feb. 1974.
INTEL® DEVELOPER ZONE. Santa Clara, c2011. Installing and using the IMSL
libraries. Available in: <https://software.intel.com/en-us/articles/installing-and--using-the-imsl-libraries>. Access in: 6 sep. 2014.
MELCHERS, R.E. Structural reliability analysis and prediction. (2ed.). England: John Wiley & Sons, 1999. 431p.
339
RTMRrel. [S.l.]: Microsoft Corporation, 2010.
PINHEIRO, L. Análises não-lineares de sistemas estruturais metálicos rotulados
e semirrígidos. Ouro Preto: Universidade Federal de Ouro Preto, 2003. 245 p.
(Dissertação de Mestrado em Engenharia Civil).
RACKWITZ, R., FIESSLER, B. Structural reliability under combined random load sequences. Computers & Structures, v. 9, n. 5, p. 489-494, nov. 1978.
RICHARD, R.M., ABBOTT, B.J. Versatile elastic-plastic stress-strain formula.
Journal of the Engineering Mechanics Division, v. 101, n. 4, p. 511-515, 1975.
SAGRILO, L.V.S. Confiabilidade estrutural. Rio de Janeiro: COPPE-UFRJ. 2004. (Notas de Aula).
SILVA, A.R.D. Sistema computacional para análise avançada estática e dinâmica
de estruturas metálicas. Ouro Preto: Universidade Federal de Ouro Preto, 2009.
322 p. (Tese de Doutorado em Engenharia Civil).
VISUAL NUMERICS®. IMSL™ Fortran Numerical Library. Version 6.0. [S.l.]: Visual
Numerics®, 2006.
YANG, Y.B., KUO, S.R. Theory & analysis of nonlinear framed structures.
Singapore: Prentice Hall, 1994.