DATA ACQUISITION STRATEGIES FOR ASTER GLOBAL DEM GENERATION
M. Urai a, c *, T. Tachikawa b, H. Fujisada c a
Geological Survey of Japan, AIST, 1-1-1 Higashi, Tsukuba, Ibaraki, 305-8567 Japan - [email protected] b
Japan Space Systems, The Kikai Shinko Kaikan Bldg. 6F, 3-5-8 Shibakoen, Minato-ku, Tokyo 105-0011 Japan - [email protected]
c
Sensor Information Laboratory Corp., 3-14-17 Azuma, Tsukuba, Ibaraki, 305-0031 Japan - [email protected]
Commission IV, WG IV/6
KEY WORDS: DEM/DTM, Land, ASTER, scheduling, statistics, cloud cover
ABSTRACT:
The ASTER Global DEM (GDEM) version 1, is a global digital elevation model with one arc-second grid, generated using the ASTER stereo image archive 2000 to August 2008, and was released on June 29, 2009. The GDEM-1 had some bad elevation data. The most simple and effective way to reduce bad elevation data in the GDEM-1 is to add new ASTER observation data and re-generate the GDEM. An ASTER Data Acquisition Request was defined, based on the number of good pixels and the number of observations at each observation area, for the GDEM version 2 that was released on October 17, 2011. Using more input data and an improved algorithm, GDEM version 2 reduced the amount of the bad pixel by 4.5% to 7.5% and increased the amount of good tiles by 10.7% to 54.3% over the GDEM-1, except for Antarctica. Another ASTER data set is being collected for GDEM version 3, scheduled for 2013. The ASTER data collection scheme, however, has some constraints. This study sought for techniques to optimize the GDEM data collection balancing the overall ASTER operations and reduction of bad pixels in the GDEM data.
* Corresponding author.
1. INTRODUCTION
The Shuttle Radar Topography Mission (SRTM) is the first high resolution global digital elevation model (DEM) with a grid interval of one arc-second (Slater et. al., 2006). SRTM, however, covered only land area between 56° south and 60° north latitude and had many voids mainly in mountainous areas. The ASTER global digital elevation model (ASTER GDEM) version 1, is a high resolution global DEM with a grid interval of one arc-second generated using ASTER stereo image archive 2000 to August 2008 (Fujisada et. al., 2012), and was released in June 29, 2009 at ERSDAC (2011) and USGS LPDAAC (2011). ASTER GDEM-1, however, was not perfect. Stacking and filtering to reduce bad elevation data were discussed in a paper by Fujisada et. al. (2012). The most simple and effective way to reduce bad elevation data in the GDEM is to add new observation data and re-generate it. ASTER data is collected based on data acquisition request (DAR). Creation of the DAR for wide spread targets is time consuming and costly if it is done manually. Furthermore, the acquisition request should be defined to not interfere with efficient ASTER observation and well balanced with other ASTER science objectives (Yamaguchi et. al, 1998). In general, DEM quality is assessed with reference elevation data but there are no reference elevation data that cover the entire GDEM. It is difficult to indentify bad elevation data in the GDEM without any reference. ASTER GDEM can provide the number of valid elevation data (the number of stacks) and the number of observations for every one arc-second resolution. The ASTER GDEM data quality can be evaluated with the number of stacked pixels if there is no good reference.
A set of data acquisition requests for ASTER GDEM version 2 was created to reduce bad elevation data in it. Taking into account the number of stacks and the number of ASTER
observations, the ASTER GDEM-2 DARs were generated automatically. ASTER data collected from September 2008 to August 2010 based on the GDEM-2 DAR was added to the ASTER stereo image archive. The ASTER GDEM-2, using the archived 2000 to August 2010 data, was released on October 17, 2011 in the same format as the GDEM-1.
This paper discusses how to identify the bad pixels and how to define a DAR that is optimal for GDEM generation and ASTER observation operations. The DAR strategy was evaluated by comparing the bad pixels in the ASTER GDEM versions 1 and 2. Antarctica was excluded from the bad pixel analysis and the DAR strategy in this study. The high resolution DEM for Antarctica is important but image matching in inland Antarctica is difficult because of featureless snow fields.
2. DATA QUALITY OF GDEM VERSION 1
The GDEM tiles are created by stacking all observed scene DEM data matched geographically to the tile container; abnormal elevation data are removed and the valid elevation data for the pixels are averaged as the elevation data for the tile (Fujisada et. al., 2012). The ASTER GDEM consists of elevation data in a *_dem.tif file and quality assessment (QA) data in a *_num.tif file. The QA data provides the number of stacks (the number of valid elevation data) at each pixel of the tile. The valid elevation data is filtered using the median-based selection method. It means the smaller stack number, the poorer the elevation data quality (Fujisada et. al., 2012).
Most of bad elevation data had their stack number two or less. In our strategy a pixel with two or less stacks was defined as a “bad” pixel. It is necessary to reduce number of bad pixels to increase GDEM quality. The overall bad pixel rate of the
ISPRS Annals of the Photogrammetry, Remote Sensing and Spatial Information Sciences, Volume I-4, 2012 XXII ISPRS Congress, 25 August – 01 September 2012, Melbourne, Australia
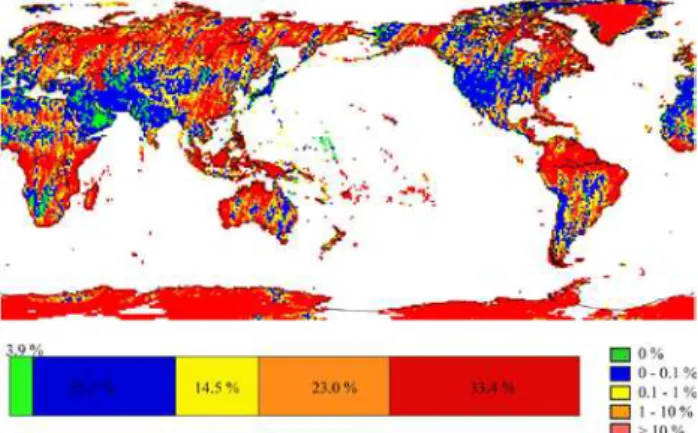
ASTER GDEM version 1 was 12.0%. The map in Figure 1 shows the distribution of the bad pixel rate of GDEM version 1. High bad pixel rates were found in high latitude areas (60N~ and 60S~) especially in Greenland, Antarctica and northern Eurasia because of snow and cloud. High bad pixel rates are found in tropical areas (10S ~ 10N) especially in central Africa, Indonesia and southern South America because of cloudy scenes. The chart in the figure 1 shows the statistics of bad pixel rates within a tile (an area with one degree latitude by one degree longitude). If the good tile is defined as a tile that has less than 1% bad pixels, 43.5% of ASTER GDEM-1 was good tiles (Figure 1). Some of the bad pixels were replaced with existing high resolution DEM data such as SRTM, Alaskan DEM and Canadian DEM during the post-processing of the GDEM-1 generation (Fujisada et. al., 2012). The number of stacks in the QA file (*_num.tif) attached to the GDEM-1 was changed to a minus value if the pixel was replaced with the existing high resolution DEM. In this study, the original QA data before the processing was used to avoid post-processing effects.
Figure 1. Tile based bad pixel rate distribution and statistics of ASTER GDEM version 1 except for Antarctica
3. GENARATION OF ASTER DATA AQUISITION REQUESTS FOR GDEM VERSION 2 TO REDUCE BAD
PIXELS
An ASTER Data Acquisition Request (DAR) consists of an Area of Interest (AOI), priority, gain settings, lifetime and other parameters. The DAR should be defined for efficient ASTER observations and well balanced with other ASTER science objectives (Yamaguchi et. al, 1998). The total number of DAR for all ASTER observations is limited to 20,000 because of the scheduling capacity of the ASTER Ground Data System. About 10,000 DARs were already used, leaving about 10,000 DARs available. ASTER swath is 60km. We focused on the remaining DAR resource and the ASTER swath to define the GDEM DAR.
3.1 AOI consideration
Assuming pixels for observation are evenly distributed in an area of interest, a smaller AOI is preferable to exclude uninteresting pixels and to reduce impact on other ASTER observations. The bigger AOI is preferable, however, to reduce the number of DAR. Given that ASTER’s swath is 60km, an AOI narrower than 60km has little benefit in excluding uninteresting pixels and reducing conflicts with other observations. An AOI of 60km or narrower can be observed in one pass. For these reasons, our AOI for ASTER GDEM-2 was defined as a 0.5 degree by 0.5 degree square. 0.5 degrees is
approximately 56km over the equator. Consolidating adjacent AOIs help reduce the number of DARs. For GDEM-2 DAR, AOIs were consolidated if they could without changing the total size (area) of AOIs. As long as the total size of AOI was the same, AOI consolidation should have no adverse effect on the ASTER observation.
3.2 Consideration for number of observation
In the ASTER GDEM-1 each pixel was observed 15.7 times on average. Bad pixel rate in a more observed area meant that probability of getting good elevation data out of a pixel in the AOI was low and that more observations would be required to obtain valid elevation data. In other area that have not been observed many times, a good data acquisition strategy is required to get a valid elevation data. For GDEM-2 DAR we decided to focus on areas of high bad pixel rate and a less than 5 observations.
3.3 Consideration for gain settings and observation time windows
Gain setting of ASTER band 3N and 3B, which are used to produce along-track stereo pair images, was set to Normal that is preferable for DEM generation. Other gain settings except for bands 3N and 3B, and the observation time windows (seasonality) were set the same as that for Global Mapping DAR (Yamaguchi et. al., 1998), which has optimal gain and observation time window for the local land surface. Observation priority increases in ASTER operations when multiple observation requests are issued for the same area with same gain settings and observation time windows.
3.4 Consideration for bad AOI
It is ideal that each tile has no bad pixels but only 3.9% of GDEM-1 tiles were free of bad pixels (Figure 1). In this study, we evaluated the bad pixel rate in the 0.5 degree x 0.5 degree AOI. If the bad pixel rate threshold is 10%, approximately 30% of AOI become bad AOI; if the threshold is 1%, about 50% of AOI are considered bad AOI (Figure 1). The threshold must be carefully set since the amount of “bad AOI” in the current GDEM translates to the amount AOIs in the next GDEM DAR and has in turn a significant impact on the overall ASTER observation activities.
3.5 Data acquisition request for GDEM version 2
Final ASTER data acquisition request ware generated and submitted (Figure 2) base on following criteria.
1) AOI with 1+% bad pixel rate (bad AOI).
2) The number of observations of an AOI is less than “N”.
5 was chosen for the threshold of the number of successful observations (“N”) because it would not have a great impact on the ASTER primary science objective (Yamaguchi et. al., 1998) and yet the number of GDEM-2 DAR will remain below 10,000. To control the number of DARs, adjacent AOIs were consolidated to create larger AOIs. For GDEM-2 the total number of DAR was 3,517, the total number of AOI was 9,740, and the total area of AOIs was 22x106
km2. The observation data based on the GDEM-2 DAR was collected from December 2008 to October 2011. The GDEM-2 DAR was about 10% of the total ASTER DAR but other ASTER data acquired for non-GDEM DAR was leveraged to reduce bad pixels in the non- GDEM-2.
ISPRS Annals of the Photogrammetry, Remote Sensing and Spatial Information Sciences, Volume I-4, 2012 XXII ISPRS Congress, 25 August – 01 September 2012, Melbourne, Australia
Figure 2. ASRER data acquisition requests to decrease bad pixel for GDEM version 2
4. DATA QUALITY OF GDEM VERSION 2
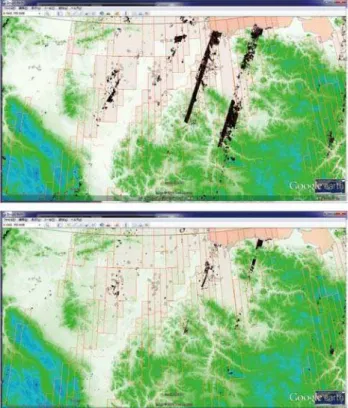
The GDEM-2 data quality was assessed in the same way as version 1. The bad pixel rate of GDEM-2 was reduced by 4.5% to 7.5% from the version 1 and good tiles were increased by 10.7% to 54.3% (Figure 3). This means the data acquisition focused on bad AOI in the GDEM-1 resulted in a drastic reduction of bad pixels. The average number of observations was 17.9 for GDEM version 2 from, an increase of 2.2 during the GDEM-2 DAR lifetime from September 2008 to August 2010. The map in the figure 3 shows the distribution of the bad pixel rate from the GDEM-2. The bad pixel rate improved compared with GDEM-1 especially in northern Eurasia, eastern Australia and others. Figure 4 shows GDEM-1 image with the data of GDEM-2 DAR AOI applied to north-eastern Russia. Most bad elevation data (black areas) were transformed to good data as shown in the lower map (Figure 4). Bad pixel rates are, however, still high in Greenland, Antarctica and tropical area (the map, Figure 3). Image matching errors frequently occurred in inland Antarctica because of the featureless snow fields. Antarctica was excluded for the bad pixel analysis and the DAR generation in this study.
Figure 3. Tile based bad pixel rate distribution and statistics of ASTER GDEM version 2 except for Antarctica
5. GENERATION OF ASTER DATA AQUISITION REQUESTS FOR GDEM VERSION 3 FOR FURTHER
REDUCTION OF BAD PIXELS
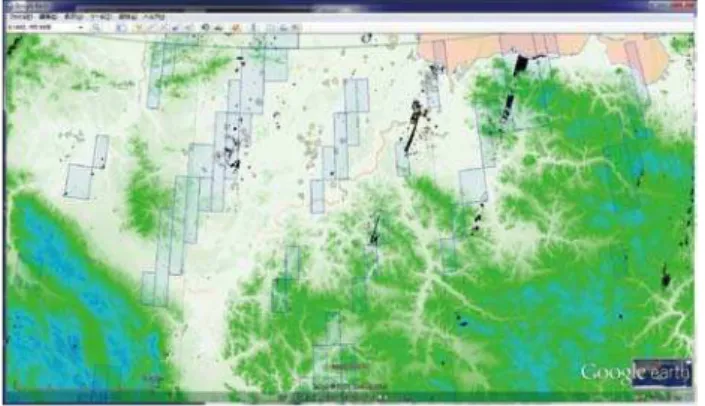
The GDEM version 3 is scheduled for 2013, and another set of DARs was generated to further reduce bad pixels in GDEM version 2 (Figure 5). This DAR focuses on the remaining bad
pixels in the GDEM-2 (Figure 6). For the number of observations “N”, the threshold value was set as ten. Even at 10, these DARs would have little impact on the primary science objective of the ASTER (Yamaguchi et. al., 1998) and should be within the remaining DAR allocation. The observation threshold was the only parameter changed from the GDEM-2 DAR. For GDEM-3, the total number of DAR was 1,988, the total number of AOI was 2,823, and the total area of AOIs was 5x10⁶ km2. Data collection based on the GDEM-3 DAR started in July 2011.
Figure 4. Example of GDEM image (north-eastern Russia) with the AOIs of data acquisition requests
Black areas indicate bad pixels, upper : GDEM version 1 image with the AOIs (red rectangles) of data acquisition requests for
GDEM version 2, lower : GDEM version 2 image with the AOIs (red rectangles) in the GDEM-2 DAR
Figure 5. ASTER GDEM-3 DAR aiming at further reduction of bad pixels
ISPRS Annals of the Photogrammetry, Remote Sensing and Spatial Information Sciences, Volume I-4, 2012 XXII ISPRS Congress, 25 August – 01 September 2012, Melbourne, Australia
Figure 6. Example of GDEM version 2 image (north-eastern Russia) with the AOIs (blue rectangles) in GDEM-3 DAR
6. CONCLUSIONS
The number of stacks and the number of observations were taken into consideration in the GDEM-2 DAR. The GDEM version 2, with additional two-year worth of data based on the GDEM-2 DAR, improved the bad pixel rate by 4.5% to 7.5% and the good tiles increased 10.7% to 54.3% from version 1. The number of observations on average increased by 2.2 to 17.9. The total number of GDEM-2 DAR was 3,517, well under the 10,000 limit. No other science missions were sacrificed by the ASTER GDEM-2 DAR. The DAR strategy for the GDEM-2 was successful.
GDEM-3 is scheduled for 2013, and data collection with a new DAR parameter is undergoing. The Terra satellite carrying ASTER on it has enough fuel to extend its operation until 2017. Newer better data can further refine the ASTER Global Digital Elevation Model. ASTER has its weakness in high latitude areas such as Greenland and Antarctica. This challenge can be overcome by merging other high-resolution high-quality global digital elevation models with the ASTER DEM.
Acknowledgements
The authors would like to thank the ASTER Science Team members, especially Michael Abrams, Yasushi Yamaguchi and Masaru Fujita for their useful discussion, and Mickie Grace for proofreading.
References
ERSDAC, 2011. “ASTER Global Digital Elevation Model (ASTER GDEM)”, Tokyo, Japan.
http://www.ersdac.or.jp/GDEM/E/index.html (28 Dec. 2011).
Fujisada, H., Urai, M. and Iwasaki, A., 2012. Technical Methodology for ASTER Global DEM. IEEE Transactions on Geoscience and Remote Sensing, submitted.
Slater, J.A. et al., 2006. The SRTM data" finishing" process and products. Photogrammetric Engineering and Remote Sensing, 72(3): 237-247.
USGS LPDAAC, 2011. “Global Data Explorer”, Sioux Falls, South Dakota, USA.
http://demex.cr.usgs.gov/DEMEX/ (28 Dec. 2011).
Yamaguchi, Y., Kahle, A.B., Tsu, H., Kawakami, T. and Pniel, M., 1998. Overview of Advanced Spaceborne Thermal
Emission and Reflection Radiometer (ASTER). IEEE Transactions on Geoscience and Remote Sensing, 36(4): 1062-1071.
ISPRS Annals of the Photogrammetry, Remote Sensing and Spatial Information Sciences, Volume I-4, 2012 XXII ISPRS Congress, 25 August – 01 September 2012, Melbourne, Australia