Short Communication
Effects of roof modifications on growth performance and physiological
changes of crossbred beef heifers (
Bos indicus
)
Titaporn Khongdee
*Department of Animal Science, Faculty of Agricultural Technology and Industrial Technology, Nakhon Sawan Rajabhat University, Mueang, Nakhon Sawan, 60000 Thailand.
Received: 20 November 2014; Accepted: 7 October 2015
Abstract
The objective of the experiment was to examine and evaluate growth performance and physiological changes of cattle raised under normal roof versus a modified roof. Ten Hindu Brazil x Brahman heifers were used in the experiment. The animals were divided randomly into two groups. They were used to evaluate the effects of modified roofing on the subjects’ physio-logical responses to heat stress and performance under hot humid conditions. It was found that the modified roof (MR) offered a more efficient way to lower heat stress in the cattle than the normal roof (NR). The difference was sufficient to enable the NR at 14:00 p.m. to have a THI higher (P<0.001) than that of the MR. Roof temperature of the MR (35.67±4.28°C) was found to be lower (P<0.01) than that of the NR (44.49±7.61°C). Rectal temperature (RT) and average rate of gain (ADG) of the cattle kept under MR (39.02°C; 0.632 kg/d) was lower (P<0.01) and higher (P<0.01), respectively than the NR (40.05 °C; 0.350 kg/d) cattle.
Keywords: roof modification, temperature humidity index, growth performance, physiology, beef heifer
1. Introduction
The effects of heat stress on animal production are well known and have been investigated and documented for a number of years. In pioneering research at the Climatology Laboratory in Missouri, the relationships between high ambient temperature and increased rectal temperature of dairy cows (Johnson, 1987) and the subsequent impact on milk yield, feed, and energy intakes (Tyrrell et al., 1988; Kirchgessner et al., 1991) were established. The impact of heat stress can be reduced by recognizing the adaptive ability of animals, and by proactive application of appropriate counter-measures such as sunshades and evaporative cool-ing in conjunction with mechanical ventilation (Hahn et al., 1992).
Heat stress is caused by an inappropriate combination of environmental factors including air temperature, solar radiation, humidity, and wind velocity. There have been many attempts to develop an index that relates these specific envi-ronmental characteristics to the physiological variables of an animal such as heart rate, respiration rate and volume, sweating rate, and body temperature.
Thermal stress in cattle results in major decreases in production each summer (McDowell, 1958). These decreases have been documented in many studies and reviews (Collier et al., 1982; Ray et al., 1992; Armstrong, 1994; Ravagnolo and Miztal, 2000; Willmer et al., 2000). Igono et al. (1992) proposed that the temperature humidity index (THI) could be used to evaluate the level of thermal stress imposed by the environment. This index combines relative humidity and temperature parameters into a single value that provides an estimate of the potential environmental heat load. An envi-ronment is generally considered stressful for cattle when the THI exceeds 72; when THI is at or above this level, adverse effects including rises in rectal temperature (Legates et al.,
* Corresponding author.
Email address: [email protected]
1991) are expected. Other researchers have also suggested (Hahn et al., 1992; Khongdee et al., 2006) that the feed intake of cattle will be reduced when ambient temperatures exceed 23.9°C.
Shades, including the addition of simple roofing, have been shown to reduce solar radiation (Blackshaw and Blackshaw, 1994). For example, polypropylene fabric sheet shade cloth with 70-80% shading has been placed above animals to reduce the solar radiation load on livestock (Bucklin et al., 1993). Khongdee et al. (2005, 2008) placed a polypropylene fabric sheet (80%) 100 cm above the roof of a dairy cattle shed. The dairy cattle which were housed in such sheds have yielded more milk than those which lived under a bare roof shed.
Therefore, an experiment using a black woven poly-propylene sheet (WPSC = shade cloth with 80% shade factor, Polysac Co., Bangkok, Thailand) was designed, to investigate some of the biological performances of beef (B. indicus) in Thailand.
2. Materials and Methods
A herd of Hindu Brazil–Brahman crosses (50% Hindu Brazil X 50% Brahman) was maintained at the Chainat College of Agriculture and Technology, Chainat Province (latitude 15° 162 N, longitude 100° 062 E and at 18 m above sea level). The study was carried out at the college for 157 days (27 December 2010 – 30 May 2011).
The animal housing was a free-stall type of open shed, orientated East–West in direction and with the front facing North. The animal house was fitted with a corrugated galva-nized iron roof (CGIR), and had a highest height point of 4 m above the ground with a slope of 0.375 m/m.
Ten beef heifers, approximately of 2 years of age (average weight 240 kg,) were randomly selected from the above herd of cattle and used in the present experiment. They were divided randomly into two groups of equal size and assigned to two treatments.
2.1 Treatment
Treatment 1 (normal roof, NR): Five crossbred beef heifers were maintained in the open shed (5×10 m) fitted with CGIR.
Treatment 2 (modified roof, MR): Five crossbred beef heifers were maintained in a similar open shed — adjacent to that of Treatment 1—except that at 80 cm above the CGIR, a WPSC (WPSC shade cloth with 80% shade factor, Polysac, Bangkok, Thailand) was stretched over the CGIR and the space between the shade cloth and the roof was freely venti-lated.
A period of 14 days was allowed for adaptation, and all animals were injected with Ivermac® subcutaneously at 14
days prior to the commencement of the experiment. Rough-ages and concentrates (Table 1) were used in the present experiment. The animals were group fed twice daily. While
the roughage was fed ad libitum, the amount of concentrate (commercially produced) offered to the animals was accord-ing to NRC (2001). Water was available to the animals at all times. The feed was analyzed (Van Soest et al., 1991; AOAC, 2000) and shown in Table 1.
2.2 Temperature measurements
Thermometers (mercury in glass) comprising wet and dry bulb thermometer (Shanghai Yilian Control Temperature Apparatus Factory, Yangpu, Shanghai, PR China) and a Black Globe thermometer (BG, Somparn, 2004) were placed at each pen both inside (middle of the pen) and outside (2 m) away from the animal house at a height of 160 cm above floor i.e. beyond the reach of the animals. Temperature humidity index (THI) is determined by calculation using Armstrong’s formula (Armstrong, 1994) as
follows:-THI = Tdb + 0.36(Tdp) + 41.2 (1)
where Tdb is the dry bulb temperature (°C) and Tdp is the dew
point temperature (°C).
The values of the Black Globe, WB, DB, THI and roof temperatures from both the modified roof (MR) and normal roof (NR) were collected daily at 08:00, 14:00 and 17:00 h. The roof temperatures were collected from the underside of the roofs using an infrared thermometer (Infrared Thermometer Model ST-660, Sentry Optronics Corps., China).
2.3 Blood sampling
Blood samples were drawn from the coccygeal vein at weekly intervals. They were then transferred to a laboratory where they were spun with a centrifuge at 3,000 rev/min to separate the serum, which was then stored at -20°C for further analyses. The blood serum samples were analyzed for cortisol and free triiodotyronine (T3) at the Hormones
Labo-ratory, Faculty of Medicine, Chulalongkon University using Elecsys 2010/1010 (Roche, Mannheim, Germany) to detect T3
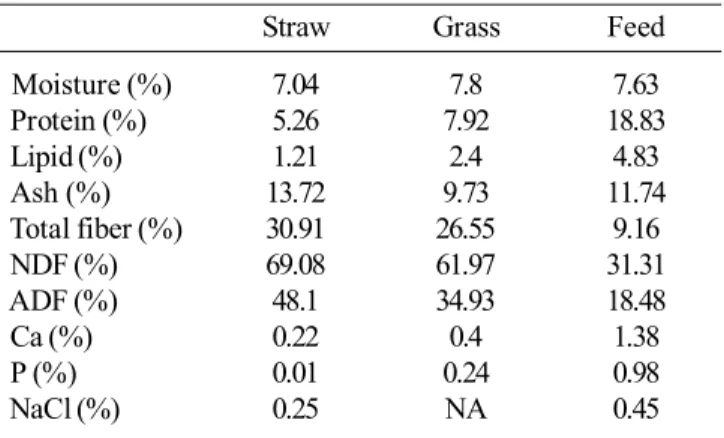
Table 1. Feed compositions of rice straw, mixed grass and concentrates.
Straw Grass Feed Moisture (%) 7.04 7.8 7.63 Protein (%) 5.26 7.92 18.83
Lipid (%) 1.21 2.4 4.83
Ash (%) 13.72 9.73 11.74 Total fiber (%) 30.91 26.55 9.16 NDF (%) 69.08 61.97 31.31 ADF (%) 48.1 34.93 18.48
Ca (%) 0.22 0.4 1.38
P (%) 0.01 0.24 0.98
and to measure cortisol (Siemens Medical Solutions Diag-nostics, Erlangen, Germany).
2.4 Statistical analysis
The experiment was of completely randomized design (CRD) and used the statistical analysis used ANOVA to find the difference between NR and MR (Steel and Torrie, 1980). The model used was
Yij = + Ai + ij
where Yij = variable of animal No. j, in group ith ;
= population mean;
Ai = influence of animal No. i (I = 1, 2).
Ij = the experimental error from random;
ij <NID (0, e2); and NID is normally independently distributed.
T-test was used PROC TTEST of SAS V. 9.0 (SAS Institute 1999) to find the difference between treatment and
mean values. These are shown with ± SD (standard devia-tion).
3. Results and Discussion
Feed composition of rice straw, mixed grass and con-centrates are shown in Table 1. The results of roof surface temperature, Black Globe temperature, ambient temperature (D.B.) and relative humidity (R.H.) measured at 8:00 am., 14:00 and 17:00 pm. under modified roof, normal roof, and outside the sheds are shown in Table 2.
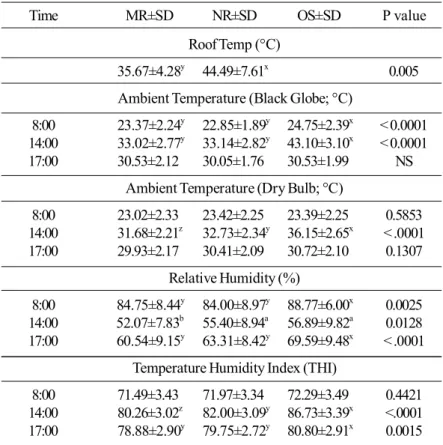
The results (Table 2) revealed that the WPSC effec-tively reduced ambient temperature, especially when there was strong sunlight (14:00 pm.). This was because part of the solar heat load was absorbed by the WPSC and therefore the solar energy was much reduced by the time it reached the roof underneath. Therefore, the roof surface temperature of the MR (35.67±4.28°C) was found to be significantly lower than that of the NR (44.49±7.61°C) (Table 2). Such reduction of roof surface temperature occurred throughout the
experi-Table 2. Mean±SD °C of roof surface temperature (°C); Black Globe, ambient temperatures, relative humidity (% R.H.) and tempera-ture humidity index measured at 8:00 am, 14:00 and 17:00 pm under modified roof, normal roof and outside the sheds.
Time MR±SD NR±SD OS±SD P value
Roof Temp (°C)
35.67±4.28y 44.49±7.61x 0.005
Ambient Temperature (Black Globe; °C)
8:00 23.37±2.24y 22.85±1.89y 24.75±2.39x < 0.0001
14:00 33.02±2.77y 33.14±2.82y 43.10±3.10x < 0.0001
17:00 30.53±2.12 30.05±1.76 30.53±1.99 NS Ambient Temperature (Dry Bulb; °C)
8:00 23.02±2.33 23.42±2.25 23.39±2.25 0.5853 14:00 31.68±2.21z 32.73±2.34y 36.15±2.65x < .0001
17:00 29.93±2.17 30.41±2.09 30.72±2.10 0.1307 Relative Humidity (%)
8:00 84.75±8.44y 84.00±8.97y 88.77±6.00x 0.0025
14:00 52.07±7.83b 55.40±8.94a 56.89±9.82a 0.0128
17:00 60.54±9.15y 63.31±8.42y 69.59±9.48x < .0001
Temperature Humidity Index (THI)
8:00 71.49±3.43 71.97±3.34 72.29±3.49 0.4421 14:00 80.26±3.02z 82.00±3.09y 86.73±3.39x <.0001
17:00 78.88±2.90y 79.75±2.72y 80.80±2.91x 0.0015
mental period (day time). Furthermore, the results from Table 2 indicated that ambient temperature under the modified roofs was lower (P<0.05) than in locations where there was a complete absence of roofing (i.e. open air outside the shed), especially in the afternoon.
It can be seen (Table 2) that there is no statistical difference (P>0.05) in the THI under MR, NR, and OS areas in the morning (71.49±3.43, 71.97±3.34 and 72.29±3.49, respec-tively). This may be attributed to the fact that solar radiation in the morning is less strong than during other parts of the day (Amakiri and Funsho, 1979; Bonan, 2008). However, there are high statistical differences (P<0.001) in the THI at 14:00 and 17:00 pm. of the MR, NR and OS areas. The values of the THI at 14:00 pm. of these areas were such that the THI of MR (80.26±3.02) was significantly (P<0.001) lower than that of NR (82.00±3.09), which in turn was significantly (P<0.001) lower than that of OS (86.73±3.39x). Furthermore, the values
of the THI at 17:00 pm. of the MR, NR and OS areas were such that the THI of MR (78.88±2.90) was significantly (P<0.001) lower than that of NR (79.75±2.72), which in turn was signi-ficantly (P<0.001) lower than that of OS (80.80±2.91). The threshold of THI for beef cattle (B. taurus) was found to be 72.9 (Amundson et al., 2006). Although the THI did not
Table 3. Rectal temperature (°C) of the cattle kept under modified roof (MR±SD) and normal roof (NR±SD) over the experimental period.
Time MR±SD (°C) NR±SD (°C) P value T1(Dec wk4) 39.28±0.19 39.14±0.39 0.4931 T2(Jan wk1) 38.98±0.48 39.44±0.44 0.1511 T3(Jan wk 2) 39.02±0.36b 39.62±0.41a 0.0397
T4(Jan wk3) 38.88±0.63 39.52±0.36 0.0834 T5(Jan wk4) 38.98±0.29 39.28±0.53 0.2954 T6(Feb wk 1) 38.82±0.29y 39.54±0.36x 0.0089
T7(Feb wk 2) 38.94±0.26y 39.58±0.38x 0.0142
T8(Feb wk 3) 38.66±0.50y 39.78±0.23x 0.0019
T9(Feb wk 4) 38.70±0.27y 39.64±0.09x <.0001
T10(Mar wk1) 38.72±0.30y 40.46±0.59x 0.0004
T11(Mar wk2) 38.90±0.42y 40.36±0.59x 0.0020
T12(Mar wk3) 38.80±0.27y 40.20±0.45x 0.0003
T13(Mar wk4) 38.50±0.00y 40.38±1.08x 0.0048
T14(Apr wk1) 39.30±0.27y 40.42±0.68x 0.0093
T15(Apr wk2) 39.54±0.29y 40.68±0.49x 0.0020
T16(Apr wk3) 39.46±0.35y 40.38±0.15x 0.0006
T17(Apr wk4) 39.22±0.26y 40.68±0.49x 0.0004
T18(May wk1) 39.42±0.40y 40.42±0.35x 0.0029
T19(May wk2) 39.16±0.21y 40.64±0.35x <.0001
T20(May wk3) 39.30±0.27y 40.66±0.33x 0.0001
T21(May wk4) 38.92±0.24y 40.16±0.54x 0.0016
All 39.02±0.41y 40.05±0.67x <.0001
a, b – Means within a row with different superscripts are statistically different (P<0.05). x, y – Means within a row with different superscripts are highly statistically different (P<0.01).
Table 4. Cortisol (µg%) values of cattle kept under modified roof (MR) and normal roof (NR) over the experimen-tal period.
Cortisol (µg%) and
Month MR±SD NR±SD P value Dec 0.93±0.67 0.70±0.26 0.6028
Jan 0.77±0.21 1.40±0.89 0.2958 Feb 1.60±0.87 2.23±1.07 0.4711 Mar 2.03±1.00 2.07±1.11 0.9711 Apr 1.70±0.66 2.77±1.33 0.2812 May 2.03±1.01 2.83±0.06 0.2433 All 1.51±0.83 2.00±1.09 0.1402
Free triiodotyronine (pg/ml)
Month MR±SD (pg/ml) NR±SD (pg/ml) P value Dec 4.69±0.33x 3.41±0.271y 0.0066
Jan 4.23±0.39 4.83±0.93 0.358 Feb 4.04±0.51a 3.15±0.27b 0.0546
Mar 4.55±0.92 4.58±0.89 0.9729 Apr 3.40±0.56 2.78±0.42 0.204 May 3.59±0.62 3.74±0.53 0.7611
All 4.08±0.69 3.75±0.92 0.2254
a, b – Means within a row with different superscripts are statistically different (P<0.05). x, y - Means within a row with different superscripts are highly statistically different (P<0.01). include direct solar heat load to the animal’s body (Gaughan et al., 2008), in the present experiment the animals were kept under modified and normal roofs. Therefore cattle that were kept under MR were less stressed by heat than those that were kept under NR, particularly with respect to the later part of the day. This is due to the fact that part of the incoming solar energy was absorbed and dissipated by the shade cloth above the MR.
The results of rectal temperature (RT; Table 3) revealed that the rectal temperature (RT) of the cattle kept under MR (39.02±0.41°C) were significantly lower (P<0.01) than that of their counterpart animals which were kept under the NR (40.05±0.67°C). This is due to the difference in the ambient heat load applying, respectively to the two groups of animals (P<0.01; Table 3). Khongdee et al. (2005) found that the RT of dairy cattle (Holstein Friesian crossbred) kept under similar MR were also significantly (P<0.01) lower than those of the Holstein crossbreds that were kept under NR. When the RT value of B. taurus reaches 41.7°C as a result of heat stress, this could be fatal (Vajrabukka, 1978).
MR (1.51±0.83 µg%) was lower (P>0.05) than that of the animals housed under NR (2.00±1.09 µg%). Elevated plasma cortisol and lowered plasma triiodotyronine (T3)
concentra-tion in an animal may reflect stress due to high temperature (Chaiyabutr et al., 2008). Furthermore, it can be seen that the T3 of the animals under MR (4.08±0.69 pg/ml) was higher
(P>0.05) than that of the animals under NR (3.75±0.92 pg/ml). In response to heat stress, the level of cortisol in dairy cattle has been shown to increase (Wise et al., 1988) while the level of T3 decreased due to heat stress (West, 2003).
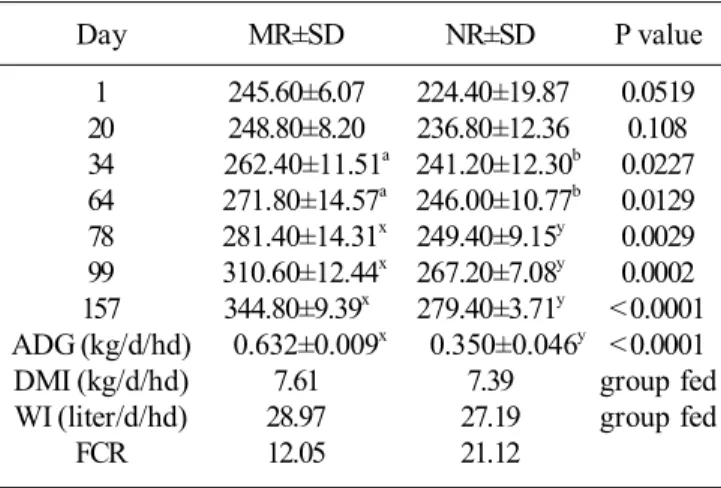
Heat stress reduces dry matter intake (DMI) (Fuquay, 1981; Beede and Collier, 1986; McGuire et al., 1991; Bova et al., 2014). However, the DMI of the MR heifers (7.61 kg/d) was slightly higher than that of the NR heifers (7.39 kg/d). Furthermore, the water intake (WI) of the MR animals (28.97 l/ d) was also slightly higher than that of the NR animals (27.19 l/d). Ambient temperature may influence both DMI and WI of cattle, such that increasing ambient temperature will decrease DMI but increase WI (NRC, 1981; Arias and Mader, 2011).
The results of the present experiment (Table 5; Figure 1) indicate that the cattle housed under the MR (Average Daily Gain, ADG = 0.632 kg/d) grew significantly (P<0.01) better than the NR (ADG = 0.350 kg/d) cattle. This could be due to the MR animals being less stressed by heat than the NR animals as reflected by a significantly higher RT of the NR heifers, and thus maintenance requirements increase as the cattle attempt to dissipate excess heat load (West, 1999). The more thermally stressed an animal is, the more energy it will spend to get rid of the excessive heat, as indicated by the NR animals having higher FCR than the MR animals.
The results of the present experiment have shown that the installation of a WPSC above the roof effectively amelio-rates heat stress of animals living under it, thereby resulting in improved growth performance of beef heifers.
References
Aggarwal, A. and Upadhyay, R. 2013. Heat stress and animal productivity. Springer India. DOI 10.1007/978-81-322-0879-2
Arias, R.A. and Mader, T.L. 2011. Environmental factors af-fecting daily water intake on cattle finished in feedlots. Journal Animal Science. 89, 245-251.
Amundson, J.L., Mader, T.L., Rasby, R.J. and Hu, Q.S. 2006. Environmental effects on pregnancy rate in beef cattle. Journal of Animal Science. 84(12), 3415-20.
Armstrong, D.V. 1994. Heat stress interaction with shade and cooling. Journal of Dairy Science. 77, 2044-2050. Amakiri, S.F. and Funsho, O.N. 1979. Studies of rectal
tem-perature, respiratory rates and heat tolerance in cattle in the humid tropics. Animal Production. 28, 329-335. AOAC, 2000. Official Methods of Analysis of AOAC
Inter-national 17th Edition. Gaithersburg, U.S.A.
Beede, D.K. and Collier, R.J. 1986. Potential nutritional strate-gies for intensively managed cattle during thermal stress. Journal of Animal Science. 62, 543–554.
Table 5. Live weight (kg/hd{head}), ADG (kg/d/hd), DMI (dry matter intake; kg/d/hd), WI water intake; litre/d/hd) and FCR of the cattle kept under modified roof (MR±SD) and normal roof (NR±SD) over the experi-mental period.
Day MR±SD NR±SD P value
1 245.60±6.07 224.40±19.87 0.0519 20 248.80±8.20 236.80±12.36 0.108 34 262.40±11.51a 241.20±12.30b 0.0227
64 271.80±14.57a 246.00±10.77b 0.0129
78 281.40±14.31x 249.40±9.15y 0.0029
99 310.60±12.44x 267.20±7.08y 0.0002
157 344.80±9.39x 279.40±3.71y < 0.0001
ADG (kg/d/hd) 0.632±0.009x 0.350±0.046y < 0.0001
DMI (kg/d/hd) 7.61 7.39 group fed WI (liter/d/hd) 28.97 27.19 group fed
FCR 12.05 21.12
a, b – Means within a rows with different superscripts are statistically different (P<0.05). x, y - Means within a rows with different superscripts are highly statistically different (P<0.01).
Figure 1. Live weight (kg) of the cattle kept under modified roof (MR±SD) and normal roof (NR±SD) over the experi-mental period Y2=225.8+2.51X, R2=0.95; Y1=235.4+ 4.87X, R2=0.97.
Blackshaw, J.K. and Blackshaw, A.W. 1994. Heat stress in cattle and the effect of shade on production and behaviour: a review. Australian Journal of Experimen-tal Agriculture. 34, 285-295.
Bonan, G.B. 2008. Ecological Climatology 2nd ed., Cambridge
University Press, U.K. pp. 690.
Bova, T.L., Chiavaccini, L., Cline, G.F., Hart, C.G., Matheny, K., Voelz, B.E., Kesler, D., Memili, E. and Muth, A.M. 2014. Environmental stressors influencing hormones and systems physiology in cattle. Reproductive Bio-logy and EndocrinoBio-logy. 12, 58-63.
Chaiyabutr, N., Chanpongsang, S. and Suadsong, S. 2008. Effect of evaporative cooling on the regulation of body water and milk production in crossbred Holstein cattle in a tropical environment. International Journal of Biometeorology. 52, 575-585.
Collier, R.J., Beede, D.K., Thatcher, W.W., Israel, L.A. and Wilcox, C.J. 1982. Influences of environment and its modification on dairy animal health and production. Journal of Dairy Science. 65, 2213–2227.
Fuquay, J.W. 1981. Heat stress as it affects production. Journal of Animal Science. 52, 167–174.
Gaughan, J.B., Mader, T.L., Holt, S.M. and Lisle, A. 2008. A new heat load index for feedlot cattle. Journal of Animal Science. 86(1), 226-34.
Hahn, G.L., Klinedinst, P.L. and Wilhite, D.A. 1992. Climate change impacts on livestock production and manage-ment. American Society of Agricultural Engineers, Paper No. 92-7037. St. Joseph, Michigan U.S.A. Igono, M.O., Jotvedt, G. and Sanford-Crane, H.T. 1992.
Envi-ronmental profile and critical temperature effects on milk production of Holstein cows in desert climate. International Journal Biometeorology. 36, 77-87. Johnson, H.D. 1987. Bioclimate Effects on Growth,
Reproduc-tion and Milk ProducReproduc-tion. In Bioclimatology and the Adaptation of Livestock. H.D. Johnson, editor, Elsevier Science Publishers, Amsterdam, The Netherlands. pp. 35-57.
Kirchgessner, M., Wendish, W., Muller, H.L. and Kreuzer, M. 1991. Release of methane and of carbon dioxide by dairy cattle. Agricultural Biological Research. 44, 91-102.
Khongdee, S., Makvichit, K., Hinch, G., Chaiyabutr, N., Tummabood, S. and Vajrabukka, C. 2005. A survey of calving seasons on dairy reproductive performance and milk production under tropical conditions. Thai Journal of Agricultural Science. (3-4), 95-100.
Khongdee, S., Chaiyabutr, N., Hinch, G., Markvichitr, K. and Vajrabukka, C. 2006. Effects of evaporative cooling on reproductive performance and milk production of dairy cows in hot wet conditions. International Journal Biometeorology. 50, 253-257.
Khongdee, S. 2008. The Effects of High Temperature and Housing Modification on the Productive and Repro-ductive Performance of Dairy Cows. Ph.D. Thesis, Kasetsart University, Bangkok. 123 p.
Legates, J.E., Farthing, B.R., Casady, R.B. and Barrada, M.S. 1991. Body temperature and respiratory rate of lactat-ing dairy cattle under field and chamber conditions. Journal of Dairy Science. 74, 2491-2500.
McDowell, R.E. 1958. Physiological approaches to animal climatology. Journal of Hereditary. 49, 52-61.
McGuire, M.A., Beede, D.K., Collier, R.J., Buonomo, F.C., DeLorenzo, M.A., Wilcox, C.J., Huntington, G.B. and Reynolds, C.K. 1991. Effects of acute thermal stress and amount of feed intake on concentrations of soma-totropin, insulin-like growth factor (IGF)-I and IGF-II,
and thyroid hormones in plasma of lactating Holstein cows. Journal of Animal Science. 69, 2050-2056. NRC (National Research Council) 1981. Effect of Environment
on Nutrient Requirements of Domestic Animals. National Academy Press, Washington, D.C., U.S.A. NRC (National Research Council) 2001. Nutrient requirements
of dairy cattle, 7th edn. National Academic of Sciences, Washington, DC., U.S.A.
Ravagnolo, O. and Miztal, I. 2000. Genetic component of heat stress in dairy cattle, parameter estimation. Journal of Dairy Science. 83(9), 2126-30.
Ray, D.E., Halbach, T.J. and Armstrong, D.V. 1992. Season and lactation number effects on milk production and reproduction efficiency of dairy cattle in Arizona. Journal of Dairy Science. 75, 2976-2983.
SAS Institute. 1999. SAS/STAT® User’s Guide Version 8. Cary
NC: SAS Institute Inc. 3884 p.
Somparn, P. 2004. Intensive management strategies for managing swamp buffaloes during thermal stress. PhD Thesis, Kasetsart University, Bangkok, Thailand. Steel, R.G.D. and Torrie, J.H. 1980. Principles and procedure
of statistics, 3rd edition. Macmillan, New York, U.S.A.,
p 521.
Tyrrell, H.F., Brown, A.C., Renolds, P.J., Haaland, G.L., Bauman, D.E., Peel, C.J. and Steinhour, W.D. 1988. Effect of bovine somatotropin on metabolism of lactating dairy cows: energy and nitrogen utilization as determined by respiration calorimetry. Journal of Nutrition. 118, 1024-1030.
Vajrabukka, C. 1978. Seasonal changes in the hair and coat characteristics of Hereford cattle, with observations on the association between coat character and heat tolerance at various temperatures and humidities. M.Ag.Sc. Thesis, University of New England, Armidale, Australia.
Vajrabukka, C. 1992. Environmental Physiology of Domestic Animals. Department of Animal Science, Kasetsart University, Bangkok, Thailand. (in Thai) 255 p. Van Soest, P.J., Roberts, J.B. and Lewis, B.A. 1991. Methods
for dietary fiber, neutral detergent fiber and non-starch polysaccharides in relation to nutrition. Journal of Dairy Science. 74, 3583–3597.
West, J.W. 1999. Nutritional strategies for managing the heat-stressed dairy cow. Journal of Animal Science. 77(2), 21-35.
West, J.W. 2003. Effects of Heat-Stress on Production in Dairy Cattle. Journal of Dairy Science. 86(6), 2131-2144.
Willmer, P., Stone, G. and Johnston, I. 2000. Environmental Physiology of Animals. Blackwell Science Ltd., Oxford, England. 644 p.