Grouping Pentylenetetrazol-Induced Epileptic
Rats According to Memory Impairment and
MicroRNA Expression Profiles in the
Hippocampus
Xixia Liu, Yuan Wu*, Qi Huang, Donghua Zou, Weihan Qin, Zhen Chen
Department of Neurology, The First Affiliated Hospital of Guangxi Medical University, Nanning, Guangxi, China
*wuyuan90@126.com
Abstract
Previous studies have demonstrated a close relationship between abnormal regulation of microRNA (miRNA) and various types of diseases, including epilepsy and other neurologi-cal disorders of memory. However, the role of miRNA in the memory impairment observed in epilepsy remains unknown. In this study, a model of temporal lobe epilepsy (TLE) was in-duced via pentylenetetrazol (PTZ) kindling in Sprague-Dawley rats. First, the TLE rats were subjected to Morris water maze to identify those with memory impairment (TLE-MI) com-pared with TLE control rats (TLE-C), which presented normal memory. Both groups were analyzed to detect dysregulated miRNAs in the hippocampus; four up-regulated miRNAs 34c, miR-374, miR-181a, and miR-let-7c-1) and seven down-regulated miRNAs (miR-1188, miR-770-5p, miR-127-5p, miR-375, miR-331, miR-873-5p, and miR-328a) were found. Some of the dysregulated miRNAs (miR-34c, miR-1188a, miR-328a, and miR-331) were confirmed using qRT-PCR, and their blood expression patterns were identical to those of their counterparts in the rat hippocampus. The targets of these dysregulated miRNAs and other potentially enriched biological signaling pathways were analyzed using bioinfor-matics. Following these results, the MAPK, apoptosis and hippocampal signaling pathways might be involved in the molecular mechanisms underlying the memory disorders of TLE.
Introduction
Cognitive deficits represent a serious neuropsychological obstacle in people suffering from temporal lobe epilepsy (TLE)[1]. Memory disorders, which are the most notably neural behav-ioral impairments manifested by TLE[2], currently attract a great deal of attention because their underlying molecular mechanisms remain unknown[3]. Seizures[4], medication[5], cir-cuit reorganization[6] and abnormal forms of interictal activity[7] have been proposed to con-tribute to cognitive impairment. Evidence has supported the hypothesis that memory and learning are facilitated by the hippocampal cortex[8]. Additionally, neuroimaging studies
OPEN ACCESS
Citation:Liu X, Wu Y, Huang Q, Zou D, Qin W, Chen Z (2015) Grouping Pentylenetetrazol-Induced Epileptic Rats According to Memory Impairment and MicroRNA Expression Profiles in the Hippocampus. PLoS ONE 10(5): e0126123. doi:10.1371/journal. pone.0126123
Academic Editor:Yu Xue, Huazhong University of Science and Technology, CHINA
Received:October 11, 2014
Accepted:March 29, 2015
Published:May 11, 2015
Copyright:© 2015 Liu et al. This is an open access article distributed under the terms of theCreative Commons Attribution License, which permits unrestricted use, distribution, and reproduction in any medium, provided the original author and source are credited.
Data Availability Statement:All relevant data are within the paper and its Supporting Information files.
Funding:This work was supported by the National Natural Science Foundation of China (NSFC); Grant number: 81360201.
reveal higher cognitive deficits after epilepsy surgery, whereas the hippocampal formation re-mains normal[9]. Previous lesion studies have demonstrated an important effect of entorhinal lesions on the hippocampi of TLE animals suffering from indirect excitotoxins (such as ami-nooxyacetic acid or gamma-aminobutyric acid) with memory impairment[10]. However, a re-cent study reported no neuronal cell loss but decreased expression of synaptophysin, SNAP-25, and Syt 1 in the hippocampi of KA-treated rats[11].
Currently, TLE-related cognitive disorders have been characterized by experimental models and memory and learning deficits were compared after preconditioning[12,13]. However, stan-dardized neuropsychological tests to analyze memory impairment in epileptic rat models re-main elusive. The Morris water maze (MWM) test is considered the primary method used in animal behavior research to analyze learning and memory[14,15]. PTZ-induced epileptic is the most popular animal model used by scholar to study seizure and its cognitive deficits[16,17]. Studies have showed learning and memory disorders caused by PTZ kindling, with a bad show in the test of MWM[18]. We therefore screened PTZ kindling-induced TLE rats using the MWM test to identify the TLE rats suffering from memory impairment among the rats with normal cognitive function.
MicroRNAs (miRNAs) are small regulatory RNA molecules (approximately 22 nt) and reg-ulate gene expression negatively, playing a critical role in normal neuronal development[19]. miRNAs control various biological processes and involved in several neurological diseases, such as ischemic tolerance[20], Alzheimer’s disease[21] and Parkinson’s disease[22], as well as in the response to electroshock therapy[23]. Recently, increasing evidence has supported the involvement of changes in miRNA expression in the molecular mechanism of epileptic toler-ance[24–29]. Furthermore, multiple lines of evidence support the role of miRNAs in memory formation mechanisms and in activity-induced gene expression. Synaptic plasticity and memo-ry function were constrained in the presence of increased levels of miRNAs in rodent brains [30–31] and similar effects might occur in AD brains[32]. Wang et al[33] demonstrated im-paired acquisition of trace fear memory in mice following reduced miR-132 expression in the hippocampus. In addition, a therapeutic approach was used to improve memory performance in MS patients after miR-124 inhibition in hippocampal neurons[34].
However, the effects of miRNAs on memory deficits in epilepsy alone have not been re-ported. Therefore, we profiled miRNA expression in the hippocampus of a PTZ-kindled rat with TLE-associated memory deficits and characterized the effects of specific miRNAs. We then also demonstrated potential correlation in the expression of miRNAs in hippocampal temporal lobe tissue and in peripheral blood. The results of this study may help explain the mechanisms of memory disorders and enable novel functional genomic analyses in temporal lobe epilepsy.
Materials and Methods
Animals and kindling induction
All chemicals used in this research were of analytical grade. Pentylenetetrazol (PTZ) was purchased from Sigma-Aldrich (St. Louis, MO, USA) and freshly dissolved in physiological sa-line before administering injections. The rats were divided into a normal control group (n = 10) and a PTZ model group (n = 60) using a random number table.
TLE preconditioning was performed by a single intraperitoneal injection of PTZ (60 mg/kg) on the first day, followed by repeated injections of PTZ (35 mg/kg) on alternating days between 8:00 and 10:00 AM starting on the 3rd day, with a total of 14 injections. The control group rats received 0.9% physiological saline (10 ml/kg) i.p. every other 48 hours as sham precondition-ing, with 15 injections total. The rats were weighed daily, and the dosage was adjusted accord-ing to body weight. The animals were monitored for 30 min after each PTZ treatment. Seizures were rated according to the following scale: 0, no change in behavior; stage 1, chewing; stage 2, gazing and head nodding; stage 3, unilateral forelimb clonus, twitching, and scratching; stage 4, rearing with bilateral forelimb clonus; stage 5, widespread muscle spasms, rearing with bilateral forelimb clonus and falling back[35]. Kindling was defined as4 consecutive stage 2 seizures, or two seizures that were stage 4 or higher.
Determination of memory dysfunction using the MWM test
The MWM apparatus (Panlab, Spain) consisted of a circular pool (120 cm in diameter, 50 cm in height), a round colorless platform (11 cm in diameter) and a camera installed above the center of the pool. The circular pool was filled with water (22±1°C) and consisted four quad-rants. The platform was placed in a designated target quadrant 2 cm below surface. The camera was connected to a computer for synchronous image capture using a tracking system. The ref-erence items around the pool remained unchanged, allowing the rats to use these items for spa-tial orientation, and the location of the platform remained in a constant position during 5 consecutive days of experiments. The data were acquired using SLY-WMS MWM system v. 2.1 software, and the experimenters were blind to the rat grouping assignments. The MWM test consisted of a place navigation test and a spatial probe test. The memory performance of all successfully established CEP rats was evaluated 24 h after the last PTZ administration.
The acquisition test was lasted for five consecutive training days, with four sessions per day. During each training session, the rats were placed into the water maze from four different start-ing positions and had 120 s to locate the hidden platform. The software system automatically began recording at the moment each rat entered the water until the rat found the platform (i.e., the escape latency period). A latency of 120 s was recorded when the rat failed to find the plat-form within 120 s, at which point, the rat was manually guided to the platplat-form and allowed to stay on the platform for 20 s. The escape latency intervals were observed and recorded for each rat during each training session on the fifth day of testing. The hidden platform was removed after the fifth training session on day 5. Each rat was placed into the water facing the wall of the maze from four different starting positions and was given 100 s in the water per trial. The num-ber of crossings that each rat made across the former location of the platform within 100 s over the four trials was recorded and averaged to evaluate the spatial memory of each rat.
The memory-impairment evaluation system for epileptic rats was established as follows. Two scores were obtained as a reflection of normal memory function according to data collect-ed from the 10 rats in the normal group during two MWM sessions (<15 s escape latency for
the place navigation test on day 5 and>20 crossings in 400 s for the spatial probe test). Then, 6
spatial probe test). Then, 6 rats each were randomly selected from the TLE-C group and from the TLE with memory impairment group (TLE-MI), and microRNA expression patterns in these rats were investigated using microRNA array and differential analyses.
Tissue dissection and miRNA microarray analysis
Following the behavioral tests, rats from both groups (n = 6 for each group) were anesthetized with 10% chloral hydrate (3.5 ml/kg, i.p.), and 2–3 ml of blood was collected into cryogenic vials with EDTA using cardiocentesis. The rats were then sacrificed, and the hippocampus were rapidly harvested and removed to cryogenic vials with RNAlater (RNA Stabilization Solu-tion, Sigma-Aldrich). The blood and hippocampal tissue samples were stored at -80°C until further testing.
miRNA microarray analysis was performed on total hippocampal RNA from TLE rats with memory disorders and from TLE rats with normal memory performance (n = 6 for each group). Total RNA was harvested using TRIzol reagent (Invitrogen) and a miRNeasy mini kit (Qiagen) according to the manufacturers’instructions. RNA quality and quantity were mea-sured using a NanoDrop spectrophotometer (ND-1000, NanoDrop Technologies), and RNA integrity was determined using gel electrophoresis. After measuring the quantity of total hippo-campal RNA, the total hippohippo-campal RNA samples from both groups of TLE rats were labeled using a miRCURY Hy3/Hy5 Power labeling kit (Exiqon, Vedbaek, Denmark) and then hybrid-ized on a miRCURY LNA Array (v.18.0, Exiqon) using a hybridization system (Nimblegen Sys-tems, Inc., Madison, WI, USA). Following several washing steps using a wash buffer kit (Exiqon), the slides were scanned using an Axon GenePix 4000B microarray scanner (Axon In-struments, Foster City, CA, USA).
GenePix Pro 6.0 software (Axon) was used for grid alignment and data extraction. Replicat-ed miRNAs were averagReplicat-ed, and miRNAs whose intensities were30 in all samples were cho-sen to calculate the normalization factor. After performing median normalization, significant differentially expressed miRNAs were identified using volcano plot filtering between the two experimental groups. The thresholds we used to identify up- or down-regulated miRNAs were fold change1.5 and p-value0.05. Finally, hierarchical clustering was performed using MEV software (v4.6, TIGR) to identify distinguishable miRNA expression profiling among the samples.
miRNA Target Gene Prediction and Functional Analysis
Potential target genes of the differentially expressed miRNAs were predicted from data in the MicroCosm, miRanda, and miRDB databases using our proprietary database, and the final tar-gets were integrated from these three public databases. Using this identified target gene set, the significant Gene Ontology (GO) classifications and Kyoto Encyclopedia Genes and Genomes (KEGG) pathways over-represented among these target genes from two of three databases were provided to obtain useful information regarding the functions of the targets. The Gene Ontology project, which covers the Biological Process, Cellular Component and Molecular Function domains, provides a controlled vocabulary to describe gene and gene product attri-butes in any organism. Pathway analysis is a functional analysis that maps genes to KEGG pathways. The p-value reflects the significance of GO term enrichment in the DE genes and the significance of the pathways correlated to the conditions (a p-value0.05 is recommended).
Quantitative real-time PCR validation of the initial results
Total RNA was isolated using TRIzol reagent (Invitrogen Life Technologies, USA), and the RNA quality and quantity were measured using a NanoDrop ND-1000 spectrophotometer. Target cDNAs were amplified using RT-PCR (16°C for 30 min, 42°C for 40 min, and 85°C for 5 min) with a Gene Amp PCR System 9700 (Applied Biosystems). Each RT reaction mixture contained 5μl Master Mix, 0.5μl miR-RT primers F (10μM), 0.5μl miR-RT primers R
(10μM), and RNase-free H2O to a total volume of 8μl, then 2μl of the corresponding template
cDNA was added. The RT-PCR reactions for U6 and for other miRNAs were performed using a ViiA 7 Real-time PCR System (Applied Biosystems) under the following conditions: 95°C for 10 min, followed by 40 PCR cycles (95°C for 10 s and then 60°C for 60 s), then the fluorescence intensity was measured. The real-time PCR reactions were performed for target miRNAs and for the internal reference (U6), with each sample analyzed in triplicate. The relative expression level for each miRNA was calculated using the comparative cycle threshold (CT) method (2−ΔΔCT).
Statistical analysis
All data in this study are presented as the mean±SD. The Mann-Whitney U test was used for nonparametric inter-group comparisons between two groups. The escape latencies on the 5th day and the crossing times on the 6thday in the MWM test were analysed by variance (ANOVA). All statistical analyses were performed using SPSS 17.0 software (SPSS, Inc., Chicago, IL, USA), and a two-tailed p-value of 0.05 was considered to indicate a significant difference.
Results
Animal kindling by PTZ
After the first kindling in response to PTZ (60 mg/kg) (i.p.), followed by 14 repeated kindling stimulations with 35 mg of PTZ/kg (i.p.) on every 48 hours, TLE models were successfully es-tablished in 52 of the 60 rats in the PTZ group, and memory behavior was evaluated using the MWM, which was performed 24 h after the last PTZ administration. Ten normal rats were also evaluated.
Establishment of evaluation and grouping according to memory
impairment in TLE rats using the MWM test
In total, 17 TLE rats obtained scores of<15 s for escape latency on day 5 and>20 crossings in
400 s; these scores overlapped with the scores calculated for the 10 rats that underwent normal sham preconditioning and had normal memory function. Additionally, 10 rats with the worst performance in the MWM experiments obtained scores of>50 s for the escape latency on day
5 and<10 crossings in 400 s. These rats were classified as exhibiting memory impairment
ac-cording to the grouping method applied to the 52 TLE rats, representing an incidence of 19.23% (10/52) memory impairment. The evaluation and grouping of memory-impaired TEL rats using the MWM test are shown inFig 1.
miRNA microarray analysis
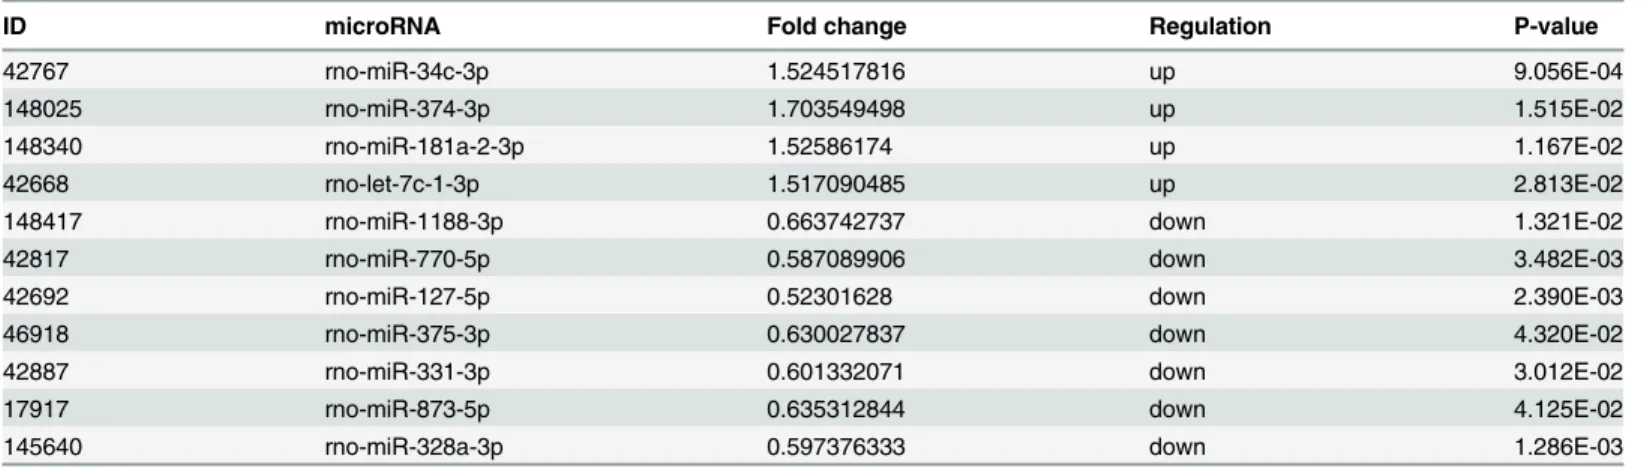
up-regulated (miR-34c, miR-374, miR-181a, and miR-let-7c-1), and 7 miRNAs were down-regulated (1188, 770-5p, 127-5p, 375, 331, 873-5p, and miR-328a) (differentially expressed miRNAs were defined by a fold-change>1.5, up or
down-regu-lated; p<0.05).
A scatter plot was generated to assess the quality of the miRNA data after filtering, and a volcano plot was generated to visualize the differential expression between two different condi-tions, as shown inFig 2. The cluster and heatmaps of all detected rat miRNAs were plotted to better demonstrate the dysregulated miRNAs between the control and memory-impaired TLE rats, as shown inFig 3. All differentially expressed miRNAs in the normalized primary micro-array data are shown in Supporting InformationS1 Table.
Fig 1. Scatterplot for all rats in the Morris water maze test and the grouping method according to memory impairment in epileptic rats.The red dots mark the 10 normal rats, and the blue dots mark the 52 TLE rats. In total, 17 TLE rats obtained overlapping scores of<15 s for the escape latency and>20 crossings in 400 s; these 17 rats were classified as the TLE control group with normal memory (TLE-C), and 10 TLE rats were classified as TLE rats with memory impairment (TLE-MI) due to their overlapping scores of>50 s for the escape latency and<10 crossings in 400 s.
doi:10.1371/journal.pone.0126123.g001
Table 1. The 11 significantly dysregulated miRNAs in the hippocampus of memory-impaired TLE rats.
ID microRNA Fold change Regulation P-value
42767 rno-miR-34c-3p 1.524517816 up 9.056E-04
148025 rno-miR-374-3p 1.703549498 up 1.515E-02
148340 rno-miR-181a-2-3p 1.52586174 up 1.167E-02
42668 rno-let-7c-1-3p 1.517090485 up 2.813E-02
148417 rno-miR-1188-3p 0.663742737 down 1.321E-02
42817 rno-miR-770-5p 0.587089906 down 3.482E-03
42692 rno-miR-127-5p 0.52301628 down 2.390E-03
46918 rno-miR-375-3p 0.630027837 down 4.320E-02
42887 rno-miR-331-3p 0.601332071 down 3.012E-02
17917 rno-miR-873-5p 0.635312844 down 4.125E-02
145640 rno-miR-328a-3p 0.597376333 down 1.286E-03
Quantitative real-time PCR results
The dysregulated miRNAs (miR-34c, miR-1188a, miR-328a, and miR-331) were confirmed using qRT-PCR and the results were consistent with the microarray analysis. According to the PCR results, the 34c expression levels were up-regulated, whereas the 1188a, miR-328a and miR-331 expression levels were down-regulated (p<0.05) (Fig 4 A
–4 C, left), and miR-1188a presented the most pronounced changes in expression in the hippocampus, which is consistent with the microarray findings.
Furthermore, miRNAs from peripheral blood of the TLE-MI and TLE-C rats were also ana-lyzed using qRT-PCR. As observed in our data, the peripheral blood expression levels of miR-1188a, miR-328, and miR-331 decreased in TLE-MI rats (Fig 4 A–4 C, right), whereas the ex-pression level of miR-34c increased (Fig 4D, right) in TLE-MI rats, suggesting that the expres-sion pattern trends were identical to those of their counterparts in the hippocampus. The quantitative real-time PCR results for peripheral blood and hippocampal tissue are shown in
Fig 4.
Bioinformatics analysis
Based on the data from the miRanda, MicroCosm, and miRDB databases within our proprie-tary database, 1971, 3699, and 750 predicted target genes of the 11 dysregulated miRNAs were identified in the miRanda, MicroCosm and miRDB databases, respectively, with 345 miRNA
Fig 2. Volcano plot (A) and scatter plot (B) of the miRNA microarray analysis.(A) Volcano plots are a useful tool for visualizing differential expression patterns between two conditions. The vertical lines correspond to 1.5-fold up- and down-regulation, and the horizontal line represents a p-value of 0.05. Thus, the red point in the plot represents the differentially expressed miRNAs that reached significance. (B) The scatter plot is a useful visualization for assessing the variation (or reproducibility) between chips. The axes of the scatter plot are the normalized signal values of the samples (the ratio scale).
doi:10.1371/journal.pone.0126123.g002
Fig 3. Hierarchical clustering for differentially expressed miRNAs (pass volcano plot) in TLE-MI compared with TLE-C animals.Left, the miRNA clustering tree; top, the sample clustering tree. Red indicates high relative expression, and green indicates low relative expression.
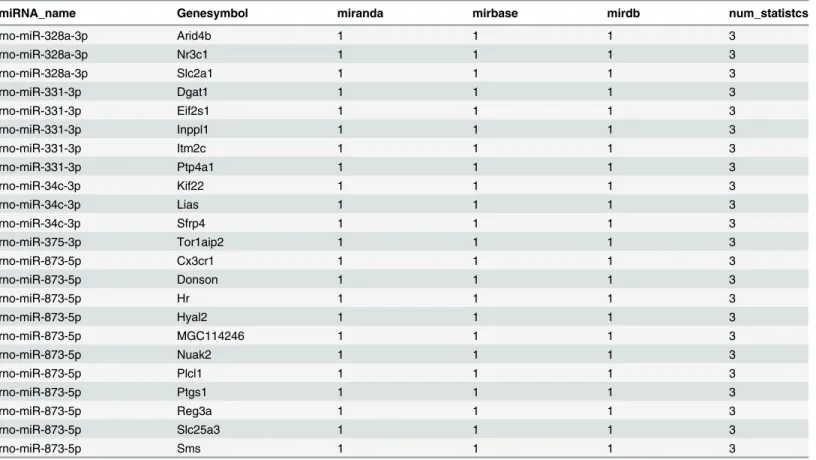
target genes integrated from two of these three databases and 23 target genes integrated from all three databases (Table 2,Fig 5). All target genes of the differentially expressed miRNAs in
Fig 4. qRT-PCR validation of four differentially expressed miRNAs in the hippocampus (Hippo) and in the peripheral blood (Blood).(A) miR-1188a expression. (B) miR-331 expression. (C) miR-375 expression. Hippocampus and blood expression levels of miR-1188a, miR-331 and miR-375 decreased in memory-impaired rats (TLE-MI) compared with control rats (TEL-C). (D) miR-34c expression. Hippocampus and blood expression levels of miR-34c increased in TLE-MI rats compared with those in TEL-C rats (the values are presented as the mean±SEM,*p<0.05; n = 6 per group).
doi:10.1371/journal.pone.0126123.g004
Table 2. The 23 target genes of significantly dysregulated miRNAs by integrating from all 3 databases.
miRNA_name Genesymbol miranda mirbase mirdb num_statistcs
rno-miR-328a-3p Arid4b 1 1 1 3
rno-miR-328a-3p Nr3c1 1 1 1 3
rno-miR-328a-3p Slc2a1 1 1 1 3
rno-miR-331-3p Dgat1 1 1 1 3
rno-miR-331-3p Eif2s1 1 1 1 3
rno-miR-331-3p Inppl1 1 1 1 3
rno-miR-331-3p Itm2c 1 1 1 3
rno-miR-331-3p Ptp4a1 1 1 1 3
rno-miR-34c-3p Kif22 1 1 1 3
rno-miR-34c-3p Lias 1 1 1 3
rno-miR-34c-3p Sfrp4 1 1 1 3
rno-miR-375-3p Tor1aip2 1 1 1 3
rno-miR-873-5p Cx3cr1 1 1 1 3
rno-miR-873-5p Donson 1 1 1 3
rno-miR-873-5p Hr 1 1 1 3
rno-miR-873-5p Hyal2 1 1 1 3
rno-miR-873-5p MGC114246 1 1 1 3
rno-miR-873-5p Nuak2 1 1 1 3
rno-miR-873-5p Plcl1 1 1 1 3
rno-miR-873-5p Ptgs1 1 1 1 3
rno-miR-873-5p Reg3a 1 1 1 3
rno-miR-873-5p Slc25a3 1 1 1 3
rno-miR-873-5p Sms 1 1 1 3
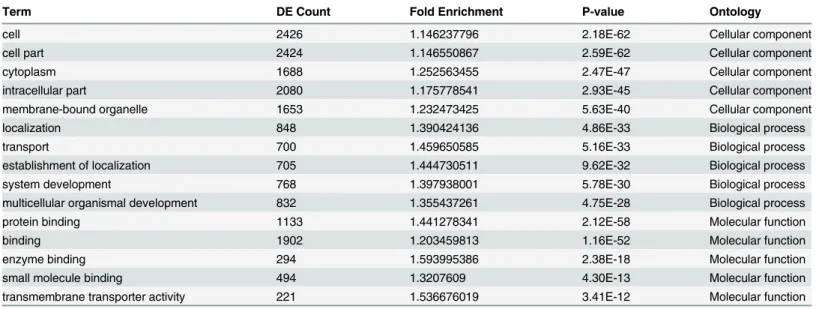
the three datebases are shown in Supporting InformationS2 Table. Five GO terms were signifi-cantly over-represented in the dysregulated miRNA targets under the domains Biological Pro-cess, Cellular Component and Molecular Function, as shown inTable 3. The detailed pathway analysis data for the top 10 pathways associated with the 11 dysregulated miRNA targets, in-cluding the pathway title, the gene numbers in the pathway and the p-value, are shown in
Table 4. The signaling pathways enriched in the TLE-MI rats were consistent with the
Fig 5. The Arraystar proprietary miRNA target database.
doi:10.1371/journal.pone.0126123.g005
Table 3. The top 5 GO terms significantly over-represented in three separate domains.
Term DE Count Fold Enrichment P-value Ontology
cell 2426 1.146237796 2.18E-62 Cellular component
cell part 2424 1.146550867 2.59E-62 Cellular component
cytoplasm 1688 1.252563455 2.47E-47 Cellular component
intracellular part 2080 1.175778541 2.93E-45 Cellular component
membrane-bound organelle 1653 1.232473425 5.63E-40 Cellular component
localization 848 1.390424136 4.86E-33 Biological process
transport 700 1.459650585 5.16E-33 Biological process
establishment of localization 705 1.444730511 9.62E-32 Biological process
system development 768 1.397938001 5.78E-30 Biological process
multicellular organismal development 832 1.355437261 4.75E-28 Biological process
protein binding 1133 1.441278341 2.12E-58 Molecular function
binding 1902 1.203459813 1.16E-52 Molecular function
enzyme binding 294 1.593995386 2.38E-18 Molecular function
small molecule binding 494 1.3207609 4.30E-13 Molecular function
transmembrane transporter activity 221 1.536676019 3.41E-12 Molecular function
molecular portrait of latent epilepsy mechanisms and memory dysfunctions presented in re-cent research[24,30].
Discussion
This study is the first attempt to establish criteria for memory impairment in TLE rats using the MWM test. Approximately 40% of patients with epilepsy suffer from cognitive and behav-ioral deficits[36]. Additionally, patients with epilepsy rank cognitive dysfunction as the worst problem that they experienced[37]. Memory deficits in TLE are thought to be caused by clinical or subclinical seizure activity, structural abnormalities, adverse effects of anticonvulsant medi-cation, psychological mechanisms[38]or other underlying brain pathologies, such as mito-chondrial dysfunction or inflammatory effects of seizure activity[39]. However, complaints regarding memory decline commonly do not match test performance because no standard neuropsychological tests to detect the memory performance associated with epilepsy have been established for either patients or animal models[40].
Evidence that deficits are more severe in patients with chronic TLE compared with newly diagnosed patients has been reported[41], with a demonstrated high frequency of tonic-clonic seizures and a long chronic course acting as the strongest predictors of cognitive decline and of the severity of memory impairments in these patients. We therefore improved the PTZ kin-dling model with a single intraperitoneal (i.p.) injection of PTZ (60 mg/kg) to trigger seizures, followed by repeated kindling (35 mg/kg) on alternating days (14 injections total) to mimic human epileptic seizures. This newly developed TLE rat model was not influenced by anticon-vulsant medication, by a different form of convulsion or by social factors and induced mild cognitive impairment associated with epilepsy for further study. The MWM was used in our study to detect the visuospatial memory functions and to form groups of TLE rats according to their performance in the place navigation test and in the spatial probe test. As indicated in the results (Fig 1), most of the TLE rats (17/52) exhibited good memory with performance that was consistent with that of normal rats; only 19.23% (10/52) of the TLE rats who exhibited poor performance on the MWM tests were classified as TLE-MI rats, and the remaining 25 TLE rats were excluded.
Our study found that distinct patterns of miRNA expression were observed in the TLE rats with memory disorders compared with those rats whose memory was not affected by TLE treatment. miRNAs are predicted to mediate protein-coding genes and to regulate protein lev-els via binding to complementary sequences in the 30-untranslated region (UTR) of their target
mRNAs in mammals[42]. miRNAs play an important role in normal brain function and in the
Table 4. The top 10 pathways of the 11 dysregulated miRNA targets.
Pathway ID Rattus norvegicus(rat) pathway Genes in pathway Fisher P-value
rno04010 MAPK signaling pathway 81 1.44E-07
rno04728 Dopaminergic synapse 48 4.49E-07
rno05031 Amphetamine addiction 29 6.98E-07
rno04668 TNF signaling pathway 40 1.22E-06
rno04261 Adrenergic signaling in cardiomyocytes 49 1.01E-05
rno04020 Calcium signaling pathway 57 1.98E-05
rno05030 Cocaine addiction 21 3.12E-05
rno04114 Oocyte meiosis 38 3.20E-05
rno04390 Hippo signaling pathway 48 6.01E-05
rno05200 Pathways in cancer 86 6.14E-05
development of the central nervous system (CNS) by inducing post-transcriptional gene silenc-ing[19]. Additionally, dysregulation of miRNAs may play a role in neurological and neurode-generative diseases, including Alzheimer’s disease, ischemic tolerance and epileptic brain injury[20–23]. Recently, several studies demonstrated that miRNAs might be involved in memory by controlling synapse function and plasticity in vertebrates[16] and might offer a highly effective means of protein expression by responding to neuronal activity during memory formation[43]. The underlying molecular mechanisms of TLE remain unknown, and an aber-rant miRNA expression pattern most likely underlies this pathological condition. Because the PTZ rat model remains one of the established classical animal models for cognitive function re-search in epilepsy and TaqMan RT-PCR miRNA assays are recognized as sensitive and accu-rate method, we demonstaccu-rated in the present study that the miRNA expression pattern in the rat hippocampus was disturbed during memory disorders. Several miRNAs were significantly up-regulated or down-regulated (P<0.05) more than 1.5-fold in the hippocampus and
periph-eral blood in TLE rats with memory disorders.
For many neurological diseases, the efficacy and outcome of treatment depend on early de-tection. In our study, the results provide a partial mechanism for specific miRNA-induced mRNA expression profiles in the brain and demonstrate the potential of blood miRNAs to serve as biomarkers in the absence of direct access to diseased tissue for clinical diagnosis and prognosis in patients with memory dysfunction, as well as other CNS malignancies, neurologi-cal, and psychiatric diseases. Some of the up-regulated (miR-34c, miR-374, miR-181a, and miR-let-7c-1) and down-regulated (miR-1188, miR-770-5p, miR-127-5p, miR-375, miR-331, miR-873-5p, and miR-328a) miRNAs we detected using miRNA microarray were suggested to be closely connected with memory function. For example, miR-34c has been proven to play an important role in cellular proliferation and apoptosis by regulating the expression of several genes; this transcript also shows increased expression levels in both PBMC and plasma in AD patients compared with those of age-matched normal controls[44]. The expression of miR-328, which is a translational regulator of ß-amyloid (Aß) precursor protein (APP)-converting enzyme (BACE), was found to be decreased in the hippocampi of aging APPSwe/PS1 mice[45].
Fig 6. The pathways enriched in the MAPK signaling pathway (A), apoptosis pathway (B) and hippocampal signaling pathway (C).
Let-7c miRNA was reported to play an important role in the regulation of androgen signaling by down-regulating androgen receptor expression[46]. Inhibiting miR-181a was proved to be correlated with the protection of 10μmol/L propofol against GD stress in astrocytes by
up-reg-ulating Bcl-2 protein expression[47].
Reliable miRNA target information remains limited, and integrating miRNA targets from the miRDB, MicroCosm and miRanda databases appears to be a more reliable and relevant ap-proach compared with using information from only one database. According to the KEGG pathway analysis regarding over-represented target genes, we found a large pool of pathways enriched in the MAPK signaling pathway, apoptosis pathway and hippocampal signaling path-way (Fig 6), which are important components in the pathogenesis of several neurological and neurodegenerative diseases, and the detailed internal mechanism requires further study.
Supporting Information
S1 Table. All differentially expressed miRNAs in normalized primary microarray data.
(PDF)
S2 Table. All target genes of the differentially expressed miRNAs in the three datebases.
(PDF)
Author Contributions
Conceived and designed the experiments: YW XL. Performed the experiments: XL ZC WQ. Analyzed the data: XL YW DZ. Contributed reagents/materials/analysis tools: XL QH. Wrote the paper: XL QH YW.
References
1. Austin JK, Dunn DW. Progressive behavioral changes in children with epilepsy. Prog Brain Res.2002; 135:419–427. PMID:12143360
2. Bergin PS, Thompson PJ, Baxendale SA, Fish DR, Shorvon SD. Remote memory in epilepsy. Epilep-sia.2000 Feb; 4(2):231–239.
3. Sayin U, Sutula TP, Stafstrom CE. Seizures in the developing brain cause adverse long-term effects on spatial learning and anxiety. Epilepsia. 2004; 45:1539–1548. PMID:15571512
4. Majak K, Pitkanen A. Do seizures cause irreversible cognitive damage?Evidence from animal studies. Epilepsy Behav. 2004 Feb; 5 Suppl 1:S35–44. PMID:14725845
5. Meador KJ. Cognitive and memory effects of the new antiepileptic drugs.Epilepsy Res. 2006; 68: 63– 67. PMID:16377148
6. Dudek FE, Hellier JL, Williams PA, Ferraro DJ, Staley KJ. The course of cellular alterations associated with the development of spontaneous seizures after status epilepticus. Prog Brain Res. 2002; 135: 53– 65. PMID:12143370
7. Holmes GL, Lenck-Santini PP. Role of interictal epileptiform abnormalities in cognitive impairment. Epi-lepsy Behav. 2006; 8: 504–515. PMID:16540376
8. Bohbot VD, Corkin S. Posterior parahippocampal place learning in H.M. Hippocampus. 2007; 17 (9):863–72. PMID:17598157
9. Helmstaedter C, Elger CE. Chronic temporal lobe epilepsy: a neuro developmental or progressively dementing disease? Brain. 2009; 132:2822–2830. doi:10.1093/brain/awp182PMID:19635728 10. Schwarcza Robert, Menno PW. Memory impairment in temporal lobe epilepsy: the role of entorhinal
le-sions.Epilepsy Research.2002; 50:161–177. PMID:12151126
11. Zhang FX, Sun QJ, Zheng XY, Lin YT, Shang W, Wang AH, et al. Abnormal Expression of Synaptophy-sin, SNAP-25,and Synaptotagmin 1 in the Hippocampus of Kainic Acid-Exposed Rats with Behavioral Deficits[J].Cell Mol Neurobiol. 2014 Aug; 34(6):813–24. doi:10.1007/s10571-014-0068-3Epub 2014 May 16. PMID:24832394
using the deoxyglucose method with special reference to the pathology of epilepsy. Neuroscience. 1981; 6(7):1361–91. PMID:7266871
13. Turski WA, Cavalheiro EA, Schwarz M, Czuczwar SJ, Kleinrok Z. Limbic seizures produced by pilocar-pine in rats: a behavioral, electroencephalographic and neuropathological study. Behav. Brain Res. 1983; 9: 315–335. PMID:6639740
14. Zeng Q, Han J, Wang B. Water Maze Spatial Learning Enhances Social Recognition Ability in Aged Rats. Behavioural Pharmacology. 2012; 23(7):669–677. doi:10.1097/FBP.0b013e3283585923PMID:
22903072
15. Inostroza M, Cid E, Brotons-Mas J, Gal B, Aivar P, Uzcategui YG, et al. Hippocampal-Dependent Spa-tial Memory in the Water Maze is Preserved in an Experimental Model of Temporal Lobe Epilepsy in Rats. PLoS One. 2011; 6(7):e22372. doi:10.1371/journal.pone.0022372PMID:21829459 16. Dhir A. Pentylenetetrazole (PTZ) kindling model of epilepsy. Curr Protoc Neurosci. 2012;Chapter 9:
Unit9.37. doi:10.1002/0471142301.ns0937s58
17. Choudhary KM, Mishra A, Poroikov VV, Goel RK. Ameliorative effect of curcumin on seizure severity, depression like behavior, learning and memory deficit in post-pentylenetetrazole-kindled mice, Eur. J. Pharmacol. 2013 Mar 15; 704(1–3):33–40 doi:10.1016/j.ejphar.2013.02.017PMID:23461854 18. Pahuja M, Mehla J, Reeta KH, Tripathi M, Gupta YK. Effect of Anacyclus pyrethrum on
pentylenetetra-zole-induced kindling, spatial memory, oxidative stress and Rho-kinase II expression in mice. Neuro-chem Res. 2013 Mar; 38(3):547–56. doi:10.1007/s11064-012-0947-2PMID:23242789
19. Fiore R, Siegel G, Schratt G. MicroRNA function in neuronal development, plasticity and disease. Bio-chim Biophys Acta. 2008 Aug; 1779(8):471–478. doi:10.1016/j.bbagrm.2007.12.006PMID:18194678 20. Lusardi TA, Farr CD, Faulkner CL, Pignataro G, Yang T, Lan J, et al. Ischemic preconditioning
regu-lates expression of microRNAs and a predicted target, MeCP2, in mouse cortex.J Cereb Blood Flow Metab. 2010 Apr; 30(4):744–756. doi:10.1038/jcbfm.2009.253PMID:20010955
21. Nelson PT, Wang WX. MiR-107 is reduced in Alzheimer's disease brain neocortex: validation study[J]. J Alzheimers Dis. 2010; 21(1):75–79. doi:10.3233/JAD-2010-091603PMID:20413881
22. Packer AN, Xing Y, Harper SQ, Jones L, Davidson BL. The bifunctional microRNA miR-9/miR-9* regu-lates REST and CoREST and is downregulated in Huntington’s disease. J Neurosci. 2008 Dec 31; 28 (53):14341–143416. doi:10.1523/JNEUROSCI.2390-08.2008PMID:19118166
23. Eacker SM, Keuss MJ, Berezikov E, Dawson VL, Dawson TM. Neuronal activity regulates hippocampal miRNA expression. PLoS One. 2011; 6(10):e25068. doi:10.1371/journal.pone.0025068PMID:
21984899
24. Hu K, Zhang C, Long L, Long X, Feng L, Li Y, et al. Expression profile of microRNAs in rat hippocampus following lithium-pilocarpine-induced status epilepticus. Neurosci Lett. 2011 Jan 25; 488(3):252–257. doi:10.1016/j.neulet.2010.11.040PMID:21094214
25. Liu DZ, Tian Y, Ander BP, Xu H, Stamova BS, Zhan X, et al. Brain and blood microRNA expression pro-filing of ischemic stroke, intracerebral hemorrhage, and kainate seizures. J Cereb Blood Flow Metab. 2010 Jan; 30(1):92–101. doi:10.1038/jcbfm.2009.186PMID:19724284
26. Pichardo-Casas I, Goff LA, Swerdel MR, Athie A, Davila J, Ramos-Brossier M, et al. Expression profil-ing of synaptic microRNAs from the adult rat brain identifies regional differences and seizure-induced dynamic modulation. Brain Res. 2012 Feb 3; 1436:20–33. doi:10.1016/j.brainres.2011.12.001PMID:
22197703
27. McKiernan RC, Jimenez-Mateos EM, Sano T, Bray I, Stallings RL, Simon RP, et al. Expression profiling the microRNA response to epileptic preconditioning identifies miR184 as a modulator of seizure-in-duced neuronal death. Exp Neurol. 2012 Oct; 237(2):346–354. doi:10.1016/j.expneurol.2012.06.029
PMID:22771761
28. Li MM, Jiang T, Sun Z, Zhang Q, Tan CC, Yu JT, et al. Genome-wide microRNA expression profiles in hippocampus of rats with chronic temporal lobe epilepsy. Sci Rep 2014, 22;4:4734. doi:10.1038/ srep04734PMID:24751812
29. Jimenez-Mateos EM, Bray I, Sanz-Rodriguez A, Engel T, McKiernan RC, Mouri G, et al. miRNA Ex-pression Profile after Status Epilepticus and Hippocampal Neuroprotection by Targeting miR-132. Am J Pathol. 2011 Nov; 179(5):2519–2532. doi:10.1016/j.ajpath.2011.07.036PMID:21945804
30. Fischbach SJ, Carew TJ. MicroRNAs in memory processing.Neuron. 2009 Sep 24; 63(6):714–716. doi:
10.1016/j.neuron.2009.09.007PMID:19778498
31. Schratt G. microRNAs At The Synapse Nat Rev Neurosci. 2009 Dec; 10(12):842–849. doi:10.1038/
nrn2763PMID:19888283
33. Wang RY, Phang RZ, Hsu PH, Wang WH, Huang HT, Liu IY, et al. In Vivo Knockdown of Hippocampal miR-132 Expression Impairs Memory Acquisition of Trace Fear Conditioning. Hippocampus. 2013 Jul; 23(7):625–633. doi:10.1002/hipo.22123PMID:23520022
34. Dutta R1, Chomyk AM, Chang A, Ribaudo MV, Deckard SA, Doud MK, et al. Hippocampal Demyelin-ation and Memory Dysfunction Are Associated with Increased Levels of the Neuronal microRNA miR-124 and Reduced AMPA Receptors.Ann Neurol. 2013 May; 73(5):637–645. doi:10.1002/ana.23860
PMID:23595422
35. Racine R, Okujava V, Chipashvili S. Modification of seizure activity by electrical stimulation. 3. Mecha-nisms. Electroencephalogr Clin Neurophysiol. 1972 Mar; 32(3):295–299. PMID:4110398
36. Kleen JK, Scott RC, Lenck-Santini PP, Holmes GL. Cognitive and behavioral co-morbidities of epilep-sy. In: Noebels JL, Avoli M, Rogawski MA, Olsen RW, Delgado-Escueta AV, editors. Jasper's Basic Mechanisms of the Epilepsies [Internet]. 4th edition. Bethesda (MD): National Center for Biotechnolo-gy Information (US); 2012.
37. Fisher R, Vickrey B, Gibson P, Hermann B, Penovich P, Scherer A, et al. The impact of epilepsy from the patient’s perspective i. Descriptions and subjective perceptions. Epilepsy Res. 2000; 41:39–51. PMID:10924867
38. Hermann B, Meador K, Gaillard W, Cramer J. Cognition across the lifespan: antiepileptic drugs, epilep-sy, or both? Epilepsy Behav. 2010 Jan; 17(1):1–5. doi:10.1016/j.yebeh.2009.10.019PMID:19931492 39. Helmstaedter C. Cognitive outcome of status epilepticus in adults. Epilepsia. 2007; 48 Suppl 8:85–90.
PMID:18330010
40. Butler C, Zeman A. Recent insights into the impairment of memory in epilepsy: transient epileptic amne-sia, accelerated long-term forgetting and remote memory impairment. Brain. 2008; 131:2243–2263. doi:10.1093/brain/awn127PMID:18669495
41. Äikiä M, Salmenperä T, Partanen K, and Kälviäinen R. Verbal memory in newly diagnosed patients and patients with chronic left temporal lobe epilepsy. Epilepsy Behav. 2001; 2(1):20–27. PMID:12609178 42. Krol J, Loedige I, Filipowicz W. The widespread regulation of microRNA biogenesis, function and
decay. Nat Rev Genet. 2010 Sep; 11(9):597–610. doi:10.1038/nrg2843PMID:20661255
43. Hansen KF, Karelina K, Sakamoto K, Wayman GA, Impey S, Obrietan K, et al. miRNA-132: a dynamic regulator of cognitive capacity. Brain Struct Funct. 2013; 218(3): 817–831. doi: 10.1007/s00429-012-0431-4PMID:22706759
44. Bhatnagar S, Chertkow H, Schipper HM, Yuan Z, Shetty V, Jenkins S, et al. Increased microRNA-34c abundance in Alzheimer's disease circulating blood plasma. Front Mol Neurosci. 2014 Feb 4;7:2. doi:
10.3389/fnmol.2014.00002
45. Boissonneault V, Plante I, Rivest S, Provost P. MicroRNA-298 and MicroRNA-328 Regulate Expres-sion of Mouse beta-Amyloid Precursor Protein-converting Enzyme 1. J Biol Chem. 2009 Jan 23; 284 (4):1971–81. doi:10.1074/jbc.M807530200PMID:18986979
46. Nadiminty N, Tummala R, Lou W, Zhu Y, Zhang J, Chen X, et al. Microrna let-7c suppresses androgen receptor expression and activity via regulation of myc expression in prostate cancer cells. J Biol Chem. 2012 Jan 6; 287(2):1527–37. doi:10.1074/jbc.M111.278705PMID:22128178