Article
Printed in Brazil - ©2016 Sociedade Brasileira de Química0103 - 5053 $6.00+0.00*e-mail: [email protected]
Hybrid Materials Based on Bentonite Functionalized with Amine Groups via the
Hydrolytic Sol-Gel Method
Thales J. Gilberto, Liziane Marçal, Jhonatan M. Silva, Lucas A. Rocha, Katia J. Ciuffi, Emerson H. Faria and Eduardo J. Nassar*
Universidade de Franca, Av. Dr. Armando Salles Oliveira, 201 Pq. Universitário, CP 82, 14404-600 Franca-SP, Brazil
Bentonite is a natural clay that presents characteristics such as good capacity to exchange cations, large specific surface area, large porosity, and possibility to undergo intercalation and/or functionalization. This work reports on bentonite functionalization with organomodified alkoxides. Functionalization afforded hybrid materials displaying desirable properties for adsorption of chromium trivalent ions. Infrared absorption spectroscopy, X-ray powder diffraction, thermal analysis, specific surface area analysis, and adsorption experiments with methylene blue helped to characterize the materials and evaluate their cationic exchange capability. These techniques evidenced functionalization of the Brazilian bentonite. Kinetic and equilibrium experiments on the adsorption of chromium trivalent ions aided determination of the equilibrium time of kinetic adsorption isotherms and revealed whether the functionalized matrices adsorbed chromium trivalent ions. Chromium displayed S1 type adsorption isotherms, which confirmed that adsorption capacity originated from cooperative forces between the adsorbate and the hybrid adsorbents.
Keywords: clay, bentonite, adsorption, hybrid material, amine alkoxide
Introduction
Bentonite or bentonite clay has found wide application in professional drilling, civil engineering, and geology. Basically, it helps to maintain stable holes during drilling by expanding contact with water and forming a gel. Bentonite presents other properties such as very low permeability and high cation exchange capacity, which are important in the area of environmental engineering and these properties render the clay a barrier to heavy metal contaminants.1
Several works have reported on clay modification and on clay adsorption capacity for environmental use as adsorbents.2-12 In addition, clay materials can undergo
intercalation reactions and/or functionalization of its interlayers and/or surface area, to afford hybrid materials. The -OH groups present in the clay edges will react with silane through condensation reactions via the sol-gel method. Nucleophilic attack from the interlayer siloxane hydroxyls or from water in hydrated cations can induce hydrolysis, and silanol and Mg–OH present in lateral edge sites or in clay surface defects can favor condensation.13-15
Clay functionalization with organic compounds can add
new properties to hybrid materials and increase chemical affinity between adsorbent and adsorbate, consolidating their use for environmental purposes.16 Study of natural
clay adsorption capacity and comparison of this capacity with the adsorption capacity of hybrid clay materials can contribute to entrapping contaminants in the physical environment of the clay, thereby enabling treatment of industrial effluents with modified clays.
The use of hybrid organic-inorganic compounds has relied on their enhanced specific properties as compared with the properties of the corresponding unmodified materials. Hybrid materials have promising application in the industry and in scientific research.16-20
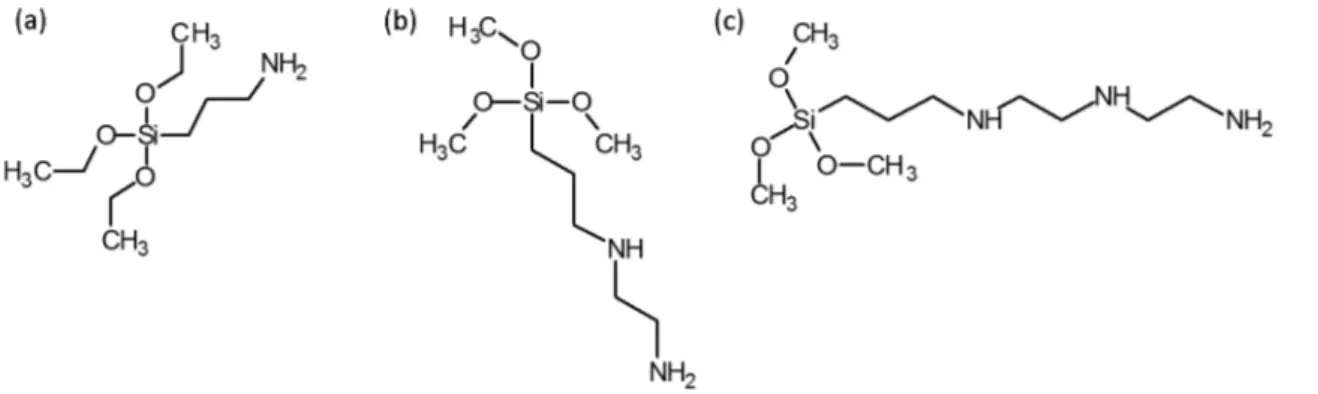
This work studied functionalization of bentonite (BEN) with the organomodified alkoxides (3-aminopropyl) triethoxysilane (APTES), N1-(3-trimethoxysilylpropyl)
diethylenetriamine (TMPT), and N-[3-(trimethoxysilyl)
of the materials and evaluation of their cationic exchange capability (CEC).
Experimental
Bentonite functionalization
The bentonite used in this work was commercially available from the company MI SWACO SA (Boa Vista, Brazil) with the nomenclature Bentonite Drescongel. Distilled water was used in all the experiments. Ethanol and the alkoxides APTS, TMPO and TMPT were purchased from Sigma-Aldrich (Saint Louis, USA). Figure 1 shows the structural formulas of the alkoxides used herein.
The hybrid materials were prepared by the procedure described by the SOL-GEL Group of the University of Franca.21-24 Before functionalization with organosilanes,
BEN was pre-expanded with distilled water. To this end, 5.0 g of clay was added to 100.0 mL of distilled water and vigorously stirred for 1 h. Next, 2.0 mL of one of the alkoxides was added, and the reaction was allowed to proceed under stirring at room temperature for 48 h. The material was then washed with ethanol and water, which was followed by drying at 100 °C for 24 h. The samples were kept in desiccators.
Adsorption by bath method
Kinetic studies were carried out to determine the time of matrix saturation. The studies were conducted in eight test tubes containing 50.0 mg of the adsorbent and 5.0 mL of CrIII
solution pH ca. 6 at a concentration of 0.003 mol L-1. The
test tubes were stirred for 1, 5, 10, 20, 30, 60, and 90 min.
Characterization techniques
Fourier transform infrared absorption spectroscopy (FTIR) was conducted on a Frontier PerkinElmer
spectrometer (New York, USA); the spectra were acquired in the attenuated total reflection (ATR) mode, and the samples were diluted in KBr. To acquire the spectra, the samples were scanned 16 times at a resolution of 4 cm-1,
from 4000 to 500 cm-1.
X-ray diffraction (XRD) patterns of the powder samples were recorded at room temperature on a Rigaku Geigerflex D/max-c diffractometer (Tokyo, Japan) with monochromated Cu Kα radiation (λ = 1.54 Å). The XRD
patterns were recorded in the 2θ range from 3 to 70° at a
resolution of 0.05°. The temperature and humidity of the XRD room was controlled by an air conditioner and a dehumidifier.
Thermogravimetry (TGA) and derivative thermo-gravimetry (DTG) analysis was carried out (Thermal Analyst 2100-TA Instruments SDT 2960 simultaneous DTA-TGA, New Castle, USA) in nitrogen atmosphere at a heating rate of 20 °C min-1, from 25 to 900 °C; powder
samples were employed during the analysis.
Specific surface areas were determined by applying the Brunauer, Emett and Teller (BET) method to the corresponding nitrogen adsorption data at –196 °C, obtained by using a Micrometrics ASAP 2020 physical adsorption analyzer (Norcross, USA). The samples were previously degassed in situ at room temperature for 1 h, at
a pressure lower than 50 µm Hg. The nitrogen adsorption data were obtained by using 0.2 g of the sample.
Electronic spectra of the materials were recorded on a Hewlett-Packard 8453 diode array UV-Vis spectrophotometer (Palo Alto, EUA). Samples were placed in a cell with path length of 1.0 cm.
Cation exchange capacity (CEC) and specific surface (SS) of the material
CEC and SS were determined by the methylene blue method described by Yukselen and Kaya.25 Briefly, 1.0 mL
portions of methylene blue were successively added to the
clay sample until the clay became saturated. Saturation was evident from formation of a blue circle around the solid portion.
Equations 1 and 2 show how to obtain CEC and SS from the volume of methylene blue that was necessary to saturate the sample:
CEC = C × V × 100 / Wa (1)
where CEC = cation exchange capacity (meq per 100.0 g
of dry clay), C = methylene blue concentration (meq L-1),
V = methylene volume (L) and Wa = dry clay mass (g).
SS = Fa × CEC (2)
where SS = specific surface (m2 g-1) and F
a = methylene
blue factor (7.8043).
Results and Discussion
Fourier transform infrared spectroscopy
Figure 2 illustrates the FTIR spectra of commercial bentonite (BEN) and of the functionalized bentonites (BEN-APTS, BEN-TMPT, and BEN-TMPO) investigated in this work.
The spectrum (a) in Figure 2 presents the characteristic vibrational modes of BEN, as discussed in the literature.9,26,27
As for the spectra of BEN-APTS, BEN-TMPT, and BEN-TMPO (spectra b-d in Figure 2), they display bands between 2929 and 2795 cm-1, ascribed to CH/NH groups, and
at 1567 and 1330 cm-1, ascribed to amine groups (NH 2). The
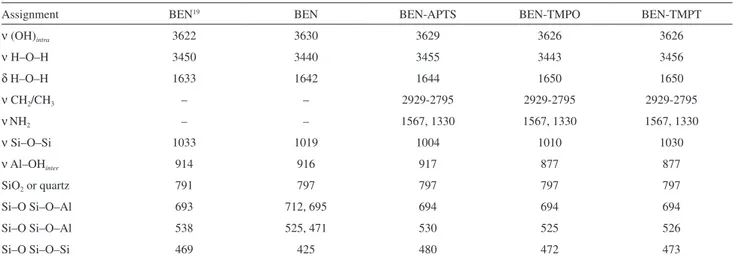
FTIR spectra indicated functionalization of bentonite with the alkoxides. Table 1 lists the vibrational modes present in BEN, BEN-APTS, BEN-TMPT, and BEN-TMPO.
The absorption bands in the region between 3600 and 3400 cm-1 corresponded to –OH stretching. The
peaks arising in the region of 1600 cm-1 corresponded to
deformation of interlayer and adsorbed water.9,27-29 The
bands at 1029 and 790 cm-1 referred to Si–O–Si and Si–O,
respectively, and attested to the presence of a tetrahedral silica layer.30,31
The –OH groups inside and in the edge regions of the clay gave rise to the characteristic infrared –OH bands of BEN at 3630 and 3439 cm-1. These bands shifted to
3629 and 3454 cm-1, 3626 and 3442 cm-1, and 3626 and
3455 cm-1 in the spectra of BEN-APTS, BEN-TMPO,
and BEN-TMPT, respectively, which evidenced BEN functionalization. The lower intensity of these bands was yet another indication of water removal from BEN during the functionalization process.32
The Al–OH vibration modes were shifted in the case of the samples BEN-TMPO and BEN-TMPT, which was caused by the presence of silane molecules in these
Table 1. Assignments of the FTIR bands present in the spectra of commercial and functionalized bentonites
Assignment BEN19 BEN BEN-APTS BEN-TMPO BEN-TMPT
ν (OH)intra 3622 3630 3629 3626 3626
ν H–O–H 3450 3440 3455 3443 3456
δ H–O–H 1633 1642 1644 1650 1650
ν CH2/CH3 – – 2929-2795 2929-2795 2929-2795
νNH2 – – 1567, 1330 1567, 1330 1567, 1330
ν Si–O–Si 1033 1019 1004 1010 1030
ν Al–OHinter 914 916 917 877 877
SiO2 or quartz 791 797 797 797 797
Si–O Si–O–Al 693 712, 695 694 694 694
Si–O Si–O–Al 538 525, 471 530 525 526
Si–O Si–O–Si 469 425 480 472 473
4000 3500 3000 2500 2000 1500 1000 500
60 70 80 90 100
T
ransmittance / %
Wavenumber / cm-1
(a) (b) (c)
(d) 2929-2795
1330 1567
Figure 2. FTIR spectra of (a) BEN and of the functionalized bentonites (b) BEN-APTS; (c) BEN-TMPT; and (d) BEN-TMPO.
4000 3500 3000 2500 2000 1500 1000 500
60 70 80 90 100
T
ransmittance / %
Wavenumber / cm-1
(a) (b) (c)
(d) 2929-2795
materials. The hydrogen bonds from the amine groups of TMPO and TMPT and/or the –OH groups arising from incomplete hydrolysis of these alkoxides can influence the Al–OH and/or Mg–OH bonding. These shifts do not occur in the case of BEN-APTS because APTS contains only one amine group, whereas TMPO and TMPT present two and three amine groups, respectively.
X-ray diffraction
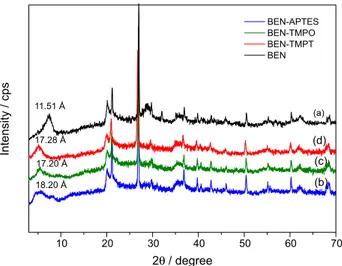
Figure 3 shows the XRD patterns of BEN, BEN-APTS, BEN-TMPT, and BEN-TMPO.
The diffractograms show the presence of montmorillonite (2θ = 7.56° and 19.83°card 2-9 Crystallographica
Search-Match) and quartz (2θ = 26.47°card 1-649 Crystallographica
Search-Match), typical of this type of clay in which smectite is the predominant clay mineral.27,33,34 The interlayer
distance was calculated by Bragg’s law (nλ = 2dsenθ).
BEN gave a smaller interlayer distance than the distance described by Vieira et al.35 (around 11.51 and 15 Å,
respectively). Other authors found an interlayer distance of 8 and 9 Å when they used 3-mercaptopropyltrimethoxy silane27 and pillaring with Al and Co36 to modify bentonite,
respectively. The bentonite source and the functionalizing agent probably accounted for the different regions of the clays, namely interlayer, edge, and surface, evidenced by FTIR and XRD results regarding distance.
BEN presented a basal spacing of 11.51 Å, which changed to 18.20, 17.50, and 17.28 Å after functionalization with the alkoxides APTES, TMPO, and TMPT, respectively. The larger basal spacing in BEN-APTES, BEN-TMPO, and BEN-TMPT indicated that the alkoxide occupied the interlayer space in the clay. The other characteristic BEN
peaks remained unaffected, revealing that functionalization did not modify the structure of the clay.36
Thermogravimetric curves
Thermogravimetric analysis helped to investigate decomposition of the organic compounds incorporated into the bentonite matrix and confirmed the results from the FTIR spectra and XRD patterns. Figures 4 and 5 show the thermogravimetric curves and the corresponding derivative curves obtained for the samples BEN, BEN-APTS, BEN-TMPT, and BEN-TMPO.
The TGA and DTG curves presented in Figures 4 and 5 showed the weight loss stages experienced by BEN and the functionalized bentonites. The first mass loss occurred below 250 °C. It was ascribed to loss of physically adsorbed water and corresponded to 11.0, 9.7, 11.9, and 10.5% weight loss for BEN, BEN-APTES, BEN-TMPO, and BEN-TMPT, respectively. The second mass loss, around
10 20 30 40 50 60 70
11.51 Å
17.28 Å
17.20 Å
18.20 Å
Intensity / cps
2 / degreeθ
BEN-APTES BEN-TMPO BEN-TMPT BEN (a) (d) (c) (b)
Figure 3. XRD patterns of (a) BEN; (b) BEN-APTS; (c) BEN-TMPO; and (d) BEN-TMPT.
0 200 400 600 800 1000
80 82 84 86 88 90 92 94 96 98 100 102 (a) (b) (c) (d)
Mass / %
Temperature / °C
Figure 4. TGA curves obtained for (a) BEN; (b) BEN-APTES; (c) BEN-TMPT; and (d) BEN-TMPO.
0 200 400 600 800 1000
0 200 400 600 800 1000
0 200 400 600 800 1000
0 200 400 600 800 1000
0.0 0.2 0.4 0.6 0.8 1.0
Temperature / °C
Derivative mass / (% °C
) –1 (a) (b) (c) (d)
Figure 5. DTG curves obtained for (a) BEN; (b) BEN-APTES; (c) BEN-TMPT; and (d) BEN-TMPO.
10 20 30 40 50 60 70
11.51 Å
17.28 Å
17.20 Å
18.20 Å
Intensity / cps
2 / degreeθ
BEN-APTES BEN-TMPO BEN-TMPT BEN (a) (d) (c) (b)
0 200 400 600 800 1000
80 82 84 86 88 90 92 94 96 98 100 102 (a) (b) (c) (d)
Mass / %
Temperature / °C
0 200 400 600 800 1000
0 200 400 600 800 1000
0 200 400 600 800 1000
0 200 400 600 800 1000
0.0 0.2 0.4 0.6 0.8 1.0
Temperature / °C
Derivative mass / (% °C
285 oC, was assigned to loss of adsorbed water and release
of exchangeable water coordinated to cations.37 The main
weight loss occurred at temperatures above 250 oC. BEN
lost 4.3% of its mass as a result of dehydroxylation. As for the functionalized bentonites, BEN-APTS, BEN-TMPO, BEN-TMPT lost 6.5, 13.1, and 15.1% of their mass in this stage, respectively, because of decomposition of the organic groups and dehydroxylation. Knowing that dehydroxylation corresponded to ca. 4% mass loss in commercial bentonite, functionalization corresponded to 2.5, 9.1, and 11.1% of the samples BEN-APTS, BEN-TMPO, and BEN-TMPT, respectively. Therefore, functionalization with di- and triamine silane precursors present a higher percentage that can be ascribed to silane precursors.
Surface area, cation exchange capacity (CEC), and specific surface (SS)
The surface area and porosity of the materials was determined by BET analysis. According to IUPAC (International Union of Pure and Applied Chemistry), classification of the hysteresis loops refers to the texture of a material. In this case, the materials belonged to class H1, associated with porous materials that consisted of well-defined uniform cylindrical pores or nearly compact agglomerate spheres. Also according to IUPAC, type IV isotherms correspond to a mesoporous material.38 Table 2
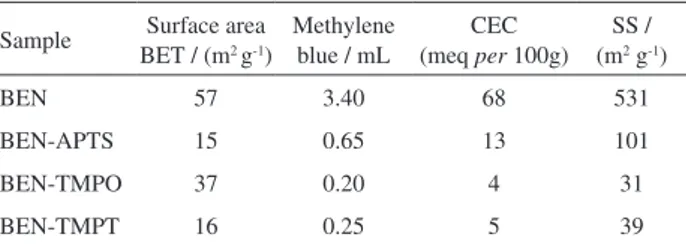
presents the surface areas, CEC, and SS values obtained for BEN, BEN-APTS, BEN-TMPT, and BEN-TMPO.
Literature works have shown that the surface area of bentonite can vary. Bentonite is not pure clay. In fact, in its composition there is a mixture of clay minerals of different types like tetrahedral-octahedral-tetrahedral (T-O-T) clays such as montmorillonite, hectorite, and others, and quartz, the main component of this clay. The proportion of these minerals in bentonite varies depending on the deposit. The surface area obtained in this work agrees with surface area values reported in other papers.28,30,35,39
The surface area of BEN-APTS, BEN-TMPT, and BEN-TMPO decreased as compared with the surface area of BEN. This happened probably because the organic
compounds occupied active bentonite sites, which reduced the number of active sites available for gas adsorption. The increase in basal spacing was not directly related to the increase in surface area.28,30,40 The surface area results
corroborated the XRD, FTIR, and TGA data and attested to clay functionalization.
Table 2 also shows the specific surface area measured by the N2 adsorption and the methylene blue (MB) methods. N2
adsorption gave lower surface area values than the surface area values measured by the MB method. This difference probably resulted from the weak van der Waals bonding established between the interlayer organic compounds under the dry conditions applied during gas adsorption measurements. The gas molecules were not able to enter the tightly bound bentonite layers, so only these molecules only adsorbed onto the external clay surface.
In contrast, the MB method employed wet conditions. Hence, ions or water intercalated into the inner bentonite layers and allowed for measurement of the external and internal surface area, as discussed in the literature.25 One
literature paper has also proposed that the negative charge of Si–O interacts with the positive charge of the methylene blue ion.41 Compared with BEN, the smaller surface areas
of BEN-APTS, BEN-TMPO, and BEN-TMPT measured by the N2 adsorption and MB methods attested to BEN
functionalization.
CEC obtained by the MB method provided a measure of the cation exchange capacity of the clays.42 CEC obtained for
BEN was higher than CEC obtained for the functionalized bentonites. Therefore, the presence of alkoxides in BEN reduced the cation exchange capacity of the clay, probably because the silanes molecules on the edge of the clay blocked access to the interlayer space and reduced the cation exchange capacity, as observed by us in another work.13
The Brazilian bentonite clay from Paraíba State, Brazil has CEC of about 87.53 meq per 100 g of clay as estimated
by ammonium cation exchange.43 Another work has reported
CEC of 74 meq per 100 g of clay for bentonite on the basis
of flame emission spectrophotometry.44 The CEC value of
68 meq per 100 g of clay obtained here can be attributed to
the fact that BEN was not submitted to any treatment.
Adsorption study
Kinetics
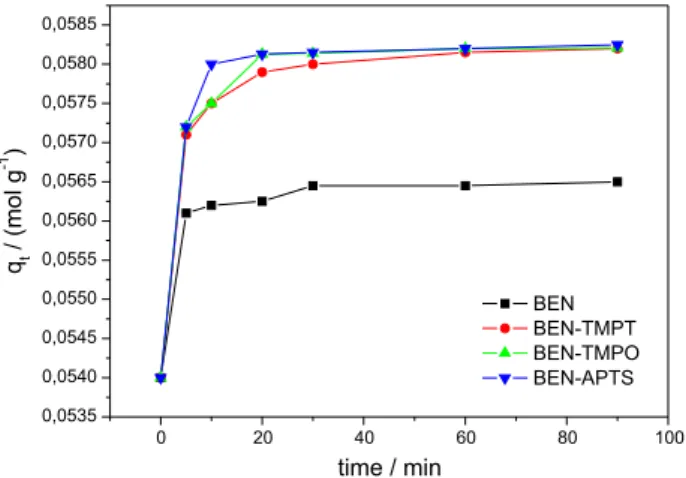
Figure 6 illustrates the adsorption kinetics study conducted for BEN, BEN-APTS, BEN-TMPT, and BEN-TMPO at CrIII ion concentration of 0.06 mol L-1.
Adsorption reached equilibrium at 30 min for all the adsorbents. At this point, the amounts of CrIII ions being
adsorbed and desorbed were the same, which meant that
Table 2. Surface area, CEC, and SS values obtained for commercial
bentonite and functionalized bentonites
Sample Surface area BET / (m2 g-1)
Methylene blue / mL
CEC (meq per 100g)
SS / (m2 g-1)
BEN 57 3.40 68 531
BEN-APTS 15 0.65 13 101
BEN-TMPO 37 0.20 4 31
the system achieved a state of dynamic equilibrium.45,46
Figure 6 showed that the functionalized samples presented increased adsorption capacity as compared with BEN. The presence of alkoxides in BEN, BEN-APTS, BEN-TMPT, and BEN-TMPO accounted for the increased adsorption capacity. The alkoxide type did not influence the amount of adsorbed CrIII ions, which indicated that only the terminal
amino groups acted to remove CrIII. The mechanism of
adsorption may have involved exchangeable cations and amine groups. Indeed, FTIR analysis had revealed changes in –NH2 stretching, confirming that CrIII interacted with
anime groups.
The increasing amount of amine groups in the alkoxide was not directly proportional to the amount of CrIII ions
adsorbed onto bentonite. The adosrption capacity of the samples with one, two, and three amine groups increased by 3%, which indicated that only the terminal amine groups bound to CrIII ions.
Adsorption isotherms
The qualitative and quantitative classification of isotherms depends on the isotherm shape, determines the mechanism of adsorption, and reflects the nature of adsorption. According to the models proposed by Giles et al.,45 the isotherm obtained for BEN corresponded
to an isotherm of the L-3 type, whereas the isotherms achieved for BEN-APTS, BEN-TMPT, and BEN-TMPO were of the S2 type (Langmuir isotherm). L-type isotherms reflect relatively high affinity of the metal for the clay surface.47,48 According to the model proposed by Langmuir,
a CrIII monolayer adsorbed onto the sites homogeneously
distributed on the surface of solid BEN. Regarding BEN-APTS, BEN-TMPT, and BEN-TMPO, the model pointed to a spherical site where cation exchange improved in the presence of the alkoxides APTS/TMPO/TMPT.
At CrIII concentrations above 0.015 mol L-1, saturation
started, which corresponded to formation of a second monolayer. This agreed with the proposed theoretical model because adsorption of the metal reached equilibrium. Hamdaoui and Nafrechoux46 and Kocaoba49 verified
similar behavior for other functionalized materials in which the functionalization process did not significantly alter the adsorption mechanism. As displayed in Table 3, the quantitative results revealed that functionalization promoted CrIII adsorption: BEN-APTS, BEN-TMPO, and
BEN-TMPT had higher qe than BEN. Indeed, the presence
of functional groups (amines) in the basal spacing of natural clays from the smectite group improved the cation exchange mechanism. According to the Pearson principle, the NH2 group is a soft base and can effectively interact
with CrIII ions, which are hard acids. This account for
the high affinity constant of the complex obtained after the adsorption process (BEN-NH2-CrIII) and justifies the
increased maximum adsorption capacity of BEN-APTS, BEN-TMPO, and BEN-TMPT.
Adsorption efficiency
Figure 7 illustrates the adsorption efficiency results for BEN, BEN-APTS, BEN-TMPO and BEN-TMPT.
The concentration maximum of the experimental isotherm allowed for calculation of the removal rate. CrIII had
Ben Ben-APTES Ben-TMPO Ben-TMPT 0
10 20 30 40 50 60 70 80
Cr
removal / %
III
Adsorbent
Figure 7. Percentage of CrIII removal by BEN, BEN-APTES, BEN-TMPO and BEN-TMPT.
0 20 40 60 80 100
0,0535 0,0540 0,0545 0,0550 0,0555 0,0560 0,0565 0,0570 0,0575 0,0580 0,0585
q
/ (mol g
)
t
-1
time / min
BEN BEN-TMPT BEN-TMPO BEN-APTS
Figure 6. Adsorption kinetics study for BEN, BEN-APTS, BEN-TMPO,
and BEN-TMPT. Experiments were conducted in 0.06 mol L-1 CrIII solution.
Table 3. Maximum adsorption capacity (qe) obtained from the experimental isotherms of BEN, APTS, TMPO, and BEN-TMPT in the presence of CrIII solution
Adsorbent qe / (mol g-1)
BEN 0.08850
BEN-APTS 0.09624
BEN-TMPO 0.09761
BEN-TMPT 0.09739
Ben Ben-APTES Ben-TMPO Ben-TMPT 0
10 20 30 40 50 60 70 80
Cr
removal / %
III
Adsorbent
0 20 40 60 80 100
0,0535 0,0540 0,0545 0,0550 0,0555 0,0560 0,0565 0,0570 0,0575 0,0580 0,0585
q
/ (mol g
)
t
-1
time / min
great affinity for the samples. Functionalization of BEN with alkoxides bearing NH2 groups yielded better results: removal
rates of up to 74%, as compared with 50% provided by BEN.
Conclusion
Commercial bentonite, an inexpensive material successfully employed for environmental remediation purposes, can be functionalized with alkoxides, to yield hybrid materials with potential application in Cr3+ ions
adsorption, as confirmed by XRD, FTIR, TGA/DTG, and BET characterization techniques. The present results expand the possibility of applying hybrid technology in several areas of science and materials technology. Functionalization increases the capacity of bentonite to retain CrIII from 50 to approximately 70%, which paves
the way for new uses of this clay.
In conclusion, a natural clay submitted to no previous purification and treated with alkoxide can be used to remove metal ions from effluents. Although the efficiency of the materials studied herein to retain CrIII ions is small, this is by
no means a discouraging result. This is an initial work and many parameters remain to be investigated and optimized.
Acknowledgments
The authors acknowledge Conselho Nacional de Desenvolvimento Científico e Tecnológico (CNPq), Coordenação de Aperfeiçoamento Pessoal de Nível Superior (CAPES) and Fundação de Amaparo a Pesquisa do Estado de São Paulo (FAPESP) for support of this work.
References
1. Afzal, S.; Shahzada, K.; Fahad, M.; Saeed, S.; Ashraf, M.;
Constr. Build. Mater.2014, 66, 403.
2. Gupta, S. S.; Bhattacharyy, K. G.; Adv. Colloid Interface Sci. 2011, 162, 39.
3. de Faria, E. H.; Ciuffi, K. J.; Marçal, L.; Rocha, L. A.; Calefi, P. S.; Nassar, E. J.; Pepe, I.; Rocha, Z.; Vicente, M. A.; Trujillano, R.; Gil, A.; Korili, S.; ACS Appl. Mater. Interfaces 2012, 4, 2525.
4. Leonel, E. C.; de Faria, E. H.; Pimentel, R. C.; Nassar, E. J.; Ciuffi, K. J.; dos Reis, M. J.; Calefi, P. S.; Quim. Nova2012, 35, 1407.
5. Sarakha, L.; Forano, C.; Boutinaud, P.; Opt. Mater. (Amsterdam, Neth.)2009, 31, 562.
6. Bizaia, N.; de Faria, E. H.; Ricci, G. P.; Calefi, P. S.; Nassar, E. J.; Castro, K. A. D. F.; Nakagaki, S.; Ciuffi, K. J.; Trujillano, R.; Vicente, M. A.; Gil, A.; Korili, S.; ACS Appl. Mater. Interfaces 2009, 1, 2667.
7. Avila, L. R.; de Faria, E. H.; Ciuffi, K. J.; Nassar, E. J.; Vicente, M. A.; Trujillano, R.; Calefi, P. S.; J. Colloid Interface Sci.2010, 341, 186.
8. Yang, S.-K.; Nam, J.-W.; Kim, Y.; Bull. Korean Chem. Soc. 2014, 35, 1218.
9. Zhu, H.; Du, M. L.; Zou, M. L.; Xu, C. S.; Fua, Y. Q.; Dalton Trans.2012, 41, 10465.
10. Feuillie, C.; Daniel, I.; Michot, L. J.; Pedreira-Segade, U.;
Geochim. Cosmochim. Acta2013, 120, 97.
11. Tireli, A. A.; Marcos, F. C. F.; Oliveira, L. F.; Guimarães, I. R.; Guerreiro, M. C.; Silva, J. P.; Appl. Clay Sci.2014, 97-98, 1. 12. Guimarães, A. M. F.; Ciminelli, V. S. T.; Vasconcelos, W. L.;
Appl. Clay Sci.2009, 42, 410.
13. Marçal, L.; de Faria, E. H.; Nassar, E. J.; Trujillano, R.; Martín, N.; Vicente, M. A.; Rives, V.; Gil, A.; Korili, S. A.; Ciuffi, K. J.; ACS Appl. Mater. Interfaces2015, 7, 10853.
14. Bandeira, L. C.; Calefi, P. S.; Ciuffi, K. J.; Nassar, E. J.; Vicente, M. A.; Trujillano, R.; Polym. Int.2012, 61, 1170.
15. Avila, L. R.; de Faria, E. H.; Ciuffi, K. J.; Nassar, E. J.; Calefi, P. S.; Vicente, M. A.; Trujillano, R.; J. Colloid Inter. Sci.2010, 341,186.
16. Sanchez, C.; Boissiere, C.; Cassaignon, S.; Chaneac, C.; Durupthy, O.; Faustini, M.; Grosso, D.; Laberty-Robert, C.; Nicole, L.; Portehault, D.; Ribot, F.; Rozes, L.; Sassoye, C.;
Chem. Mater.2014, 26, 221.
17. de Faria, E. H.; Lima, O. J.; Ciuffi, K. J.; Nassar, E. J.; Vicente, M. A.; Trujillano, R.; Calefi, P. S.; J. Colloid Inter. Sci.2009,
335, 210.
18. Esteves, A. C. C.; Barros-Timmons, A.; Trindade, T.; Quim. Nova 2004, 27, 798.
19. Sanchez, C.; Rozes, L.; Ribot, F.; Laberty-Robert, C.; Grosso, D.; Sassoye, C.; Boissiere, C.; Nicole, L.; C. R. Chim. 2010, 13, 3.
20. Sanchez, C.; Belleville, P.; Popalld M.; Nicole, L.; Chem. Soc. Rev.2011, 40, 696.
21. Rogez, G.; Massobrio, C.; Rabu, P.; Drillon, M.; Chem. Soc. Rev.2011, 40, 1031.
22. Marçal, L.; de Faria, E. H.; Saltarelli, M.; Calefi, P. S.; Nassar, E. J.; Ciuffi, K. J.; Trujillano, R.; Vicente, M. A.; Korili, S. A.; Gil, A.; Ind. Eng. Chem. Res.2011, 50, 239.
23. Nassar, E. J.; Nassor, E. C. O.; Ávila, L. R.; Pereira, P. F. S.; Cestari, A.; Luz, L. M.; Ciuffi, K. J.; Calefi, P. S.; J. Sol-Gel Sci. Technol.2007, 43, 21.
24. Nassar, E. J.; Messaddeq, Y.; Ribeiro, S. J. L.; Quim. Nova2002, 25, 27.
25. Yukselen, Y.; Kaya, A.; Eng. Geol.2008, 102, 38.
26. Karapinar, N.; Donat, R.; Desalination2009, 249, 123. 27. Sasikala, S.; Meenakshi, S.; Bhat, S. D.; Sahu, A. K.;
Electrochim. Acta2014, 135, 232.
29. Dogan, M.; Turhan, Y.; Alkan, M.; Namli, H.; Turan, P.; Demirbas, O.; Desalination2008, 230, 248.
30. Li, J.; Miao, X.; Hao, Y.; Zhao, J.; Sun, X.; Wang, L.; J. Colloid Inter. Sci.2008, 318, 309.
31. Nassar, E. J.; Neri, C. R.; Calefi, P. S.; Serra, O. A.; J. Non-Cryst. Solids1999, 247, 124.
32. de Faria, E. H.; Ciuffi, K. J.; Nassar, E. J.; Vicente, M. A.; Trujillano, R.; Calefi, P. S.; Appl. Clay Sci.2010, 48, 516.
33. Bertella, F.; Pergher, S. B. C.; Microporous Mesoporous Mater. 2015, 201, 116.
34. Bertagnolli, C.; da Silva, M. G. C.; Mat. Res. 2012, 15, 253. 35. Vieira, M. G. A.; Almeida Neto, A. F.; Gimenes, M. L.; Silva,
M. G. C.; J. Hazard. Mater. 2010, 177, 362.
36. Leite, I. F.; Raposo, C. M. O.; Silva, S. M. L.; Cerâmica 2008, 54, 303.
37. Zivica, V.; Palou, M. T.; Composites, Part B2015, 68, 436.
38. Lowell, S.; Shields, J. E.; Thomas, M. A.; Thommes, M.;
Characterization of Porous Solids and Powders: Surface Area,
Pore Size and Density, 1st ed.; Klumer Academic Publishers:
Netherlands, 2004.
39. Eren, E.; J. Hazard. Mater. 2009, 165, 63.
40. Ijagbemi, C. O.; Baek, M. H.; Kim, D. S.; J. Hazard. Mater. 2010, 174, 746.
41. El Miz, M.; Akichouh, H.; Salhi, S.; El Bachiri, A.; Tahani, A.;
IOSR J. Appl. Chem. 2014, 7, 60.
42. Hang, P. T.; Brindley, G. W.; Clays Clay Miner. 1970, 18, 203. 43. Bertagnolli, C.; da Silva, M. G. C.; Mat. Res.2012, 15, 253.
44. Guarino, A. W. S.; Gil, R. A. S. S.; Polivanov, H.; Menezes, S. M. C.; J. Braz. Chem. Soc.1997, 8, 581.
45. Giles, C. H.; Smith, D.; Huitson, A.; J. Colloid Inter. Sci.1974,
3, 755.
46. Hamdaoui, O.; Nafrechoux, E.; J. Hazard. Mater.2007, 147, 381.
47. Veeresha, H.; Tripathya, S.; Chaudhuria, D.; Hartb, B. R.; Powellb, M. A.; Appl. Geochem.2003, 18, 1723.
48. Yun, L.; Xing, S.; Qiming, X.; Haidong, C.; Huixian, Z.; Shixiang, G.; J. Hazard. Mater.2006, B137, 1149.
49. Kacaoba, S.; J. Hazard. Mater.2007, 147, 488.
Submitted: October 20, 2015
Published online: December 10, 2015