THIS REPORT WAS PREPARED BY TIAGO PINHO, A MASTERS IN FINANCE STUDENT OF THE NOVA SCHOOL OF BUSINESS AND
ECONOMICS, EXCLUSIVELY FOR ACADEMIC PURPOSES.THIS REPORT WAS SUPERVISED BY ROSÁRIO ANDRÉ WHO REVIEWED THE
M
ASTERS IN
F
INANCE
EQUITY RESEARCH
Doubt on Brazil
Executing well but competition is fierce
Our recommendation for Portugal Telecom is for BUY, given our price target FY2013 of 4.75 EUR, setting an upside potential of 22.7%. Our valuation implies a 5.5 EV/EBITDA2012.
For 2012, we estimate domestic revenues of 2,738 million EUR, a 5.5% (y.o.y) decrease. Macroeconomic conditions will continue to penalize not only the Personal and Enterprise segments, but also the Residential, which had been showing resilience in the past. Domestic CAPEX should decrease now that the company has completed its FTTH and 4G LTE rollout strategy.
PT’s domestic triple-play clients grew more than 27% in 2012 (y.o.y), easing market share loss on the fixed phone sector and sharply increasing the pay-TV customer base.
Oi increased its number of wireline accesses for the first time since 2009, boosted by legislation changes that now allow the company to offer new service bundles. However, revenues should keep stable due to fierce competition, which is driving down the prices of services. Oi’s CAPEX is expected to continue at a rate of 6 billion BRL per year, until 2015.
Company Description
Portugal Telecom (PT) is the largest telecommunications company operating in Portugal, providing wireline and mobile services. It is also present in Brazil, through a 25.6% stake in Oi, in addition to a number of other countries in Africa and Asia.
P
ORTUGAL
T
ELECOM
C
OMPANY
R
EPORT
T
ELECOM
07
J
ANUARY2013
S
TUDENT
:
T
IAGO
P
INHO
[email protected]
Recommendation: BUY
vs. Previous Recommendation -
Price Target FY13: 4.75 EUR
vs. Previous Price Target -
Price (as of 04-Jan-13) 3.87 EUR
Bloomberg: PTC.PL, Reuters: PTC.LS
52-week range (EUR) 3.00 – 4.56
Market Cap (EUR million) 3,470
Outstanding shares (million) 896.51
Source: Bloomberg
Source: Bloomberg
Key Financials (EUR million) 2011 2012E 2013F
Revenues 6,147 6,867 6,626
EBITDA 2,129 2,269 2,183
EBITDA margin 34.6% 33.0% 32.9%
EBIT 744 743 704
EBIT margin 12.1% 10.8% 10.6%
Net Income 423 239 187
Net Debt 6,613 7,716 7,407
Net Debt/EBITDA 3.1 3.4 3.4
Gross Debt/EBITDA 5.8 5.3 4.9
EV/EBITDA 5.9 5.5 5.7
EV/EBIT 16.8 16.8 17.8
P/E 10.1 17.8 22.8
EPS (EUR) 0.47 0.27 0.21
Source: Company reports, analyst’s estimates
0.0 20.0 40.0 60.0 80.0 100.0 120.0
Jan/12 Mar/12 May/12 Jul/12 Sep/12 Nov/12 Jan/13 Portugal Telecom vs. PSI 20 Index
PORTUGAL TELECOM COMPANY REPORT
Table of Contents
Valuation ... 3
Company overview ... 6
Company description... 6
Shareholder structure ... 6
Portuguese operations ... 8
Business description ... 8
Residential ... 8
Personal ... 12
Enterprise ... 15
CAPEX & NGN ... 16
Financial data ... 17
Brazil
–
Oi ... 18
Business description ... 18
Residential ... 18
Personal ... 22
Enterprise ... 23
CAPEX & operating margins ... 24
Financial data ... 25
M&A ZON and Sonaecom ... 26
Comparables ... 27
Conclusion ... 28
Financial statements ... 29
PORTUGAL TELECOM COMPANY REPORT
Valuation
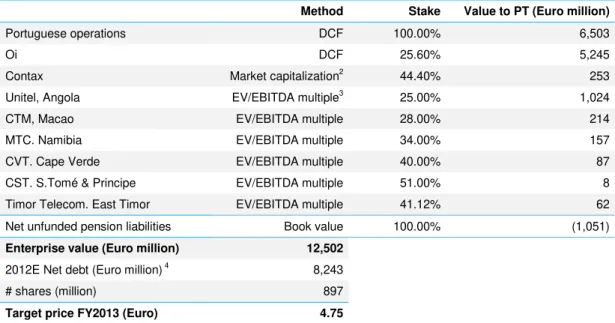
Using Sum of the Parts (SOP) we have reached a price target FY2013 of 4.75EUR, 22.7% above the 3.87EUR closing price as of 4th of January.
Both Portuguese operations and Oi were valued using WACC1 Discounted Cash Flow (DCF) models, with a 5 year (2013 to 2017) explicit forecast period, using constant prices and real growth rates. After 2017, a perpetuity with a real constant growth rate was applied. In the case of Oi, projections were made in Brazilian Real, and afterwards each year’s free cash flow was converted to Euros, using exchange rates from Table 1. Portuguese operations forecasts were directly made in Euros. Contax was valued through market capitalization, and the remaining international assets using EV/EBITDA multiples.
Table 2 presents the valuation summary and Table 3 the inputs for the DCF models.
Table 1 - Exchange rates
FY2011 FY2012 FY2013 FY2014 FY2015 FY2016 FY2017
EUR/BRL 2.416 2.316 2.410 2.575 2.366 2.417 2.569
Source: IMF, analyst's estimates
Table 2 - Valuation summary
Method Stake Value to PT (Euro million)
Portuguese operations DCF 100.00% 6,503
Oi DCF 25.60% 5,245
Contax Market capitalization2 44.40% 253
Unitel, Angola EV/EBITDA multiple3
25.00% 1,024
CTM, Macao EV/EBITDA multiple 28.00% 214
MTC. Namibia EV/EBITDA multiple 34.00% 157
CVT. Cape Verde EV/EBITDA multiple 40.00% 87
CST. S.Tomé & Principe EV/EBITDA multiple 51.00% 8
Timor Telecom. East Timor EV/EBITDA multiple 41.12% 62
Net unfunded pension liabilities Book value 100.00% (1,051)
Enterprise value (Euro million) 12,502
2012E Net debt (Euro million) 4 8,243
# shares (million) 897
Target price FY2013 (Euro) 4.75
Source: Company reports, Bloomberg, analyst’s estimates
1
Weighted Average Cost of Capital 2
Market value from mid-December 3
5.4x EV/EBITDA taken from industry comparables from that geography
4Estimated market value of debt is 12,481 million EUR; according to company reports, 31% of PT’s total debt is from Brazil (Oi
PORTUGAL TELECOM COMPANY REPORT
Table 3 - DCF inputs
Portugal Brazil - Oi
Capital structure target5
Equity 40.0% 40.0%
Debt 60.0% 60.0%
Risk-free rate6
2.6% 5.6%
Market risk premium7 6.0% 6.0%
Beta8
1.67 2.06
Industry Beta9 1.34 1.34
Country Beta10 1.25 1.54
Cost of equity11 12.6% 18.0%
Cost of debt12
8.7% 11.7%
Tax rate 29.5% 34.0%
After-tax cost of debt 6.1% 7.7%
WACC 8.7% 11.8%
g13
0.5% 1.0%
Source: Analyst's estimates
5
Implied D/E of 1.5; in the last 3 years PT had an average D/E ratio of 1.9 while industry average was 0.8; we have estimated PT’s target capital structure using mean reversion (1/3 industry average * 2/3 PT’s historical)
6
Average between the rate of 10y German generic bunds (last 3 years monthly average) and 10y Euro-swap rate (last 3 years monthly average); in the case of Brazil this value was adjusted using a 1.03 inflation differential: [ (1 + 2.6%) * 1.03 - 1 ]
7
Aswath Damodaran 2012 Equity Risk Premiums: January 2012 implied premium in expected return on stocks 8
Industry beta x Country beta 9
Computed by regressing returns of comparables against MSCI World index, last 3 years of weekly data, unlevering each one using ( ) , computing the median, and relevering using PT’s capital target and tax rate
10
Achieved by regressing the returns of PSI 20 (Portugal) and IBOV (Brazil) against MSCI World Index, last 3 years of weekly data 11
Capital Asset Pricing Model 12
; default spread of 6.9% is the last 2 years average on PT 10y CDS; probability of default of 2.1%; 70% recovery rate
13
Real growth rate
28% 26%
72% 74%
Portuguese Operations
Oi Figure 2 - Enterprise value split
EV 2013-2017 EV Perpetuity
Source: Analyst’s estimates Portuguese
operations 54% Oi
32% Unitel
7%
Others 6%
Figure 1 - Enterprise value per business operation
PORTUGAL TELECOM COMPANY REPORT
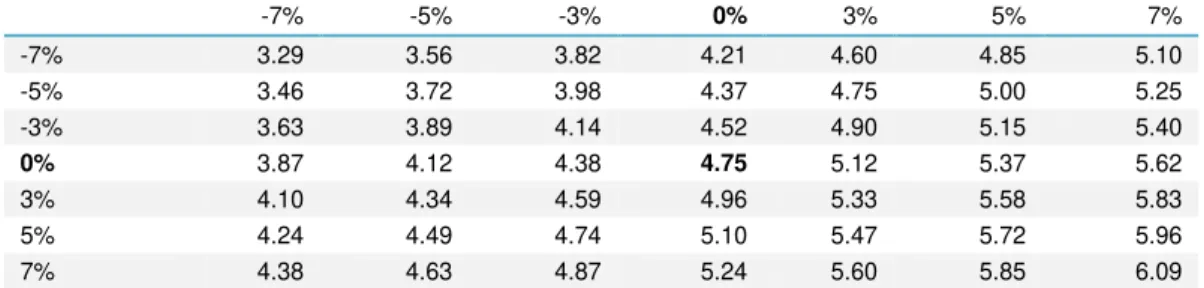
We provide sensitivity analysis on WACC and g of both Portuguese operations (see Table 4) and Oi (see Table 5).
Also, with the goal of understanding how our valuation reacts to different
revenues’ forecasts, we decided to provide sensitivity analysis on Portuguese and Oi’s operating revenues (see Table 6). For example, considering 7% lower revenues in each year between 2013 and 2017, for both Portuguese operations and Oi, PT’s share price drops from 4.75 to 3.29 EUR.
Table 4 - Sensitivity analysis on Portuguese operations' WACC and growth rate
4.7503974 7.00% 8.00% 8.70% 10.00% 11.00% 12.00%
0.30% 6.40 5.26 4.62 3.69 3.12 2.65
0.50% 6.62 5.42 4.75 3.78 3.20 2.71
0.80% 6.98 5.68 4.96 3.94 3.32 2.81
1.50% 7.98 6.39 5.53 4.34 3.63 3.07
Source : Analyst’s estimates
Table 5 - Sensitivity analysis on Oi's WACC and growth rate
4.75 9.00% 10.00% 11.80% 12.00% 13.00%
0.50% 6.56 5.70 4.54 4.44 3.96
1.00% 6.98 6.02 4.75 4.64 4.13
1.20% 7.15 6.16 4.84 4.73 4.20
1.50% 7.44 6.38 4.98 4.86 4.31
2.00% 7.97 6.78 5.24 5.11 4.51
3.00% 9.31 7.75 5.84 5.68 4.96
Source : Analyst’s estimates
Table 6 - Sensitivity analysis on Portuguese operations' (rows) and Oi's (columns) operating revenues
4.75 -7% -5% -3% 0% 3% 5% 7%
-7% 3.29 3.56 3.82 4.21 4.60 4.85 5.10
-5% 3.46 3.72 3.98 4.37 4.75 5.00 5.25
-3% 3.63 3.89 4.14 4.52 4.90 5.15 5.40
0% 3.87 4.12 4.38 4.75 5.12 5.37 5.62
3% 4.10 4.34 4.59 4.96 5.33 5.58 5.83
5% 4.24 4.49 4.74 5.10 5.47 5.72 5.96
7% 4.38 4.63 4.87 5.24 5.60 5.85 6.09
PORTUGAL TELECOM COMPANY REPORT
Company overview
Company description
Portugal Telecom (PT) is a global telecommunications company that offers fixed, mobile, multimedia, data and corporate solutions. PT has a strong presence in Portugal and Brazil, but it also operates in Africa (Angola, Cape Verde, Guinea-Bissau, Kenya, Mozambique, Namibia, and São Tomé and Príncipe) and Asia (China and Timor-Leste).
More precisely, PT holds a 25.6% participation in the Brazilian Oi14 and 44.4% in Contax15– its most relevant international presences. It has other smaller, but also important, stakes of 75%, 28% and 41.12% in the Africatel16, CTM (Macao) and Timor Telecom (Timor-Leste), respectively.
Until 1994, PT was the only company operating in the Portuguese telecommunications sector, being fully controlled by the government. The
“monopoly” was gradually privatized and, in 2000, PT became a publicly traded
company which opened an opportunity for the liberalization for this market segment in Portugal.
PT is recognized as one of the PSI 20 Index top companies by market capitalization17, having also one of the largest weights in the index. Besides being one of the most traded stocks in the Euronext Lisbon, PT is also quoted in the New York Stock Exchange.
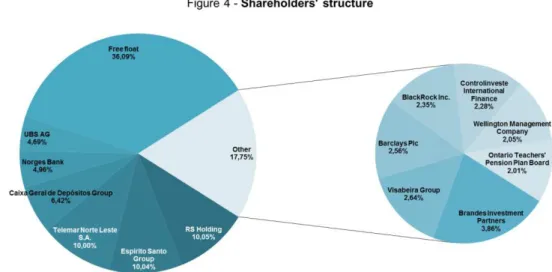
Shareholder structure
After a troubled background of hostile takeovers, spin offs, mergers, acquisitions and privatizations, PT’s current shareholder structure is mainly composed by RS Holding with a 10.05% stake, followed by Espírito Santo Group with 10.04%, Telemar Norte Leste S.A. with 10.00%, Caixa Geral de Depósitos Group with 6.24%, Norges Bank with 4.96% and UBS AG with 4.69%. There are other shareholders with smaller stakes that aggregated represent 17.75% PT’s total capital (these can be seen in more detail in Figure 4). The remaining 36.09% represent the shares being continuously traded on the open market – free float.
14
PT detains this participation on the Brazilian telecom Oi through Telemar Participações S.A., the controlling shareholder of Oi 15
PT detains this participation on the Brazilian contact centre services company Contax through CTX Participações S.A. 16
Through a 75% participation on Africatel, PT has a 25% stake in Unitel (Angola), 34% in MTC (Namibia), 40% in CVT (Cape Verde) and 51% CST (São Tomé and Príncipe)
17
Currently, PT is ranked as the sixth largest company with 3.2 billion EUR of market cap, as of 10/12/2012
Portuguese operations
41%
Oi 46%
Contax 9%
Other international
4%
Figure 3 - Revenue per business 2012E
Source: Analyst’s estimates
A s o f 11/ 12 / 2 0 12 E uro m illio n
Galp Energia SGPS SA 9,694 Jerónimo M artins SGPS SA 9,515 EDP - Energias de Portugal SA 7,832 EDP Renováveis SA 3,446 Banco Espírito Santo SA 3,323 Portugal Telecom SGPS SA 3,309
Table 7 - PSI 20 Index com panies' m arket capitalizations
PORTUGAL TELECOM COMPANY REPORT
By comparing PT’s shareholder structure with ZON’s, we noticed that they have several shareholders in common. Grupo Espírito Santo has relevant stakes in both companies (in ZON between 10% and 12%). However, we have never seen a troubled situation. In fact, all shareholders have confidence in Mr. Zeinal Bava
(PT’s CEO), a fact illustrated during the sale of VIVO back in 2010 when he received the board’s full support for his decisions. There are also other overlapping shareholders such as Ongoing Strategy Investments, SGPS, S.A. (through RS Holding); Grupo Visabeira, SGPS, S.A.; Norges Bank. Another
important fact regarding PT’s shareholder structure is that throughout the last
four years it has been relatively stable, with the exception of Telefonica that left behind its stake in PT.
As far as the company’s dividend policy is concern, since 2008 PT has always
exhibited a constant and appealing shareholders’ remuneration18. Since 2005, the company distributed in total an amount of 7.241 EUR19 per share, which is 5.686 EUR20 more than its direct Portuguese competitor, ZON, distributed during the same period. In June 2012, PT announced, for the next two years, the implementation of a prudent financial strategy of debt reduction and debt maturities extension. Together with these goals, PT also revealed commitment in keeping an attractive shareholders’ remuneration policy. It comprised an annual cash dividend of 0.325 EUR per share and a share buy-back programme of 200 million EUR21 (this share buy-back programme is equivalent to an additional 0.225 EUR cash dividend per outstanding share).
18One of the company’s strategic objective is to be in the
1st quartile companies in terms of shareholder return 19Includes PT’s extraordinary dividends: 1.616 EUR in 2007, 0.65 EUR and 1 EUR in 2010
20Includes ZON’s extraordinary dividends: 0.3 EUR in 2007 21
PT release of 27th
June 2012
Source: Company reports
0.215 0.435 0.65 0.575 0.575 0.575 0.475 0.475
1.65 1.616
2011 2010 2009 2008 2007 2006 2005
Figure 3 - PT's dividend per share evolution (Euro)
Interim Ordinary Extraordinary
PORTUGAL TELECOM COMPANY REPORT
Portuguese operations
Business description
Since 2011, PT segments its operations in the Portuguese market by customer type: Residential, Personal, and Enterprise.
The Residential segment comprises all the three wireline services: fixed phone, fixed broadband, and pay-TV, and it is offered under the brand name Meo. Through TMN, a subsidiary fully owned by PT, the Personal segment offers only mobile services for non-corporate clients.
Finally, the Enterprise segment encompasses all corporate clients benefiting from all wireline and mobile services.
Residential
The Portuguese wireline telecommunications market is currently dominated by PT and ZON (see Figures 6, 7 and 8).
During the last few years we have witnessed significant changes in market dynamics with bundles taking over. Currently, companies are practically offering only double and triple play bundles that provide combinations between fixed phone, fixed broadband, and pay-TV services. From 2007 to 2011, data from ICP-ANACOM22 shown that the number of single-play clients has decreased at a CAGR of 10% while the number of multi-play clients rose by 31% (see Figure 9). Driving this change is the effort that companies are putting in offering double and triple play bundles at attractive prices. In this way, customers will tend to prefer a bundled subscription, at a lower price, than buying the services individually from different telecom operators.
22
ICP-ANACOM is the Portuguese telecom market regulator
647 682 716 865 768 700
1,080 982
904 533
459
438
2010 2011 2012E
Figure 5 - Revenues per segment (Euro million)
Wholesale, other and eliminations
Entreprise
Personal
Residential
Source: Company reports, analyst’s estimates
Source: ICP-ANACOM
63.6% 60.4% 58.6% 57.3% 10.6% 14.8% 17.4% 19.3%
14.3% 12.9% 12.5% 11.8% 11.5% 12.0% 11.5% 11.6%
2009 2010 2011 3Q'2012
Figure 6 - Fixed phone market shares
PT ZON Sonaecom Others
44.5% 46.9% 49.4% 51.1% 31.9% 32.5% 33.0% 32.6%
9.1% 6.6% 5.4% 4.6%
7.8% 7.9% 7.2% 6.9%
6.6% 6.3% 5.0% 4.8%
2009 2010 2011 3Q'2012
Figure 7 - Fixed broadband market shares
PT ZON Sonaecom Cabovisão Others
23.0% 29.9% 35.0%
38.6% 64.4% 57.9% 53.9%
50.6%
10.2% 2.3% 9.4% 2.9% 8.6% 2.5% 8.1% 2.7%
2009 2010 2011 3Q'2012
Figure 8 - Pay-TV market shares
PT ZON Cabovisão Others
Source: ICP-ANACOM Source: ICP-ANACOM
565 724 1,120 1,583 2,172
6,467 6,358 5,839 5,088 3,861
2007 2008 2009 2010 2011
Figure 9 - Portuguese wireline clients: phone, broadband, pay-tv (thousands)
Bundled clients Standalone clients
PORTUGAL TELECOM COMPANY REPORT
According to ICP-ANACOM, in 2011 and taking into account the 27 countries of the European Union, Portugal was in third in the number of triple-play service penetration (see Figure 10). However, considering all multi-play bundles, Portugal falls to the eighth place (see Figure 11). This reveals the high importance of triple-play offers in Portugal (see Figure 12), in our opinion due to the high market concentration, small price differences that companies put between double and triple bundles, and the small number of public TV channels23. It is important to
notice that both PT and ZON offer the three wireline services.
▪
Triple-play success
As of September 2012, PT is the market leader in the triple-play segment, its major bundle (see Figure 13), with 802,000 customers against 751,00024 from ZON. This reveals an increase in its triple-play customer base by 27.7% when compared with last year’s homologue. Also, from 2007 (launch date for Meo together with Pay-TV service) to 3Q’2012, PT was able to increase its pay-TV market share from 1% to 38.6%.
In our opinion, PT’s triple-play and last years’ pay-TV success was only possible due to two key factors. First, the brand recognition Meo has among customers. Since Meo was launched, PT is characterized by having an aggressive marketing strategy. The company frequently produced advertising for different types of media, especially TV. A fun and important fact is that featuring in these ads was always a very popular comedian group that was crucial to the obtained brand awareness.
Second, the product differentiation Meo has always aimed for in its pay-TV service. Meo is normally mentioned as a leader in innovation25 and was the first to introduce several pay-TV features (both free and paid) such as video-on-demand and catch-up TV.
Price discounts that companies offer to new clients helped PT to increase its position against ZON. However, other companies such as Cabovisão and Sonaecom were also offering discounts in the past and were not successful in
23
Portugal has 4 public TV channels while Spain, France, United Kingdom, and Germany have more than 20 24
Information from ZON 2012 3rd Quarter Press Release 25
In 2010 and 2011 Meo was distinguished as Best National Brand by Exame Informática, a Portuguese magazine specialized in technology
44% 34%
19% 13% 7% 18%
16% 14%
12% 18%
6% 4%
5%
4% 3% 32%
46%
62% 71% 71%
2007 2008 2009 2010 2011 Figure 12 - Wireline bundles
segmentation for Portugal
phone + broadband + pay-TV
broadband + pay-TV
phone + pay-TV
phone + broadband
Source: ICP-ANACOM 0% 10% 20% 30% 40% 50% 60% 70% 80% Ge rm a n y F ra n ce Net h e rlan d s It a ly S p a in L u xe m b o u rg UK P o rtu g a l M a lt a Ir e lan d E sto n ia Gr e e ce B e lgiu m A u str ia S love n ia L a tvi a S wed e n B u lga ria
Figure 11 - Bundles penetration in European Union
Multiple play Average EU 27
Source: ICP-ANACOM 0% 5% 10% 15% 20% 25% 30% 35% 40% 45% 50% F ra n ce L u xe m b o u rg P o rtu g a l Net h e rlan d s E sto n ia S love n ia B e lgiu m UK S wed e n S p a in L a tvi a A u str ia Den m a rk Cypr u s It a ly Ir e lan d B u lga ria M a lt a
Figure 10 - Triple-play penetration in European Union
Triple play Average EU 27
Source: ICP-ANACOM
42%
36% 7%
7%
6% 2% 2%
Figure 13 - PT's wireline client segmentation
phone
phone + broadband + pay-TV pay-TV
phone + pay-TV broadband broadband + pay-TV phone + broadband
PORTUGAL TELECOM COMPANY REPORT
achieving the same market position that PT has today (the revenues section ahead provides further insight in discounts details).
▪
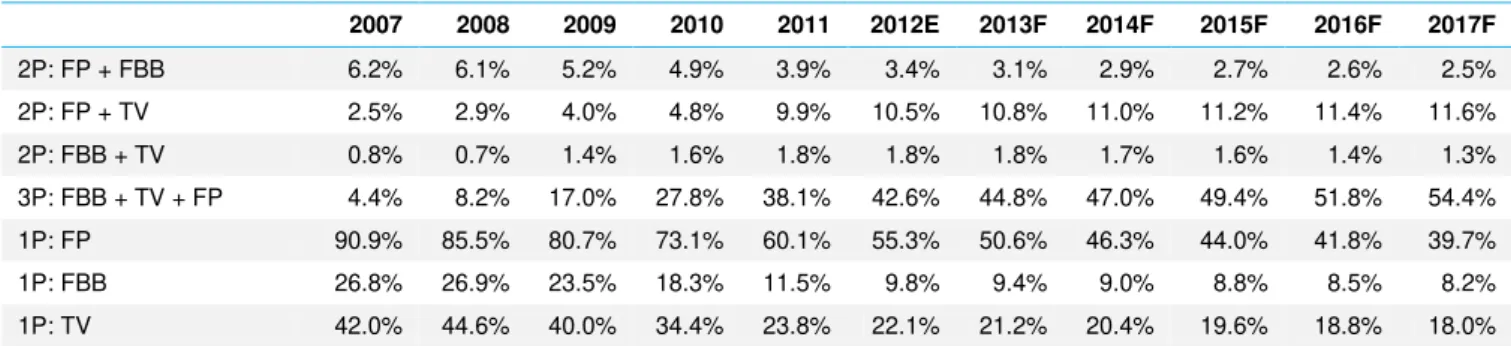
Forecasts on wireline trends
Following last years’ movements, we believe triple-play offers will continue to gain importance over other double-play and single-play ones, in our opinion due to the previous mentioned high market concentration and small price differences. Table 8 - Multi and single play accesses penetration rates (% of households)
2007 2008 2009 2010 2011 2012E 2013F 2014F 2015F 2016F 2017F
2P: FP + FBB 6.2% 6.1% 5.2% 4.9% 3.9% 3.4% 3.1% 2.9% 2.7% 2.6% 2.5%
2P: FP + TV 2.5% 2.9% 4.0% 4.8% 9.9% 10.5% 10.8% 11.0% 11.2% 11.4% 11.6%
2P: FBB + TV 0.8% 0.7% 1.4% 1.6% 1.8% 1.8% 1.8% 1.7% 1.6% 1.4% 1.3%
3P: FBB + TV + FP 4.4% 8.2% 17.0% 27.8% 38.1% 42.6% 44.8% 47.0% 49.4% 51.8% 54.4%
1P: FP 90.9% 85.5% 80.7% 73.1% 60.1% 55.3% 50.6% 46.3% 44.0% 41.8% 39.7%
1P: FBB 26.8% 26.9% 23.5% 18.3% 11.5% 9.8% 9.4% 9.0% 8.8% 8.5% 8.2%
1P: TV 42.0% 44.6% 40.0% 34.4% 23.8% 22.1% 21.2% 20.4% 19.6% 18.8% 18.0%
Source: ICP-ANACOM, INE, company reports, analyst's estimates FP: Fixed Phone; FBB: Fixed Broadband; TV: Pay-TV
As of December 2012, the FBB + TV bundle was no longer offered by ZON or Meo and as a result we foresee no further growth here. We predict moderate growth in the PHONE + TV bundle as the penetration rate of mobile broadband can make some users to forgo the fixed broadband service.
We expect a decreasing number of single-play users in line with the increase in the number of bundle clients.
Figure 14 shows the three wireline services’ penetration rates (% of households) implicit in our estimations, for the whole market. Despite the current adverse macroeconomic environment, the pay-TV and fixed broadband business have shown resilience and so we are confident in significant growth over the next years. Moreover, we expect these two services to progress together, as we believe they will be contracted mainly in a bundle package. The fixed phone service can see its numbers decrease, mainly because of the impact in enterprise/corporate accesses.
▪
Market shares
Figure 15 shows 2011 market shares for all bundles commercialized in Portugal. ICP-ANACOM does not provide market shares of bundles for periods before 2011 and so our estimates carry significant uncertainty. Nevertheless, with regard to bundles where we predict no further growth opportunities, we believe there will be no significant changes in market shares, as in our opinion users will transfer their services to different bundles and not to the same bundle of a
0% 20% 40% 60% 80% 100% 120%
Figure 14 - Wireline services aggregated penetration rates (% of
house holds)
phone broadband pay-TV
PORTUGAL TELECOM COMPANY REPORT
different telecom operator. We anticipate similar behavior on the single-play business; operators are betting heavily in bundles, and single-play products from all competitors are quite similar in terms of price and quality.
In the double-play bundle PHONE + TV, we expect PT and ZON will be able to gradually increase their market shares from other players, especially Cabovisão, because as soon the economic environment improves, users will be willing to shift their services to these two main players and benefit from a wide range of TV channels and more interactive features.
We believe that it is in the triple-play bundle that companies will be challenging each other. We have already stated that PT is now the leader in this segment with 802,000 customers, as of September 2012. With historical data from ICP-ANACOM, we estimate that PT has approximately 47% of market share and ZON 45%. Currently, despite the fact that in the past PT had a pay-TV service that offered a wide range of innovative features, both triple-play offers from PT and ZON are quite similar in terms of price and user experience, regardless of a different technology base (see CAPEX & NGN section). Furthermore, these two companies are the only ones betting in strong marketing campaigns; Mr. Zeinal Bava (PT’s CEO) has already stated that PT will continue with strong advertising as a way to promote its services. As a consequence, with the support of observed numbers and leveraging on the good momentum the company is having, we believe PT will be able to stabilize its market share in the triple-play service between 47% and 53%.
▪
Revenues
Using data from ICP-ANACOM we have estimated the different ARPUs26 companies are getting from their multi- and single-play clients.
In the single-play market, a more mature one than the market for bundles, we witness no big differences in ARPUs from competing companies. With the
26
Average Revenue per User
28%
37%
31% 4%
Phone + Broadband
PT VODAFONE Sonaecom Cabovisão
34%
43%
22% 1% Phone + Pay-TV
PT ZON Cabovisão Others
57% 41%
2% Broadband + Pay-TV
PT ZON Cabovisão
40%
46%
10% 4%
Phone + Broadband + Pay-TV
PT ZON Cabovisão Others
Source: ICP-ANACOM
PORTUGAL TELECOM COMPANY REPORT
exception for the fixed phone single-play service, where we believe the macroeconomic environment will penalize minutes, we expect no major changes, as it was already stated we expect clients gradually trade this type of service for a bundle.
We have found that PT’s last years’ growth in bundles has also been at the expense of its ARPU (see Figure 16). This can be explained by the fact that the company normally offers discounts that can reach up to 50% per month during 4-5 months or 10-20% per year, as a way to capture new clients, which have to stay with the company for a period of at least 24 months. ICP-ANACOM does not allow companies to offer these types of discounts to existing clients, only to new ones, a fact that beneficiated PT’s growth. However, after finishing their contract (normally 24 months), users can switch from PT to ZON and vice versa, another reason why we believe these two competitors are going to have close market shares in the future.
We expect PT’s ARPUs will gradually increase, at least reaching close to the
ones from ZON. We base ourselves on the fact that ZON’s client base is more
established and thus we expect a smaller percentage of clients are benefiting from new-comers discounts. PT should see its ARPUs increase as its client base becomes more mature and with less clients having discounts. Moreover, we expect overall sector ARPU will increase when the macroeconomic environment allows users to uptake on premium services.
▪
Operating data
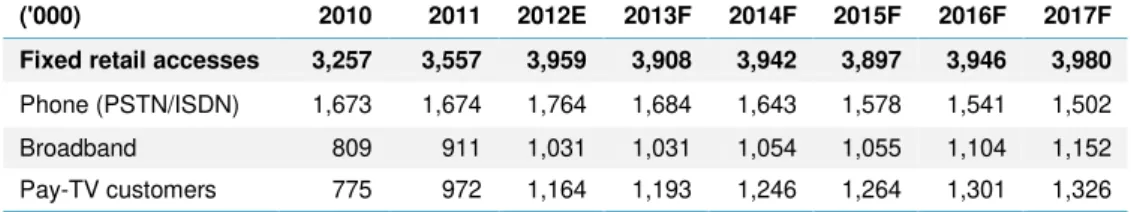
Table 9 - Residential operating data
('000) 2010 2011 2012E 2013F 2014F 2015F 2016F 2017F
Fixed retail accesses 3,257 3,557 3,959 3,908 3,942 3,897 3,946 3,980
Phone (PSTN/ISDN) 1,673 1,674 1,764 1,684 1,643 1,578 1,541 1,502
Broadband 809 911 1,031 1,031 1,054 1,055 1,104 1,152
Pay-TV customers 775 972 1,164 1,193 1,246 1,264 1,301 1,326
Source: Company reports, analyst's estimates
Personal
Portugal has a quite mature mobile market and market shares have been quite sable during the past few years. However, operators are seeing revenues falling, in our opinion due to the macroeconomic downturn, on-going cuts on Mobile Termination Rates (MTRs), and the success of tribal plans.
17.46
30.81
24.05
41.74
14.84
39.72
13.52
26.70 34.36
41.47
FP + TV 2011
FP + FBB + TV 2011 Figure 16 - ARPUs
PT ZON Cabovisão VODAFONE OPTIMUS
Source: ICP-ANACOM, company reports, analyst’s estimates
43.9% 43.1%
39.3% 40.5%
15.7% 15.3%
2.2% 2.4%
2010 2011
Figure 17 - Portuguese mobile market shares
PT (TMN) VODAFONE
Sonaecom (OPTIMUS) Others
PORTUGAL TELECOM COMPANY REPORT
In 2011, PT had 43.1% of the number of mobile accesses with effective use, making it the main player.
▪
Economic downturn and prepaid customers
Portugal has a fairly high number of prepaid customers – 85% as of December 201127. We believe this type of clients are more sensitive to changes in available income – since they pay in advance they have higher control over their expenses
– and as a consequence operators see their ARPUs decline.
▪
Tribal plans
In 2008, Optimus, the third operator, launched a mobile plan, Optimus TAG, which allowed users to freely communicate (calls and SMS28/MMS29) to other TAGs, and send free SMS to all Optimus’ users. To benefit from this plan, users only had to monthly charge their mobile phones with 10EUR, that they could, for example, use to call customers from other operators. Shortly after, Vodafone and TMN responded with their own tribal plans (Extreme/Extravaganza and Moche respectively), but instead of mandatory monthly charges, users had to pay a monthly fee of 10EUR.
Despite the fact that the tribal plan from Optimus offered better conditions, the company was unable to obtain significant increase in market share.
In the end of 2010, the three competitors raised the price for their tribal plans by approximately 25%, meaning these types of plans are likely to put operator’s profit on the limit.
As of December 2012, TMN and Vodafone offer different tribal plans with both monthly fee and monthly charge options, and even offer limited free mobile internet traffic.
In our opinion, these plans are one of the main reasons why the ARPUs have been decreasing sharply (see Figure 18); PT’s Personal segment reported 2010 ARPU was 11.0EUR vs. 8.8EUR in September 2012. We anticipate further ARPU decreases as tribal plans grasp higher penetration rates.
TMN is currently trying to increase its market share in tribal plans; the company is promoting campaigns in universities and high schools, given that it is believed the majority of tribal plan users are under 25 year old.
27
Source: ICP-ANACOM 28
Short Message Service 29
Multimedia Messaging Service Source: Company reports, analyst’s estimates 0
5 10 15 20 25
2007 2008 2009 2010 2011 Figure 18 - Mobile ARPUs in Portugal
(Euro)
PT (TMN)
VODAFONE
PORTUGAL TELECOM COMPANY REPORT
▪
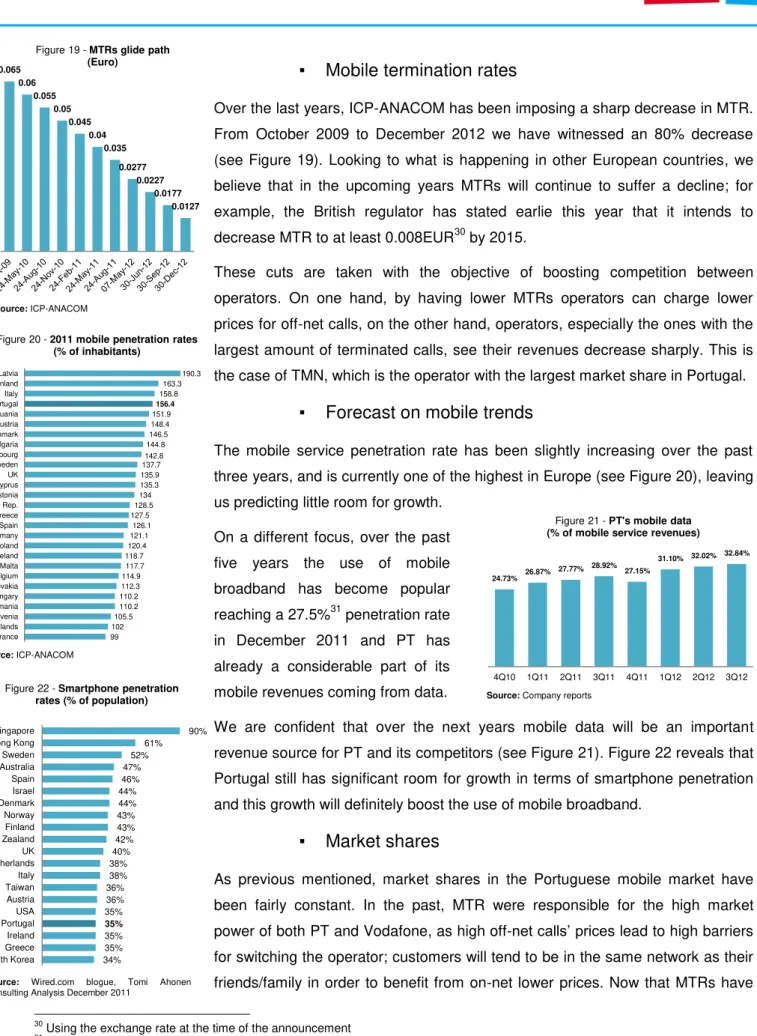
Mobile termination rates
Over the last years, ICP-ANACOM has been imposing a sharp decrease in MTR. From October 2009 to December 2012 we have witnessed an 80% decrease (see Figure 19). Looking to what is happening in other European countries, we believe that in the upcoming years MTRs will continue to suffer a decline; for example, the British regulator has stated earlie this year that it intends to decrease MTR to at least 0.008EUR30 by 2015.
These cuts are taken with the objective of boosting competition between operators. On one hand, by having lower MTRs operators can charge lower prices for off-net calls, on the other hand, operators, especially the ones with the largest amount of terminated calls, see their revenues decrease sharply. This is the case of TMN, which is the operator with the largest market share in Portugal.
▪
Forecast on mobile trends
The mobile service penetration rate has been slightly increasing over the past three years, and is currently one of the highest in Europe (see Figure 20), leaving us predicting little room for growth.
On a different focus, over the past five years the use of mobile broadband has become popular reaching a 27.5%31 penetration rate in December 2011 and PT has already a considerable part of its mobile revenues coming from data.
We are confident that over the next years mobile data will be an important revenue source for PT and its competitors (see Figure 21). Figure 22 reveals that Portugal still has significant room for growth in terms of smartphone penetration and this growth will definitely boost the use of mobile broadband.
▪
Market shares
As previous mentioned, market shares in the Portuguese mobile market have been fairly constant. In the past, MTR were responsible for the high market power of both PT and Vodafone, as high off-net calls’ prices lead to high barriers for switching the operator; customers will tend to be in the same network as their friends/family in order to benefit from on-net lower prices. Now that MTRs have
30
Using the exchange rate at the time of the announcement 31 Source: ICP-ANACOM 0.065 0.06 0.055 0.05 0.045 0.04 0.035 0.0277 0.0227 0.0177 0.0127 Figure 19 - MTRs glide path
(Euro) Source: ICP-ANACOM 99 102 105.5 110.2 110.2 112.3 114.9 117.7 118.7 120.4 121.1 126.1 127.5 128.5 134 135.3 135.9 137.7 142.8 144.8 146.5 148.4 151.9 156.4 158.8 163.3 190.3 France Netherlands Slovenia Romania Hungary Slovakia Belgium Malta Ireland Poland Germany Spain Greece Czech Rep. Estonia Cyprus UK Sweden Luxembourg Bulgaria Denmark Austria Lithuania Portugal Italy Finland Latvia
Figure 20 - 2011 mobile penetration rates (% of inhabitants)
Source: ICP-ANACOM
24.73% 26.87% 27.77% 28.92%
27.15%
31.10% 32.02% 32.84%
4Q10 1Q11 2Q11 3Q11 4Q11 1Q12 2Q12 3Q12 Figure 21 - PT's mobile data
(% of mobile service revenues)
Source: Company reports
34% 35% 35% 35% 35% 36% 36% 38% 38% 40% 42% 43% 43% 44% 44% 46% 47% 52% 61% 90% South Korea Greece Ireland Portugal USA Austria Taiwan Italy Netherlands UK New Zealand Finland Norway Denmark Israel Spain Australia Sweden Hong Kong Singapore
Figure 22 - Smartphone penetration rates (% of population)
PORTUGAL TELECOM COMPANY REPORT
been decreasing, one could expect that competition would flower and more market share movements would be witnessed. However, in our opinion, tribal plans will not let that happen easily, especially in the younger segment where users will still tend to remain in the same network as their friends in order to benefit from free communications.
All in the sum, we have estimated fairly constant future market shares for PT, as we believe the barriers tribal plans pose are highly significant, and we do not believe the on-going MTRs cuts will be enough to boost competition between players.
▪
Operating data
Table 10 - Personal operating data
('000) 2010 2011 2012E 2013F 2014F 2015F 2016F 2017F
Mobile customers 5,963 5,932 5,905 5,869 5,832 5,764 5,686 5,598
Source: Company reports, analyst's estimates
Enterprise
Pressured by the economic downturn, the number of PT’s Enterprise fixed phone accesses has decreased 5.3% (y.o.y) in 2011 and we expect an even bigger decrease for the end of 2012 (13%). The same pressure is being felt on the ARPU, where we anticipate sharp decreases (see Figure 23); companies are currently cutting on spending and rationalizing their costs, with new investments being postponed. However, PT is well positioned for future trends, with an advanced network (4G LTE and optical fiber) and sophisticated corporate services (e.g. cloud-computing). This fact, associated with the growing importance of business internet and its associated services, helped increasing the number of fixed broadband accesses, a trend we believe will continue in the upcoming years.
▪
Operating data
Table 11 - Enterprise operating data
('000) 2010 2011 2012E 2013F 2014F 2015F 2016F 2017F
Fixed retail accesses 1,117 1,087 1,008 983 964 1,027 1,098 1,177
Phone (PSTN/ISDN) 873 826 719 669 622 640 660 679
Broadband 190 193 206 220 236 259 285 314
Pay-TV customers 54 68 83 94 106 127 153 183
Mobile customers 1,390 1,445 1,525 1,570 1,618 1,731 1,852 1,982
Source: Company reports, analyst's estimates 35.90
32.32 29.74
27.95 26.27
2010 2011 2012E 2013F 2014F Figure 23 - PT's Enterprise blended
ARPU
PORTUGAL TELECOM COMPANY REPORT
CAPEX & NGN
In the end of 2012 PT finished its rollout of both 4G Long Term Evolution (LTE) and optical fiber; two New Generation Networks (NGN). As a result, the company reported that its Portuguese CAPEX should fall by at least 100EUR million for the end of 2012, and should continue to fall at a double-d rate in the following years. We estimate that CAPEX should gradually decrease from the 2011 value of 22% of revenues, to conservatively close to the industry median of 13% (see Comparables section) in 2016.
▪
Investment in optical fiber & 4G LTE
At the end of 2012, PT’s fiber-to-the-home (FTTH) covered 1.6 million households (approximately 40% of the total number of Portuguese households and one of highest in Europe, according to ICP-ANACOM). The company has stated that it does not intend to invest further in the coverage of FTTH, arguing that greater coverage could mean it would have to share its network with other operators due to regulatory obligations, even though ICP-ANACOM has stated that it has no intention in proceeding with such actions.
Since it started offering fixed broadband and pay-TV services, PT has been using Asymmetric Digital Subscriber Line (ADSL), which remains its current most active network (see Figure 25 for FTTH market penetration in Portugal). Together with ADSL, Cable was also present in the Portuguese wireline scenario through PT’s wireline rival ZON and Cabovisão.
If up to now, ADSL and Cable, provided users with enough broadband speeds, expected future changes in consumer behavior are driving operators to upgrade their networks in order to meet new customers’ bandwidth demands. ZON decided to upgrade its network to EURODOCSIS 3.0, a new Cable standard leveraged on a Hybrid Fiber Coaxial (HFC) network that allows users to benefit from download speeds up to 400Mbit/s. PT, on the other hand, decided to invest into a different technology: FTTH. Optical fiber is always mentioned by analysts as the technology of the future, with low maintenance costs and with ultra-high speeds (above 1000Mbit/s), but the price per home installation can be as much 11.5x32 higher than ZON’s EURODOCSIS 3.0 upgrade.
Currently, FTTH remains the less used technology to access internet in Portugal, however growing at an impressive rate (see Figure 25). PT is charging the same price for ADSL and FTTH services, meaning we can continue to see a sharp
32
In November 2011, during a press conference, Mr. Zeinal Bava stated that the cost for connecting one home with FTTH was 200EUR. Analyst’s estimates put ZON’s cost for upgrading one house to EURODOCSIS 3.0 close to 16EUR.
500 1,000 1,500 2,000 2,500 3,000 3,500
Figure 24 - Domestic revenues vs. CAPEX
(Euro million)
Revenues CAPEX
Source: Company reports, analyst’s estimates
2.2 3.1
51.4
15.0
41.0
94.2
DSL Cable FTTH
Figure 26 - OECD average advertised speeds September
2011 (Mbit/s)
Upload Download
Source: OECD
52.3% 51.2% 50.4% 49.9% 49.1% 48.0% 47.0% 46.1% 40.4% 40.6% 40.6% 40.1% 40.2% 39.9% 39.6% 39.5% 6.1% 7.1% 8.0% 9.1% 10.5% 12.0% 13.3% 14.3%
4T10 1T11 2T11 3T11 4T11 1T12 2T12 3T12 Figure 25 - Fixed broadband accesses
per technology in Portugal (% of total accesses)
ADSL Cable FTTH Other
PORTUGAL TELECOM COMPANY REPORT
increase in the service adoption over the next years, as existing and new users will prefer the fiber service if it is available in their area.
All in all, we believe FTTH alone will not bring significant changes in PT’s market share for the near future as the HFC offer from ZON provides an equal user experience, but PT had to invest in this new technology as not doing so could leave the company in a vulnerable position for the future.
In addition to the investment in fiber, PT also invested in increasing 3G coverage to 100% and in the new 4G LTE – the next standard for wireless data telecommunication and an upgrade over the previous 3/3.5G networks. By the end of 2012 PT covered 90% of the territory with this NGN. PT highlights the importance of this investment to boost a future integration between its wireline and mobile service; recently the company launched Meo Go, a service which allows customers to watch TV on laptops and tablets, the first step for this integration.
Financial data
Table 12 - Income statement from Portuguese operations
Euro million 2011 2012E 2013F 2014F 2015F 2016F 2017F
Operating revenues 2,892 2,738 2,599 2,479 2,584 2,737 2,917
Residential 682 699 666 652 645 668 702
Personal 768 700 663 620 625 629 631
Entreprise 982 904 856 814 904 1,006 1,120
Wholesale, other and eliminations 459 435 413 394 410 435 463
Operating costs33
1,640 1,556 1,477 1,409 1,469 1,556 1,658
Wages and salaries 252 240 228 217 226 240 256
Direct costs 480 462 438 418 436 462 492
Commercial costs 318 302 286 273 285 302 322
Other operating costs 535 513 487 464 484 513 546
Post retirement benefits 54 40 38 36 38 40 43
EBITDA 1,252 1,182 1,122 1,070 1,115 1,181 1,259
Depreciation and amortisation 703 698 673 641 607 573 543
Income from operations 548 484 449 429 508 608 716
Non operational costs 60 57 54 51 53 57 60
EBIT 489 427 395 377 455 552 655
EBITDA margin 45.1% 43.2% 43.2% 43.2% 43.2% 43.2% 43.2%
CAPEX 640 540 470 423 388 383 408
CAPEX % operational revenues 22% 20% 18% 17% 15% 14% 14%
Source: Company reports, analyst's estimates
33
PORTUGAL TELECOM COMPANY REPORT
Brazil
–
Oi
Business description
Following PT’s entrance in Oi’s capital, the company adopted a new reporting format similar to the one PT uses in its domestic market. As a result, operations are also divided into Residential, Personal, and Enterprise (opposed to what happens in Portugal, this last segment does not include any pay-TV accesses). Also, during 2011 and 2012, the company has undergone a restructuring of its corporate structure, bringing all subsidiaries under a new entity called Oi S.A, listed on the São Paulo and New York stock exchanges. The company announced that this transformation will “definitely simplify the corporate structure and governance of the Oi Companies, by eliminating administrative and
operational costs and increasing liquidity to all shareholders”.
Residential
Oi is currently the market leader in fixed phone and fixed broadband sectors, with a long way to go in the pay-TV area.
▪
Fixed phone
The company is currently being strongly pressured on its fixed phone business. We have estimated that from 2010 to 2011 revenues coming solely from this segment have decreased 17%, a trend that we believe to continue for the following years, with 2012 seeing an estimated decline of 10% (see Figure 31). We believe Oi is currently losing market share not only because of price competition but also due to quality issues. Figure 32 shows that during 2012 Oi had the highest amount of complaints per 1000 subscribers. In fact, the company
8,120
6,768
6,105 5,818 5,359
2010 2011 2012E 2013F 2014F Figure 31 - Oi's Residential fixed phone
revenues (BRL million)
Source: Company reports, analyst’s estimates 11,949 10,501 9,924
8,021
8,190 8,914 8,620 8,470 8,832
890
746 810
2010 2011 2012E
Figure 27 - Revenues per segment (BRL million)
Residential Personal Entreprise Others
Source: Company reports, analyst’s estimates
Source: Teleco
51.5% 47.6%
44.1% 43.6% 27.1%
26.9%
25.5% 25.1%
14.4% 16.8%
19.5% 20.2%
3.5% 5.0% 6.9% 7.3%
3.5% 3.8% 4.0% 3.9%
2009 2010 2011 1Q'2012
Figure 28 - Fixed phone market shares
Oi Telefônica Embratel GVT Others
37.0% 31.6% 30.2% 29.9% 25.3%
25.5% 25.7% 27.5%
23.2%
24.0% 22.2% 20.2% 5.9% 7.9%
10.2% 11.1% 8.6% 10.9% 11.8%
11.3%
2009 2010 2011 3Q'2012
Figure 29 - Fixed broadband market shares
Oi Net Telefônica GVT Others
Source: Teleco
3.3% 4.1% 2.8% 4.1% 52.2% 54.6% 54.9% 53.0%
26.3% 26.1% 29.8% 31.0%
8.7% 6.7% 5.6% 3.9%
9.3% 8.5% 7.0% 8.0%
2009 2010 2011 3Q'2012
Figure 30 - Pay-TV market shares
Oi TV Embratel/Net SKY Telefônica Others
PORTUGAL TELECOM COMPANY REPORT
was forbidden by ANATEL34 to commercialize new lines in some states due to its poor service quality. However, during 2012, in addition to investments related to infrastructure quality (see CAPEX & operating margins section), Oi promised to ANATEL that it would invest 2 billion BRL in improving its customer support, including call centers and software licenses. We expect next years’ investments in quality and customer support to help easing the reduction in fixed phone lines; we predict Oi to stabilize its fixed phone market share at 37% by 2016.
ARPU from this segment will continue to be penalized (9.5% decrease in 2011 and estimated 6% in 2012) by the fixed-mobile substitution and new types of plans offered by telecoms (see Figure 33). In mid-July ANATEL announced that low income families (receiving less than the minimum wage; in 2011 IBGE35 estimated that more than 50% of households lived with less than the minimum wage, 510 BRL at the time) will have special plans that would allow them to have access to fixed phone lines at prices that could be 60% lower than normal ones. This reduction will come at the cost of telecoms, which ANATEL estimated to be about 800 million BRL to 1,400 million BRL annually. It was not possible to
estimate the percentage of Oi’s clients that will be affected by this plan, however,
being Oi the incumbent and with operations on many states considered poor, we believe the company will be harshly affected by this measure. Also, recently, the
company introduced a new type of plan that limits families’ monthly fixed phone
bill to 29.99 BRL. After spending the free minutes given by Oi, the phone gets blocked and will unlock only on the next month, providing clients with better control over expenses.
Service penetration has increased from 66.2% of households in 2007 to 68.4% in 201236. Leveraged also on the fact that Brazil has a high mobile service penetration that competes closely in prices with fixed phone, we expect the service penetration rate to remain quite stable over the next five years.
▪
Fixed broadband
Fixed broadband penetration in Brazil has been growing at a rate above 15% between 2010 and 2011, slowing to 10% in 2012 (y.o.y). However, we believe that there is still significant room to increase the service penetration rate; Figure 34 shows that Brazil is still quite behind other Latin American countries in terms of fixed broadband penetration and far away from developed countries such as the US or the UK. We forecast penetration rates will continue to evolve following
34
Telecom regulator for the Brazilian market
35“Instituto Brasileiro de Geografia e Estatística”: Brazilian statistics institute 36
Source: Teleco 0
0.5 1 1.5 2 2.5
Figure 32 - Complaints per 1000 subcribers
Oi Telefônica
Embratel GVT
Sercomtel CTBC
Source: Teleco
70.5 66.7
61.3 58.3 55.3
2010 2011 2012E 2013F 2014F Figure 33 - Oi's fixed phone ARPU
evolution (BRL)
Source: Company reports, analyst’s estimates
6.9% 8.4%
10.5% 10.6% 11.6% 11.7% 13.5%
28.8% 32.7%
Colombia Brazil Argentina Mexico China Chile Uruguay US UK
Figure 34 - 2011 fixed broadband penetration
(% of population)
PORTUGAL TELECOM COMPANY REPORT
last years’ trends (see Figure 35), also fueled by a National Broadband Plan the country is undergoing since 2009, which consists of fiscal incentives and public investment.
Despite the growing number of fixed broadband accesses (14% in 2012 y.o.y, see Residential operating data), we do not expect an increase in revenue coming
from this segment, as a consequence of ARPU’s sharp decrease (estimated in
13% 2012 y.o.y, see Figure 36).
Brazilian customers are demanding faster and cheaper broadband accesses. Currently, the country still has a high percentage of users with contracted fixed broadband download speed below 2 Mbit/s (see Figure 37 for contracted speeds in Brazil), and the current contracted average speed is around 2.1 Mbit/s. These values are quite low for example when comparing with the 40 Mbit/s advertised OECD37 average.
Seeing this broadband speed appetite, in a bold move, GVT (a Brazilian telecom player) invested heavily in offering broadband accesses with high speeds (see Figure 38), and launched a series of broadband packages with very competitive prices. Today the company claims its clients’ average speed is above 10 Mbit/s. With this action GVT was able to significantly increase its market share (see Figure 29).
Feeling price pressures from its competitors, and with a broadband client base that is used to slow connections (3Q’2012 average speed was of 3.0 Mbit/s, see Figure 39), Oi already decreased the price of its fixed broadband band service
“Oi Velox”. The price cuts depend from state to state38
but the company claimed that some cuts could reach values as high as 30%. As a result, Oi experienced a 13% (2012 y.o.y) decrease in its ARPU coming from fixed broadband, and we estimate further annual decreases around 10% until 2014 (see Figure 36). Furthermore, the company expects to gradually increase speeds presented to its customers, and already started an investment plan with that objective (see CAPEX & operating margins section).
37
Organization for Economic Co-operation and Development; 40Mbit/s value was obtained from OECD broadband statistics July 2012 38
In Brazil, different states can have different services prices. These prices reflect local competition, income of local population, as well as other operation related costs.
8.4% 9.5%
10.5% 11.5%
12.5% 13.5% 14.5%
2011 2012E 2013F 2014F 2015F 2016F 2017F Figure 35 - Fixed broadband
penetration rates (% of total population)
Source: Teleco, analyst’s estimates
70% 67% 64% 60% 24% 26%
28% 32%
6% 7% 7% 8%
4Q'2011 1Q'2012 2Q'2012 3Q'2012 Figure 37 - Fixed broadband contracted speeds in Brazil
< 2 Mbit/s 2 - 12 Mbit/s > 12 Mbit/s
Source: Teleco
12% 15% 14%
31% 36% 54%
45% 46% 50% 66%
9%
2% 15% 23% 14%
1Q'2011 2Q'2011 3Q'2011 4Q'2011 1Q'2012 Figure 38 - CAPEX % of revenues
Oi GVT Telefonica
Source: Teleco
76.2% 75.9% 73.5% 71.3% 12.5% 12.6% 13.7% 15.0%
11.3% 11.5% 12.8% 13.7%
4Q'2011 1Q'2012 2Q'2012 3Q'2012 Figure 39 - Oi's fixed broadband
contracted speeds
< 5 Mb 5 - 10 Mb > 10 Mb
Source: Company reports 116.5
102.7 87.3
78.5 70.7
2010 2011 2012E 2013F 2014F Figure 36 - Oi's fixed broadband
ARPU evolution (BRL)
PORTUGAL TELECOM COMPANY REPORT
▪
Pay-TV
Oi’s pay-TV segment has presented 604,000 accesses in 3Q’2012, an increase of 75.1% (y.o.y), resulting from an increase in market share (from 2.8% in 2011 to 4.1% in the 3Q’2012) and from an increase in the pay-TV service penetration rate (20% y.o.y).
In the end of 2011, Brazil approved a new legislation for the pay-TV market. All companies are now allowed to offer pay-TV service bundled with broadband, fixed phone, and/or mobile phone, a practice that was not possible before. Previously, companies offering phone or broadband services were not allowed to directly commercialize or use their infrastructure to provide pay-TV services; for example, Oi was selling pay-TV services through Way TV, a company with its own infrastructure (Cable and DTH39), which was bought in 2008 and later renamed to Oi TV. With the introduction of this new legislation, the Brazilian government expects to increase pay-TV service penetration to 33% of households by 2015 (see Figure 40 for forecasts used in our analysis).
Following legislation changes mentioned above, Oi, which was one of the most active telecoms demanding its implementation, introduced pay-TV bundles allowing clients to have access to pay-TV at prices that can be 50% lower than when they had to contract the service separately (see Figure 41 for predicted ARPU evolution). Now that Oi can use its existing wireline to provide pay-TV (through IPTV40), the company expects these new bundles not only to ease the market share loss it has been having over the last years in the fixed phone and broadband sectors, but also to increase its position on the pay-TV side (we are predicting 8% by 2016). We expect Oi’s pay-TV to be gradually made accessible in new areas, in line with the infrastructure’s quality improvements that are scheduled for the next years (see CAPEX & operating margins).
▪
Operating data
Table 13 - Residential operating data
Residential ('000) 2010 2011 2012E 2013F 2014F 2015F 2016F 2017F
Fixed retail accesses 18,278 17,809 18,182 19,080 19,312 19,524 20,052 20,885
Phone 14,161 13,046 12,506 12,489 12,050 11,613 11,163 11,173
Broadband 3,842 4,412 5,029 5,511 6,034 6,350 6,947 7,598
Pay-TV 275 351 648 1,079 1,228 1,560 1,942 2,114
Source: Company reports, analyst's estimates
39
Direct-broadcast satellite 40
Internet Protocol television is a system where television services are offered over the Internet; In addition to other TV transmission standards, this service offers a wide range of features such as video-on-demand and catch-up TV
12.0% 15.5%
20.1% 24.1%
27.2% 30.8%
33.2% 35.9%
38.8%
2009 2010 2011 2012E 2013F 2014F 2015F 2016F 2017F Figure 40 - Pay-TV penetration rates
(% of households)
Source: Teleco, analyst’s estimates
116.1 101.7
86.4 77.8
70.0
2010 2011 2012E 2013F 2014F Figure 41 - Oi's pay-TV ARPU
evolution (BRL)
PORTUGAL TELECOM COMPANY REPORT
Personal
The mobile segment in Brazil is led by Vivo (Telefonica) with 26.8% market share, Oi being the fourth player with an 18.8% share (see Figure 42). The mobile penetration rate in Brazil is quite high and is amongst one of the highest in Latin American and other economies of reference (see Figure 43), possibly a result of strong fixed-mobile substitution. We anticipate that 2012 witnessed an increase of 7%, having now a 133% mobile penetration rate, and our analysis was conducted under the assumption that the penetration rate will continue to grow at a smaller rate (2% annually), reaching 147% in 2017.
▪
Mobile calls cheaper than fixed
Back in 2009, TIM launched an unprecedented mobile plan (both in its prepaid and postpaid segments) that offered long distance calls over mobile at equal and in some conditions cheaper prices than long distance over fixed phone41. At the end of 2011, Vivo and Claro followed – in the case of VIVO, the company claimed that some of the discounts over the fixed phone could reach 30%. Figure 44 demonstrates the impact of TIM’s offers in the share of minutes of long-distance calls. Despite entering in such an aggressive strategy, TIM was still able to improve its EBITDA margins from 2009 to 2010, in line with its competitors. In
2011, TIM’s margins fell mainly because of the increase in the sale of mobile
phones, according to company report (see Figure 45, values for Vivo and Oi include the wireline business; it was not possible to obtain separated margins for the mobile segment).
During 2012 the Brazilian mobile market saw another step-up in price competition. Now, mobile companies are offering on-net free calls for fixed and mobile, in the same state. Oi seems to be well positioned for this type of integration between fixed and mobile; Oi is the telecom operator with the largest fixed phone market share. Moreover, a 2012 study from Teleco and Pricez, acclaimed Oi as the
operator with most competitive offers both in the prepaid and postpaid segment
(87% of Oi’s Personal clients are prepaid). The study points out that in some
41
In Brazil, the price per minute of phone calls depends on the state and even city where one is calling from and the state one is calling to. From example, the price of a phone call from the city of São Paulo to Brasilia may not be the same the price of calling from São Paulo to Rio de Janeiro.
29.7% 29.5% 29.4%
25.1% 26.5% 26.8%
25.4% 24.9% 24.7%
19.4% 18.8% 18.8%
0.4% 0.3% 0.3%
2010 2011 3Q'2012
Figure 42 - Brazilian mobile market shares
Vivo TIM Claro Oi Others
Source: Teleco 73.2% 82.4% 82.8% 97.8% 98.5% 99.4% 105.9% 110.4% 124.3% 129.7% 130.8% 134.9% 140.8% China Mexico Bolivia Venezuela Colombia Paraguay US Peru Brazil Chile UK Argentina Uruguay
Figure 43 - Mobile penetration rates (% of population)
Source: International Telecommunication Union
39% 35% 25%
17% 12% 12% 23% 24%
25%
17% 29% 29%
26% 27%
17%
12% 8% 9% 6% 7%
27%
48% 46% 47%
6% 7% 7% 6% 5% 3%
2007 2008 2009 2010 2011 1Q'2012 Figure 44 - Share of minutes of
long-distance calls
Oi Claro Telefônica TIM Others
Source: Teleco 0% 5% 10% 15% 20% 25% 30% 35% 40%
2009 2010 2011
Figure 45 - EBITDA margins
Oi Vivo TIM
PORTUGAL TELECOM COMPANY REPORT
cases Oi’s prices can be 30-50% lower than its competitors. The same study points out the growing importance of mobile broadband as a factor to choose an operator. According to ANATEL, Telefonica is the company better positioned for 3G with 83% national coverage; Oi is currently in 4th place with 50%, behind Claro (61%) and TIM (58%), respectively, and intends to increase to a “number close to the one from Telefonica”, over the next two years.
All in all, we are confident that Oi is well positioned for reverting last years’ trends and we based our valuation assuming the company will be able to grasp 20% of market share by 2016.
▪
Operating data
Table 14 - Personal operating data
Personal ('000) 2010 2011 2012E 2013F 2014F 2015F 2016F 2017F
Mobile customers 37,757 43,263 46,166 47,203 48,691 49,765 53,754 54,901
Source: Company reports, analyst's estimates
Enterprise
Oi provides less information about this segment and so we decided to be quite conservative about our perspectives over the next years. We have noticed that the Enterprise segment saw its numbers increase 15.6% (y.o.y) in the third quarter of 2012, and we have no reasons to believe that it will not continue to increase these numbers over the next years. Furthermore, only in 2012, the company said it made three important new corporate clients (not disclosed whom), that helped to the company to consolidate its position in the corporate segment, boosting also its Enterprise fixed phone and mobile client base.
With the exception of the fixed phone – where Enterprise segment has been moving contrary to the Residential one – we believe fixed broadband and mobile to move in the same direction of Residential and Personal, however, as previous stated, at more conservative rate (see Figures 46, 47 and 48).
0 50 100 150
2010 2011 2012E 2013F 2014F Figure 46 - Residential vs. Enterprise accesses evolution
(phone)
Residential phone
Enterprise phone
Source: Company reports, analyst’s estimates
0 50 100 150 200 250 300
2010 2011 2012E 2013F 2014F Figure 48 - Personal vs. Enterprise
mobile customers evolution
Personal Enterprise mobile
Source: Company reports, analyst’s estimates 0
50 100 150 200
2010 2011 2012E 2013F 2014F Figure 47 - Residential vs. Enterprise accesses evolution
(broadband)
Residential broadband
Enterprise broadband