JPediatr(RioJ).2016;92(2):156---167
www.jped.com.br
ORIGINAL
ARTICLE
Association
of
eating
frequency
with
anthropometric
indices
and
blood
pressure
in
children
and
adolescents:
the
CASPIAN-IV
Study
夽
Roya
Kelishadi
a,
Mostafa
Qorbani
b,c,
Mohammad
Esmaeil
Motlagh
d,
Ramin
Heshmat
c,
Gelayol
Ardalan
a,
Maryam
Bahreynian
e,∗aDepartmentofPediatrics,ChildGrowthandDevelopmentResearchCenter,ResearchInstituteforPrimordialPreventionof
Non-communicableDisease,IsfahanUniversityofMedicalSciences,Isfahan,Iran
bDepartmentofCommunityMedicine,AlborzUniversityofMedicalSciences,Karaj,Iran
cDepartmentofEpidemiology,ChronicDiseasesResearchCenter,EndocrinologyandMetabolismPopulationSciencesInstitute,
TehranUniversityofMedicalSciences,Tehran,Iran
dDepartmentofPediatrics,AhvazJundishapurUniversityofMedicalSciences,Ahvaz,Iran
eDepartmentofNutrition,ChildGrowthandDevelopmentResearchCenter,ResearchInstituteforPrimordialPreventionof
Non-communicableDisease,IsfahanUniversityofMedicalSciences,Isfahan,Iran
Received29December2014;accepted27May2015 Availableonline22January2016
KEYWORDS
Eatingfrequency; Bloodpressure; Anthropometric indices; Obesity; Childrenand adolescents
Abstract
Objectives: Thisstudywasconductedtoexploretheassociationofeatingfrequency(EF)with anthropometricindicesandbloodpressure(BP)inchildrenandadolescents.
Methods: This nationwide cross-sectional study was performed on a multi-stagesample of 14,880students,aged6---18years,livingin30provincesinIran.Parentswereaskedtoreport dietaryintakeofchildrenasfrequencyoffoodgroupsand/oritems.EFwasdefinedasthesum ofthedailyconsumptionfrequencyofmainmealsandsnacks.AssociationofEFwithweight disorders,abdominalobesity,andelevatedBPwasassessedusingdifferentlogisticregression modelsadjustedforpotentialconfoundingfactors.
Results: Eatingmorefrequently(≥6vs.≤3)wasfoundamongstudentswhowereatyoungerage
(11.91vs.13.29years)(p<0.001).StudentswhoreportedanEFof4(OR:0.67,CI:0.57---0.79), 5(OR:0.74, CI:0.62---0.87), and6(OR: 0.54,CI:0.44---0.65)hadloweroddsofbeingobese comparedtothosewhohadEF≤3.HavingEFof4(OR:0.82,CI:0.71---0.94),5(OR:0.86,CI:
0.74---0.99),and≥6(OR:0.73,CI:0.63---0.85)wasrelatedtolowerprevalenceofabdominal
adiposity.
夽
Pleasecitethisarticleas:KelishadiR,QorbaniM,MotlaghME,HeshmatR,ArdalanG,BahreynianM.Associationofeatingfrequency withanthropometricindicesandbloodpressureinchildrenandadolescents:theCASPIAN-IVStudy.JPediatr(RioJ).2016;92:156---67.
∗Correspondingauthor.
E-mail:[email protected](M.Bahreynian). http://dx.doi.org/10.1016/j.jped.2015.05.009
Eatingfrequency,anthropometry,andbloodpressure 157
Conclusion: HigherEFwasassociatedwithlowermeanvaluesofanthropometricandBP meas-ures,aswellaswithlowerprevalenceofgeneralizedandabdominalobesityinchildren and adolescents. Longitudinal studiesareneededtoassess thelong-termeffectsofEF onbody compositioninthepediatricagegroup.
©2016SociedadeBrasileiradePediatria.PublishedbyElsevierEditoraLtda.Allrightsreserved.
PALAVRAS-CHAVE
Frequênciade alimentac¸ão; Pressãoarterial; Índices
antropométricos; Obesidade; Crianc¸ase adolescentes
Associac¸ãodafrequênciadealimentac¸ãocomíndicesantropométricosepressão arterialemcrianc¸aseadolescentes:oEstudoCASPIAN-IV
Resumo
Objetivos: Esteestudofoirealizadoparaexploraraassociac¸ãodafrequênciadealimentac¸ão (FA)comíndicesantropométricosepressãoarterial(PA)emcrianc¸aseadolescentes.
Métodos: Esteestudotransversalnacionalfoirealizadoemumaamostradeváriasetapasde 14880estudantescomidadeentre6e18anosde30provínciasdoIrã.Foipedidoqueospais relatassemoconsumoalimentardascrianc¸ascomoafrequênciadegrupose/ouitens alimenta-res.AFAfoidefinidacomoasomadafrequênciadeconsumodiáriadasprincipaisrefeic¸ões elanches.Aassociac¸ãoentreFAedisfunc¸õesdopeso,obesidadeabdominalePAelevadafoi avaliadautilizandodiferentesmodelosderegressãologísticaajustadospelospossíveisfatores deconfusão.
Resultados: Foiconstatadaumaalimentac¸ãomaisfrequente(≥6comparac¸ãoa≤3)entre
estu-dantesmaisnovos(11,91emcomparac¸ãoa13,29anos)(P<0,001).Estudantesquerelataram4 [Razãodechance(RC):0,67;Intervalodeconfianc¸a(IC):0,57-0,79],5(RC:0,74;IC:0,62-0,87) e6(RC:0,54;IC:0,44-0.65)refeic¸õesapresentarammenoreschancesdesetornaremobesos emcomparac¸ãoaosqueapresentaramFAs≤3.FAde4(RC:0,82;IC:0,71-0,94),5(RC:0,86;
IC:0,74-0,99)e≥6(RC:0,73;IC:0,63-0,85)foiassociadaamenorprevalênciadeadiposidade
abdominal.
Conclusão: AFAmaisaltafoiassociadaàreduc¸ãonosvaloresmédiosdasmedidas antropométri-casedePA,bemcomoàmenorprevalênciadeobesidadegeneralizadaeabdominalemcrianc¸as eadolescentes.Sãonecessáriosestudoslongitudinaisparaavaliarosefeitosdelongoprazoda FAsobreacomposic¸ãocorporalnafaixaetáriapediátrica.
©2016SociedadeBrasileiradePediatria.PublicadoporElsevierEditoraLtda.Todososdireitos reservados.
Introduction
Itiswelldocumentedthatnon-communicablediseases origi-natefromearlylife,1andthattheirmajorriskfactors,such
aselevated blood pressure (BP) andexcess weight, track fromchildhoodtoadulthood.
Hypertension is recognized as one of the main possi-bleleadingcausefor severalformsofend-organdamage.2
Prevalenceandnewincidenceofelevated BPare increas-ingamongchildrenandadolescents.3Ithas,however,been
demonstratedthatelevated BPin childhoodincreasesthe riskofpre-hypertensionandhypertensiveadulthood.4
Body weight status is one of the strong risk factors contributing to hypertension.3 The alarming rate in the
prevalence of overweight and obesity is now becoming a seriouspublichealthissueworldwide.5,6
Multiple underlying factors, such as the high interac-tionbetween geneticsandenvironment, includingdietary components,mightaffectthebodyweightstatus.7Dietary
approachesfocused onspecificnutrientsandfoods donot completely explain the establishment of childhood obe-sity and its associated complications. Thus, it is of great importancetoconcentrateondietarypatternsandeating behaviors,suchaseatingfrequency(EF).8
Previousstudieshaveindicated thatgreaterEF is asso-ciatedwith a healthier body weightand lower likelihood ofhypertensionamongadultpopulation.9,10 However,
cur-rentevidenceontherelationshipofEFandadiposityamong childrenandadolescentsisnotconclusive.11,12Some
associ-ationsarereportedbetweenskippingmealsandincreased riskofobesityinyouth,13whereassomeotherstudieshave
notconfirmed sucha relationship.14 Therefore,this study
aimedtoexploretheassociationofEFwithanthropometric indexesandBPinapediatricpopulation.
Methods
Thiscross-sectional,multi-centricsurveywasconductedin 2011---2012asthefourthphaseofanationwidesurveillance program,entitled theChildhood andAdolescence Surveil-lance and PreventIon of Adult Non-communicable disease (CASPIAN-IV)study.
Study details and protocols have been described previously.15Inbrief,theCASPIAN-IVsurveywasconducted
158 KelishadiRetal.
the relevant national organizations approved the current study(Ethicalcommitteecode:188092).Writteninformed consent and oral assent were obtained from parents and participants,respectively.
Trainedhealthcareprovidersmeasuredanthropometric indicesincludingheight(Ht),weight(Wt),waist circumfer-ence(WC), and wrist and hip circumferences (HC) under standard protocols by using calibrated equipment. Stand-ingheightwasmeasuredusingawall-mountedstadiometer to the nearest 0.1cm and weight was measured using a portablescaletothenearest0.1kg.WCmeasurementwas recordedattheminimumcircumferencebetweentheiliac crestandtheribcage,usinganon-elastictape.Bodymass index (BMI) was then calculated via the ratio of Wt (kg) toHtsquared (m2).The WorldHealthOrganization(WHO)
standard curves were used to define underweight, over-weight,and obesity.Definition of underweight wasbased onBMIlessthan 5thpercentilefor age andgender. Over-weightsubjects were classified asBMI between 85th and 95thpercentiles,andobesitywasconsideredasBMIgreater thanthe 95thpercentilefor age and gender.Waist-to-hip ratio(WHR) andwaist-to-height ratio(WHtR) were calcu-lated by dividing WC by HC and Ht, respectively. WHtR morethan 0.5 wasconsidered asan indicator of abdomi-nalobesity.16 Assessmentofdietaryintakeofchildrenand
adolescentswasbasedonparentalreport asfrequency of foodgroupsand/oritems.SchoolsinIranareinsessionfor half a day; therefore, schoolmeal programsareunusual, and students have almost all their meals at home. Par-ents wereasked about the consumption frequency of the three main meals (breakfast/lunch/dinner) of their chil-dren,whereasstudentswereaskedaboutsnackitems.17The
snackitemswereconsideredasfollows:(a)cakes,cookies, biscuits,chocolates,candies;(b)corn-puffs,chips,pretzels; (c)cola,soda, andsugar-sweetenedbeverages; (d)fruits, natural fruitjuices, dried fruits; (e) milkand dairy prod-ucts;(f)sausages,pizza,andhamburgers. EF wasdefined asthesummationofthemainmealsandsnacksitems con-sumed,whichwasbetween1and9,categorizedintofour groupsasEF≤3,EF=4,EF=5,andEF≥6according toits distribution.Dataonsocio-demographics,physicalactivity, sleeping, screen time,andsmoking habitswerecollected throughan interview with students. Physical activity and screentime(includingwatchingTV,andleisure time com-puterandinternetuse)werecategorizedasmild,moderate, and vigorous/high with cut-offs of >2h or ≤2h per day, respectively.The socioeconomicstatus (SES)scoreof par-ticipants was constructed using the principle component analysis method, including the variables ‘‘parents’ edu-cation, parents’ job, possessing private car, school type (public/private),typeofhome(owned/rented),andhaving a personal computer in home.’’ The SES score was cate-gorized into tertiles to construct three level of SES. The first level considered as ‘‘low SES,’’ the second level as ‘‘moderateSES,’’andthethirdlevelas‘‘highSES.’’
All interviews were performed in a calm and friendly atmosphere; the questionnaires were completed anony-mously.
To measure systolic and diastolic BP (SBP, DBP), par-ticipants were asked to sit quietly and relaxed with limitedmovement,andtobreathe normally.BPwas mea-suredtwice, usinga standardized and calibrated mercury
sphygmomanometerontheright arm.Thecuffhad appro-priatesizeforthechildren’supperarmandtheaverageof measuredvalues(induplicate,with5mininterval)wasused todetermineBPlevels.Thereadings atthefirstKorotkoff soundwereconsideredastheSBP,andatthefifthsoundas DBP.Theaverageofduplicatemeasurementswasrecorded andincludedintheanalysis.ThediagnosisofelevatedBPin childrenwasbasedonthe90thpercentileofthedistribution ofSBPand/orDBPaccordingtogender,age,andheight.18
Statistical
analysis
Datawere analyzed usingtheSTATA package (Release12. CollegeStation,STATACorpLP,Package,TX,USA).All anal-yseswere performedusingsurveyanalysismethod. Mean, confidenceintervals(95%CI),andpercentageswere calcu-latedforcontinuousandcategoricalvariables,respectively. Mean andprevalence of continuousand categorical varia-bles acrossEFgroups wereassessedusingthe chi-squared and analysis of variance (ANOVA) tests. Association of EF withweightdisorders,abdominalobesity,andhighBPwas assessedusingdifferentlogisticregressionmodels.InModel I,thecrudeassociationwasassessed;inModelII,analysis wasadjustedfor age,gender, andlivingarea;inModelIII, screentime,physicalactivity,SES,andsleepinghourswere additionallyadjusted.BPanalyseswereadjustedforBMIin modelIV.EF≤3wasconsideredasreferencegroupfor all
statistical models.The resultof logisticregression is pre-sentedasoddsratio(OR)and95%confidenceinterval(95% CI).Association of EF withanthropometricindicesand BP levelwasassessedusingdifferentlinearregressionmodels. Alladjustmentswerethesameaslogisticregressionmodels. Theresultoflinearregressionispresentedasbeta(ˇ)and 95%CI.Thesignificantlevelwassetatp-valueoflessthan 0.05.
Results
Overall, 13,486 students completed the study (participa-tionrate:90.6%).Themeanageofparticipantswas12.47 years (95%CI: 12.29, 12.65), 49.2%were girls, and 75.6% were fromurban areas. Demographic and anthropometric characteristics of participants are presented in Table 1. No significant gender difference existed in the mean age (p=0.20).Theoverallmeanand95%CIforBMIandWCwere 18.85 (18.71, 18.99) kg/m2 and 67.03 (66.57, 67.48) cm,
respectively.Intotal,19.12%ofstudentswereabdominally obese and 11.89% were obese. Elevated BP was docu-mentedamong3.74%ofstudents.Breakfastwasdetermined as the main meal most skipped by children and adoles-cents (32.08% breakfast skippers vs. 8.90% lunch skippers vs.10.90%dinnerskippers).Anthropometricindices,leisure timeactivities, and frequency of elevated blood pressure aresummarizedinTable2.Asageincreased,thefrequency ofeatingdecreased;13.29yearoldstudentsate≤3meals and/orsnack,while11.91yearoldparticipantsate≥6meals and/or snacks during the day (p<0.001). Similar results wereobservedforboysandgirls,separately. Anthropomet-ricindices,suchasweight(45.95vs.39.66kg),waist(68.75 vs.65.56cm),andBMI(19.61vs.18.17kg/m2),werehigher
Eatingfrequency,anthropometry,andbloodpressure 159
Table1 Demographiccharacteristicsofthestudyparticipants:theCASPIAN-IVStudy.
Total Boys Girls p-value
Agea(years) 12.47(12.29,12.65) 12.36(12.12,12.61) 12.58(12.34,12.82) 0.20
Heighta(cm) 146.99(146.10,147.88) 148.17(146.84,149.51) 145.77(144.70,146.86) 0.005
Weighta(kg) 42.40(41.64,43.16) 43.07(41.93,44.21) 41.71(40.77,42.65) 0.06
BMIa(kg/m2) 18.85(18.71,18.99) 18.74(18.54,18.94) 18.97(18.76,19.17) 0.11
WCa(cm) 67.03(66.57,67.48) 67.83(67.15,68.52) 66.19(65.63,66.76) <0.001
Hipa(cm) 80.78(80.16,81.40) 80.06(79.21,80.91) 81.53(80.65,82.40) 0.02
Wrista(cm) 14.76(14.69,14.84) 15.01(14.89,15.14) 14.51(14.42,14.60) <0.001
WHtRa 0.456(0.454,0.458) 0.458(0.456,0.461) 0.455(0.452,0.457) 0.03
WHRa 0.186(0.185,187) 0.191(0.189,0.192) 0.181(0.180,0.183) <0.001
Sleepdurationa(h) 9.01(8.97,9.06) 9.03(8.97,9.09) 8.99(8.93,9.06) 0.41
Abdominalobesity(%) 19.12(18.22,20.06) 20.41(19.09,21.79) 17.79(16.56,19.09) 0.006
Overweight(%) 9.66(9.14,10.21) 9.28(8.56,10.05) 10.06(9.30,10.86) 0.16
Obesity(%) 11.89(11.22,12.59) 13.58(12.59,14.63) 10.15(9.278,11.09) <0.001
Father’seducation(%)
Illiterate 11.24(10.46,12.06) 11.66(10.46,12.92) 10.8(9.76,11.94)
0.61 Diploma 74.77(73.69,75.83) 74.39(72.8,75.91) 75.17(73.68,76.61)
Bachelor’sandabove 13.99(13,15.04) 13.95(12.55,15.48) 14.03(12.67,15.5)
Mother’seducation(%)
Illiterate 16.99(16.01,18.01) 17.59(16.15,19.14) 16.37(15.01,17.81)
0.47 Diploma 74.28(73.22,75.31) 73.6(72.05,75.1) 74.97(73.5,76.39)
Bachelor’sandabove 8.73(7.98,9.55) 8.80(7.74,10) 8.66(7.63,9.82)
Familysize(%)
Equaltoorlessthan4persons 48.92(47.76,50.07) 50.17(48.43,51.91) 47.64(45.83,49.45)
0.06 Morethan4persons 51.08(49.93,52.24) 49.83(48.09,51.57) 52.36(50.55,54.17)
SES(%)
Low 33.47(32.04,34.94) 33.18(31.14,35.29) 33.77(31.73,35.87,)
0.57 Moderate 33.09(32.01,34.19) 32.67(31.13,34.24) 33.52(32.03,35.06)
High 33.44(31.82,35.09) 34.15(31.81,36.57) 32.71(30.45,35.04)
Physicalactivity(%)
Mild 34.11(32.66,35.58) 28.75(26.86,30.72) 39.61(37.54,41.72)
<0.001 Moderate 36.78(35.66,37.92) 35.62(34.11,37.17) 37.97(36.36,39.61)
Vigorous 29.11(27.79,30.47) 35.62(33.66,37.63) 22.42(20.82,24.1)
Hightelevisionusage(%) 50.66(49.49,51.82) 51.18(49.55,52.81) 50.11(48.47,51.76) 0.36
Highcomputerandinternetusage(%) 9.63(8.99,10.32) 12.27(11.24,13.38) 6.94(6.25,7.69)
Highscreentimeactivity(%) 18.62(17.71,19.57) 21.93(20.53,23.4) 15.22(14.12,16.4) <0.001
SBPa(mmHg) 101.52(101.02,102.02) 102.79(102.04,103.55) 100.21(99.60,100.83) <0.001
DBPa(mmHg) 64.88(64.45,65.30) 65.58(64.96,66.20) 64.15(63.59,64.72) 0.001
HTN(%) 3.74(3.27,4.28) 4.53(3.79,5.41) 2.93(2.30,3.74) 0.007
HighSBP(mmHg)(%) 0.92(73.09,115.8) 1.25(96.64,162.1) 0.58(36.17,92.14) 0.004
HighDBP(mmHg)(%) 3.08(2.65,3.58) 3.65(2.97,4.46) 2.49(1.90,3.27) 0.04
FamilyhistoryofHTN(%) 53.64(52.62,54.67) 52.4(50.97,53.82) 54.92(53.38,56.45) 0.02
Familyhistoryofdyslipidemia(%) 44.07(43.08,45.05) 43.51(42.09,44.93) 44.64(43.22,46.06) 0.28
Familyhistoryofobesity(%) 45.47(44.38,46.57) 43.34(41.85,44.84) 47.66(46.07,49.26) 0.0001
Familyhistoryofdiabetes(%) 37.26(36.32,38.21) 36.53(35.14,37.93) 38(36.59,39.43) 0.16
Breakfastskippers(%) 32.08(26.99,29.83) 28.39(30.99,33.2) 35.89(34.27,37.55) <0.001
Lunchskippers(%) 8.90(8.23,9.62) 8.58(7.71,9.54) 9.23(8.22,10.35) 0.36
Dinnerskippers(%) 10.9(10.21,11.62) 8.75(7.91,9.67) 13.1(12.05,14.23) <0.001
Abdominalobesity:waist-to-height>0.5;hightelevisionusage:>2h/day;highcomputerusage:>2h/day;highscreentime:>2h/day. BMI,bodymassindex;WC,waistcircumference;WHtR,waist-to-heightratio;SES,socio-economicstatus;WHR,waist-to-hipratio;SBP, systolicbloodpressure;DBP,diastolicbloodpressure;HTN,hypertension.
160
K
elishadi
R
et
al.
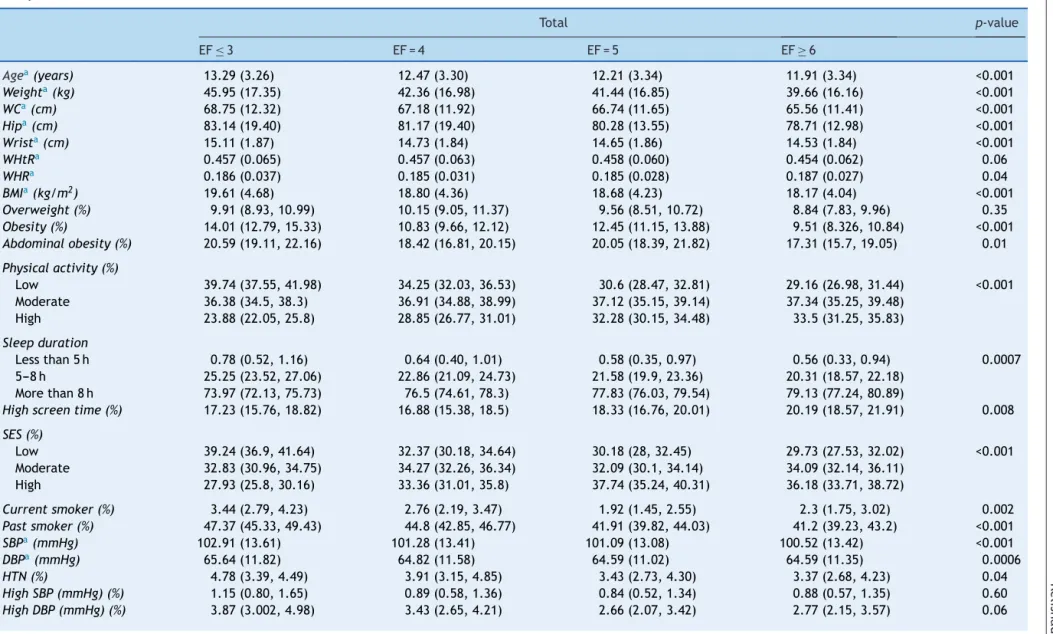
Table2 Anthropometricindices,leisuretimeactivities,andfrequencyofelevatedbloodpressureinparticipantsaccordingtotheireatingfrequency(EF):theCASPIAN-IV
Study.
Total p-value
EF≤3 EF=4 EF=5 EF≥6
Agea(years) 13.29(3.26) 12.47(3.30) 12.21(3.34) 11.91(3.34) <0.001
Weighta(kg) 45.95(17.35) 42.36(16.98) 41.44(16.85) 39.66(16.16) <0.001
WCa(cm) 68.75(12.32) 67.18(11.92) 66.74(11.65) 65.56(11.41) <0.001
Hipa(cm) 83.14(19.40) 81.17(19.40) 80.28(13.55) 78.71(12.98) <0.001
Wrista(cm) 15.11(1.87) 14.73(1.84) 14.65(1.86) 14.53(1.84) <0.001
WHtRa 0.457(0.065) 0.457(0.063) 0.458(0.060) 0.454(0.062) 0.06
WHRa 0.186(0.037) 0.185(0.031) 0.185(0.028) 0.187(0.027) 0.04
BMIa(kg/m2) 19.61(4.68) 18.80(4.36) 18.68(4.23) 18.17(4.04) <0.001
Overweight(%) 9.91(8.93,10.99) 10.15(9.05,11.37) 9.56(8.51,10.72) 8.84(7.83,9.96) 0.35
Obesity(%) 14.01(12.79,15.33) 10.83(9.66,12.12) 12.45(11.15,13.88) 9.51(8.326,10.84) <0.001
Abdominalobesity(%) 20.59(19.11,22.16) 18.42(16.81,20.15) 20.05(18.39,21.82) 17.31(15.7,19.05) 0.01
Physicalactivity(%)
Low 39.74(37.55,41.98) 34.25(32.03,36.53) 30.6(28.47,32.81) 29.16(26.98,31.44) <0.001 Moderate 36.38(34.5,38.3) 36.91(34.88,38.99) 37.12(35.15,39.14) 37.34(35.25,39.48)
High 23.88(22.05,25.8) 28.85(26.77,31.01) 32.28(30.15,34.48) 33.5(31.25,35.83)
Sleepduration
Lessthan5h 0.78(0.52,1.16) 0.64(0.40,1.01) 0.58(0.35,0.97) 0.56(0.33,0.94) 0.0007 5---8h 25.25(23.52,27.06) 22.86(21.09,24.73) 21.58(19.9,23.36) 20.31(18.57,22.18)
Morethan8h 73.97(72.13,75.73) 76.5(74.61,78.3) 77.83(76.03,79.54) 79.13(77.24,80.89)
Highscreentime(%) 17.23(15.76,18.82) 16.88(15.38,18.5) 18.33(16.76,20.01) 20.19(18.57,21.91) 0.008
SES(%)
Low 39.24(36.9,41.64) 32.37(30.18,34.64) 30.18(28,32.45) 29.73(27.53,32.02) <0.001 Moderate 32.83(30.96,34.75) 34.27(32.26,36.34) 32.09(30.1,34.14) 34.09(32.14,36.11)
High 27.93(25.8,30.16) 33.36(31.01,35.8) 37.74(35.24,40.31) 36.18(33.71,38.72)
Currentsmoker(%) 3.44(2.79,4.23) 2.76(2.19,3.47) 1.92(1.45,2.55) 2.3(1.75,3.02) 0.002
Pastsmoker(%) 47.37(45.33,49.43) 44.8(42.85,46.77) 41.91(39.82,44.03) 41.2(39.23,43.2) <0.001
SBPa(mmHg) 102.91(13.61) 101.28(13.41) 101.09(13.08) 100.52(13.42) <0.001
DBPa(mmHg) 65.64(11.82) 64.82(11.58) 64.59(11.02) 64.59(11.35) 0.0006
HTN(%) 4.78(3.39,4.49) 3.91(3.15,4.85) 3.43(2.73,4.30) 3.37(2.68,4.23) 0.04
HighSBP(mmHg)(%) 1.15(0.80,1.65) 0.89(0.58,1.36) 0.84(0.52,1.34) 0.88(0.57,1.35) 0.60
Eating
frequency
,
anthropometry
,
and
blood
pressure
161
Table2(Continued)
Boys p-value
EF≤3 EF=4 EF=5 EF≥6
Agea(years) 13.18(3.36) 12.34(3.33) 12.20(3.33) 11.83(3.40) <0.001
Weighta(kg) 46.40(18.56) 42.81(18.60) 42.94(17.99) 40.31(17.60) <0.001
WCa(cm) 69.61(12.93) 68.05(13.08) 67.87(12.53) 66.22(12.48) <0.001
Hipa(cm) 81.87(14.43) 80.55(24.02) 80.24(13.49) 78.04(13.26) <0.001
Wrista(cm) 15.41(2.07) 14.97(2.07) 14.99(1.99) 14.76(2.01) <0.001
WHtRa 0.459(0.067) 0.459(0.068) 0.460(0.063) 0.456(0.066) 0.23
WHRa 0.192(0.036) 0.189(0.032) 0.189(0.032) 0.191(0.029) 0.14
BMIa(kg/m2) 19.32(4.62) 18.54(4.42) 18.87(4.23) 18.11(4.07) <0.001
Overweight(%) 9.16(7.82,10.7) 9.05(7.59,10.75) 9.64(8.18,11.32) 9.46(8.05,11.08) 0.95
Obesity(%) 14.81(13.02,16.79) 11.85(10.1,13.84) 16.13(14.12,18.37) 10.78(9.21,12.58) 0.0001
Abdominalobesity(%) 22.01(19.81,24.38) 19.44(17.05,22.08) 22.28(19.92,24.82) 18.30(16.16,20.65) 0.03
Physicalactivity(%)
Low 34.2(31.12,37.41) 29.07(26.05,32.29) 27.11(24.27,30.15) 23.87(21.18,26.78) <0.001 Moderate 35.43(32.79,38.16) 35.87(33.03,38.8) 34.63(32.03,37.34) 36.49(33.6,39.48)
High 30.37(27.5,33.41) 35.06(31.89,38.38) 38.25(35.14,41.47) 39.64(36.46,42.92)
Sleepduration
Lessthan5h 0.39(0.17,0.86) 0.80(0.45,1.44) 0.57(0.26,1.23) 0.52(0.24,1.14) 0.17 5---8h 24.37(21.96,26.95) 23.14(20.57,25.92) 20.96(18.68,23.43) 20.89(18.52,23.48)
Morethan8h 75.24(72.63,77.68) 76.06(73.25,78.66) 78.47(75.95,80.8) 78.58(75.99,80.96)
Highscreentime(%) 21.73(19.44,24.21) 19.62(17.30,22.17) 21.92(19.55,24.5) 23.07(20.77,25.54) 0.20
SES(%)
Low 39(35.72,42.38) 32.97(29.88,36.22) 30.59(27.56,33.79) 29.29(26.3,32.46) <0.001 Moderate 31.24(28.59,34.03) 33.98(31.07,37.02) 30.43(27.74,33.27) 35.43(32.64,38.32)
High 29.76(26.61,33.11) 33.05(29.62,36.67) 38.98(35.38,42.7) 35.29(31.92,38.81)
Currentsmoker(%)
Pastsmoker(%) 4.31(3.29,5.63) 3.49(2.58,4.70) 3.25(2.39,4.39) 3.01(2.14,4.22) 0.23
SBPa(mmHg) 46.33(43.36,49.33) 45.63(42.76,48.52) 43.05(40.14,46.01) 41.79(38.98,44.66) 0.058
DBPa(mmHg) 104.29(14.70) 102.52(13.89) 102.62(13.62) 101.75(14.13) <0.001
HTN(%) 66.51(12.25) 65.56(11.87) 65.43(11.36) 65.36(11.49) 0.02
HighSBP(mmHg)(%) 6.03(4.65,7.79) 4.46(3.32,5.95) 4.83(3.68,6.31) 4.03(3.004,5.38) 0.08
HighDBP(mmHg)(%) 1.55(1.003,2.40) 1.17(0.68,2) 1.13(0.63,2.05) 1.25(0.75,2.07) 0.78
162
K
elishadi
R
et
al.
Table2(Continued)
Girls p-value
EF≤3 EF=4 EF=5 EF≥6
Agea(years) 13.39(3.18) 12.60(3.26) 12.23(3.36) 12.01(3.27) <0.001
Weighta(kg) 45.54(16.14) 41.93(15.28) 39.85(15.40) 38.93(14.33) <0.001
WCa(cm) 67.96(11.67) 66.34(10.65) 65.54(10.51) 64.82(10.01) <0.001
Hipa(cm) 84.32(23.03) 81.75(13.64) 80.33(13.62) 79.48(12.62) <0.001
Wrista(cm) 14.84(1.62) 14.49(1.56) 14.29(1.64) 14.28(1.60) <0.001
WHtRa 0.456(0.064) 0.455(0.057) 0.455(0.056) 0.452(0.057) 0.28
WHRa 0.181(0.037) 0.180(0.029) 0.180(0.023) 0.182(0.025) 0.38
BMIa(kg/m2) 19.87(4.73) 19.04(4.30) 18.49(4.22) 18.25(4.01) <0.001
Overweight(%) 10.62(9.22,12.19) 11.19(9.61,12.98) 9.47(8.05,11.12) 8.13(6.77,9.74) 0.03
Obesity(%) 13.27(11.63,15.1) 9.87(8.36,11.61) 8.57(7.11,10.31) 8.06(6.37,10.14) <0.001
Abdominalobesity(%) 19.28(17.28,21.45) 17.45(15.34,19.78) 17.7(15.45,20.21) 16.19(13.8,18.91) 0.25
Physicalactivity(%)
Low 44.87(41.88,47.9) 39.14(36.05,42.33) 34.28(31.17,37.53) 35.18(31.93,38.56) <0.001 Moderate 37.25(34.67,39.91) 37.9(35.03,40.85) 39.75(36.88,42.68) 38.31(35.45,41.26)
High 17.88(15.79,20.18) 22.96(20.43,25.7) 25.97(23.2,28.95) 26.51(23.62,29.62)
Sleepduration
Lessthan5h 1.14(0.72,1.81) 0.48(0.23,1.01) 0.60(0.30,1.19) 0.60(0.30,1.19) 0.0008 5---8h 26.07(23.66,28.62) 22.59(20.24,25.13) 22.24(19.84,24.84) 19.66(17.23,22.33)
Morethan8h 72.79(70.18,75.26) 76.92(74.34,79.32) 77.16(74.53,79.6) 79.75(77.05,82.2)
Highscreentime(%) 13.07(11.3,15.08) 14.28(12.43,16.35) 14.54(12.61,16.71) 16.92(14.8,19.27) 0.04
SES(%)
Low 39.47(36.1,42.94) 31.79(28.74,35.02) 29.74(26.78,32.89) 30.23(27.06,33.6) <0.001 Moderate 34.28(31.71,36.96) 34.55(31.8,37.4) 33.81(31.01,36.73) 32.58(29.87,35.4)
High 26.25(23.36,29.35) 33.66(30.46,37.01) 36.44(33.06,39.97) 37.2(33.66,40.87)
Currentsmoker(%) 2.63(1.89,3.64) 2.07(1.45,2.95) 0.52(0.25,1.09) 1.49(0.95,2.34) 0.0001
Pastsmoker(%) 48.34(45.51,51.17) 44.01(41.31,46.75) 40.71(37.8,43.68) 40.53(37.75,43.37) <0.001
SBPa(mmHg) 101.64(12.38) 100.10(12.83) 99.46(12.29) 99.12(12.42) <0.001
DBPa(mmHg) 64.84(11.35) 64.13(11.26) 63.72(10.59) 63.73(11.15) 0.02
HTN(%) 3.61(2.38,5.44) 3.40(2.45,4.68) 1.95(1.30,2.91) 2.63(1.77,3.88) 0.08
HighSBP(mmHg)(%) 0.78(0.41,1.49) 0.6233(0.30,1.27) 0.5251(0.25,1.09) 0.45(0.20,0.99) 0.58
HighDBP(mmHg)(%) 2.83(1.69,4.70) 2.98(2.10,4.20) 1.575(0.99,2.48) 2.33(1.52,3.55) 0.18
Abdominalobesity:waist-to-height>0.5;highscreentime:>2h/day.
BMI,bodymassindex;WC,waistcircumference;WHtR,waist-to-heightratio;SES,socio-economicstatus;WHR,waist-to-hipratio;SBP,systolicbloodpressure;DBP,diastolicblood pressure;HTN,hypertension.
Eatingfrequency,anthropometry,andbloodpressure 163
EF≥6(allp-values<0.001).LowerEFwasreportedamong
obesesubjects;intotal,obesitywasdocumentedin14.01% ofstudentswhoreportedEF≤3,andin9.51%ofthosewith
EF≥6(p<0.001).Thelikelihoodofbeingabdominallyobese
washigheramongboyswhohadEF≤3(22.01%)comparedto
theircounterpartswithEF≥6(18.30%)(p=0.030).Elevated
SBPwasdocumentedamongparticipantswithlowerEFthan theirpeersreportinggreaterEF(p<0.001).Thesameresult wasalsoobservedforboys(p<0.001)andgirls(p<0.001). Subjectswith EF≤3 weremore likelytohave higherDBP
comparedtothosewhoconsumedEF≥6daily (p<0.001).
LoweroddsofelevatedBPwereobservedamongthosewho hadhigherEF (≥6)thanthosewithfewereatingepisodes
(EF≤3)(p=0.040).
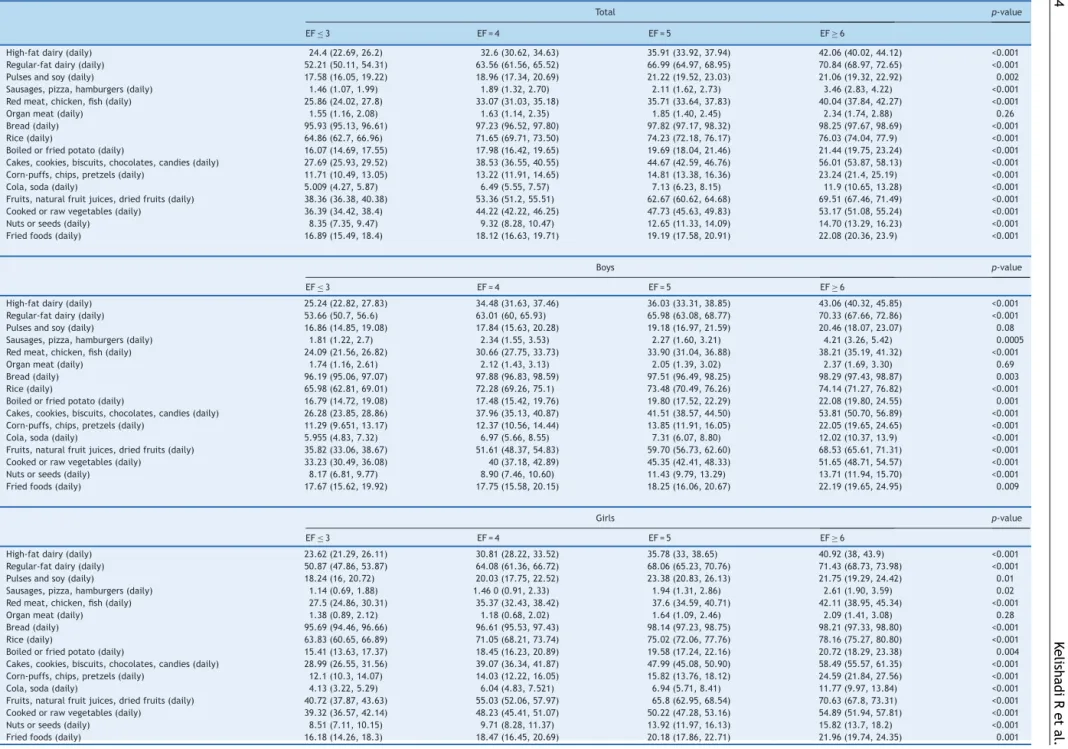
AsshowninTable3,consumptionofpulsesandsoywas higher among those with 6≥EF compared to those with ≤3EF(p=0.002).The samepatternwasreportedforboys (p=0.08)andgirls(p=0.01).
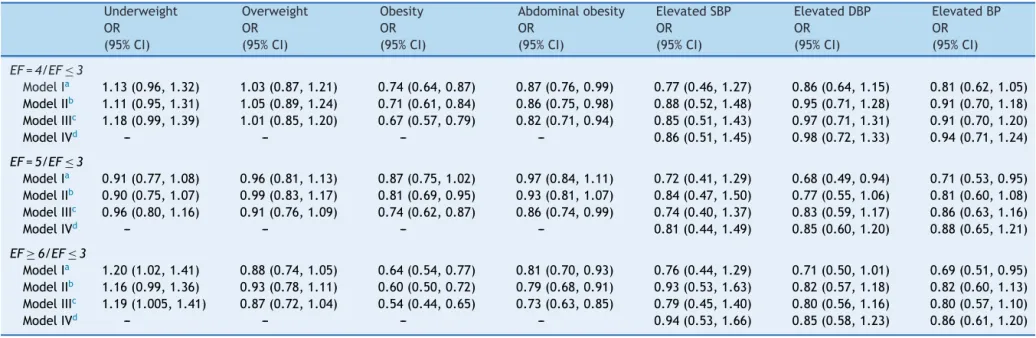
Table 4 presents the association of EF with abdominal obesity, weight disorders, and BP. A significant associa-tionwas observed between EF andobesity; students who reportedanEFof4(OR:0.67,CI:0.57---0.79),5(OR:0.74, CI:0.62---0.87),and 6(OR:0.54,CI:0.44---0.65) hadlower likelihoodofbeingobesecomparedtothosewhohadEF≤3. Theoddsofcentralobesityhadsignificantinverse associa-tionwithEF;havinganEFof4(OR:0.82,CI:0.71---0.94),5 (OR:0.86,CI:0.74---0.99),and≥6(OR:0.73,CI:0.63---0.85) decreasedtheORofabdominaladiposity.Eatingfivetimes perdaywasrelatedtolowerriskofelevatedDBP(OR:0.68, CI:0.49---0.94)atfirst,butaftercontrollingforconfounders, this association was no longer significant (OR: 0.85, CI: 0.60---1.20). Thesame associationswere observedfor ele-vatedBPandEF=5inModel1(OR:0.71,CI:0.53---0.95)and in the crude model of elevated BP and EF≥6 (OR: 0.69, CI:0.51---0.95);theseassociationswerenolongersignificant afterfurtheradjustmentforpotentialcovariates.
Discussion
The current nationwide study,which is thoughttobe the firstofitskind, foundthathigherEFwasinversely associ-atedwithoverweight,obesity,andanthropometricindices, aswellaswithmeanandelevated BP.Manyprevious epi-demiologicalstudiesamongadultshavereportedfavorable associationsoffrequenteatingwithBP;however,evidence islackinginthepediatricagegroup.10
Eating more frequently (≥6 vs. ≤3) was found among students with younger age. It might be because of the better controlof parents regarding the foodconsumption of youngerchildrenand,therefore, higheradherence and complianceofyoungchildrentohealthydietaryhabits.19
By increasingEF,the estimatedmeanvaluesof anthro-pometricmeasuresincludingWtandWCdecreased,aswell astheprevalenceofoverweight,obesity,andcentral obe-sity.Similar decreases were documentedin the means of SBP, DBP, and the prevalence of elevated SBP and DBP. Theassociationbetweenfrequenteatingandlowerobesity prevalencehasalsobeenproposedinpreviousstudies.20 It
hasbeen assumedthatlow EFmight promoteweightgain andunfavorablehealth consequencesthat mimicfeatures
ofmetabolic syndromeamongtheadult population. How-ever,higherEFcouldpossiblyleadtoexcessweightthrough highercalorieintakeduringaday.Althoughcontroversial,it issuggestedthatthereductioninhungerprovidedby regu-lareatingmightbeanotherpossiblemechanismforweight managementresultingfromhigherEF.20,21Theproportionof
distributedenergyintakethroughoutthedayappearstobe akeyfactorforweightcontrol.Itisalsoproposedthatthe distributionofstandardizeddailyenergyintakethroughout arangeofEFsmightnotleadtoanassociationbetweenEF andweight,whereasadirectassociationhasbeenobserved inadlibitumintake.22
The relationship of EF and BP is not fully understood. In the present study, lower EF was associated with both increasedSBPandDBP comparedtohigher EFgroup. The sameassociation wasfound for elevated BP. In a weight-maintenancetrial,subjectswithonemealperdayhada6% higherSBPandDBPcomparedtothosewhoconsumedthree mealsperday.23NoassociationofBPandawiderangeofEF,
from1to9,wasfoundinpreviousstudies,24,25whereasone
studyindicatedthattherelationofdailyEF,especiallysnack frequency and BP in school-aged children, was inversely dependentonleanandfatmassofparticipants.26However,
inthepresent study,the relationshipsofEFwithBPwere adjustedforBMIandWC.
Theunderlyingmechanismsresponsibleforthe associa-tionofEFandBPremaintobedetermined,buttheymightbe partlyexplainedbytheexistingassociationofEFwith gen-eralor centraladiposity.Someevidencesuggeststhatlow EFisassociatedwithobesity,particularlycentralobesity.27
The present results are consistent with the findings of a recent study that showedlower EF wasrelated tohigher increasein the10-year changes inBMI andWCof adoles-centgirls.28 Obesityis recognizedasa contributingfactor
forhypertensionmorbidity.29Thepresentstudyfound
signif-icantassociationsofEFwithgeneralizedandcentralobesity. Furthermore,therelationshipofEFandBPwasattenuated after controlling for BMI and WC. These findings suggest that central obesity might be an underlying cause of the associationbetweenEFandelevated BP.Itwasfoundthat individualswithhigherEFsreportedhigherintakeofpulses andsoy protein, poultry andfish,rice, bread,fruits, and natural fruits. Likewise, previous findings have indicated thatsubjectswhohadhigherEFweremorelikelytochoose healthy food items, leading to improved quality of their diet,30 andincreaseddailyintakeofmicronutrients
includ-ingvitaminA,C,E,and-carotene.10
Thelimitationsofthecurrentstudymustbeaddressed. First, itscross-sectional nature precludes the assumption ofcauseand effectrelationships.Moreover,recall biasof dietaryintakeduetotheretrospectivedatacollectionmay haveoccurred.Third,asamajorlimitationofstudiesonEF,a standarddefinitionofkeytermsincludingeatingoccasions, EF,meals,andsnacksisstilllacking.Duetothesubstantial differencesindefinitions,thecomparabilityof theresults between studies may be difficult.21 Moreover, the exact
164
K
elishadi
R
et
al.
Table3 Nutritionalcharacteristicsofparticipantsaccordingtotheireatingfrequency:theCASPIAN-IVStudy.
Total p-value
EF≤3 EF=4 EF=5 EF≥6
High-fatdairy(daily) 24.4(22.69,26.2) 32.6(30.62,34.63) 35.91(33.92,37.94) 42.06(40.02,44.12) <0.001 Regular-fatdairy(daily) 52.21(50.11,54.31) 63.56(61.56,65.52) 66.99(64.97,68.95) 70.84(68.97,72.65) <0.001 Pulsesandsoy(daily) 17.58(16.05,19.22) 18.96(17.34,20.69) 21.22(19.52,23.03) 21.06(19.32,22.92) 0.002 Sausages,pizza,hamburgers(daily) 1.46(1.07,1.99) 1.89(1.32,2.70) 2.11(1.62,2.73) 3.46(2.83,4.22) <0.001 Redmeat,chicken,fish(daily) 25.86(24.02,27.8) 33.07(31.03,35.18) 35.71(33.64,37.83) 40.04(37.84,42.27) <0.001 Organmeat(daily) 1.55(1.16,2.08) 1.63(1.14,2.35) 1.85(1.40,2.45) 2.34(1.74,2.88) 0.26 Bread(daily) 95.93(95.13,96.61) 97.23(96.52,97.80) 97.82(97.17,98.32) 98.25(97.67,98.69) <0.001 Rice(daily) 64.86(62.7,66.96) 71.65(69.71,73.50) 74.23(72.18,76.17) 76.03(74.04,77.9) <0.001 Boiledorfriedpotato(daily) 16.07(14.69,17.55) 17.98(16.42,19.65) 19.69(18.04,21.46) 21.44(19.75,23.24) <0.001 Cakes,cookies,biscuits,chocolates,candies(daily) 27.69(25.93,29.52) 38.53(36.55,40.55) 44.67(42.59,46.76) 56.01(53.87,58.13) <0.001 Corn-puffs,chips,pretzels(daily) 11.71(10.49,13.05) 13.22(11.91,14.65) 14.81(13.38,16.36) 23.24(21.4,25.19) <0.001 Cola,soda(daily) 5.009(4.27,5.87) 6.49(5.55,7.57) 7.13(6.23,8.15) 11.9(10.65,13.28) <0.001 Fruits,naturalfruitjuices,driedfruits(daily) 38.36(36.38,40.38) 53.36(51.2,55.51) 62.67(60.62,64.68) 69.51(67.46,71.49) <0.001 Cookedorrawvegetables(daily) 36.39(34.42,38.4) 44.22(42.22,46.25) 47.73(45.63,49.83) 53.17(51.08,55.24) <0.001 Nutsorseeds(daily) 8.35(7.35,9.47) 9.32(8.28,10.47) 12.65(11.33,14.09) 14.70(13.29,16.23) <0.001 Friedfoods(daily) 16.89(15.49,18.4) 18.12(16.63,19.71) 19.19(17.58,20.91) 22.08(20.36,23.9) <0.001
Boys p-value
EF≤3 EF=4 EF=5 EF≥6
High-fatdairy(daily) 25.24(22.82,27.83) 34.48(31.63,37.46) 36.03(33.31,38.85) 43.06(40.32,45.85) <0.001 Regular-fatdairy(daily) 53.66(50.7,56.6) 63.01(60,65.93) 65.98(63.08,68.77) 70.33(67.66,72.86) <0.001 Pulsesandsoy(daily) 16.86(14.85,19.08) 17.84(15.63,20.28) 19.18(16.97,21.59) 20.46(18.07,23.07) 0.08 Sausages,pizza,hamburgers(daily) 1.81(1.22,2.7) 2.34(1.55,3.53) 2.27(1.60,3.21) 4.21(3.26,5.42) 0.0005 Redmeat,chicken,fish(daily) 24.09(21.56,26.82) 30.66(27.75,33.73) 33.90(31.04,36.88) 38.21(35.19,41.32) <0.001 Organmeat(daily) 1.74(1.16,2.61) 2.12(1.43,3.13) 2.05(1.39,3.02) 2.37(1.69,3.30) 0.69 Bread(daily) 96.19(95.06,97.07) 97.88(96.83,98.59) 97.51(96.49,98.25) 98.29(97.43,98.87) 0.003 Rice(daily) 65.98(62.81,69.01) 72.28(69.26,75.1) 73.48(70.49,76.26) 74.14(71.27,76.82) <0.001 Boiledorfriedpotato(daily) 16.79(14.72,19.08) 17.48(15.42,19.76) 19.80(17.52,22.29) 22.08(19.80,24.55) 0.001 Cakes,cookies,biscuits,chocolates,candies(daily) 26.28(23.85,28.86) 37.96(35.13,40.87) 41.51(38.57,44.50) 53.81(50.70,56.89) <0.001 Corn-puffs,chips,pretzels(daily) 11.29(9.651,13.17) 12.37(10.56,14.44) 13.85(11.91,16.05) 22.05(19.65,24.65) <0.001 Cola,soda(daily) 5.955(4.83,7.32) 6.97(5.66,8.55) 7.31(6.07,8.80) 12.02(10.37,13.9) <0.001 Fruits,naturalfruitjuices,driedfruits(daily) 35.82(33.06,38.67) 51.61(48.37,54.83) 59.70(56.73,62.60) 68.53(65.61,71.31) <0.001 Cookedorrawvegetables(daily) 33.23(30.49,36.08) 40(37.18,42.89) 45.35(42.41,48.33) 51.65(48.71,54.57) <0.001 Nutsorseeds(daily) 8.17(6.81,9.77) 8.90(7.46,10.60) 11.43(9.79,13.29) 13.71(11.94,15.70) <0.001 Friedfoods(daily) 17.67(15.62,19.92) 17.75(15.58,20.15) 18.25(16.06,20.67) 22.19(19.65,24.95) 0.009
Girls p-value
EF≤3 EF=4 EF=5 EF≥6
Eating
frequency
,
anthropometry
,
and
blood
pressure
165
Table4 Associationbetweeneatingfrequency,anthropometricindices,andbloodpressureusingdifferentlogisticregressionmodels:theCASPIAN-IVStudy.
Underweight Overweight Obesity Abdominalobesity ElevatedSBP ElevatedDBP ElevatedBP
OR (95%CI)
OR (95%CI)
OR (95%CI)
OR (95%CI)
OR (95%CI)
OR (95%CI)
OR (95%CI)
EF=4/EF≤3
ModelIa 1.13(0.96,1.32) 1.03(0.87,1.21) 0.74(0.64,0.87) 0.87(0.76,0.99) 0.77(0.46,1.27) 0.86(0.64,1.15) 0.81(0.62,1.05)
ModelIIb 1.11(0.95,1.31) 1.05(0.89,1.24) 0.71(0.61,0.84) 0.86(0.75,0.98) 0.88(0.52,1.48) 0.95(0.71,1.28) 0.91(0.70,1.18)
ModelIIIc 1.18(0.99,1.39) 1.01(0.85,1.20) 0.67(0.57,0.79) 0.82(0.71,0.94) 0.85(0.51,1.43) 0.97(0.71,1.31) 0.91(0.70,1.20)
ModelIVd --- --- --- --- 0.86(0.51,1.45) 0.98(0.72,1.33) 0.94(0.71,1.24)
EF=5/EF≤3
ModelIa 0.91(0.77,1.08) 0.96(0.81,1.13) 0.87(0.75,1.02) 0.97(0.84,1.11) 0.72(0.41,1.29) 0.68(0.49,0.94) 0.71(0.53,0.95)
ModelIIb 0.90(0.75,1.07) 0.99(0.83,1.17) 0.81(0.69,0.95) 0.93(0.81,1.07) 0.84(0.47,1.50) 0.77(0.55,1.06) 0.81(0.60,1.08)
ModelIIIc 0.96(0.80,1.16) 0.91(0.76,1.09) 0.74(0.62,0.87) 0.86(0.74,0.99) 0.74(0.40,1.37) 0.83(0.59,1.17) 0.86(0.63,1.16)
ModelIVd --- --- --- --- 0.81(0.44,1.49) 0.85(0.60,1.20) 0.88(0.65,1.21)
EF≥6/EF≤3
ModelIa 1.20(1.02,1.41) 0.88(0.74,1.05) 0.64(0.54,0.77) 0.81(0.70,0.93) 0.76(0.44,1.29) 0.71(0.50,1.01) 0.69(0.51,0.95)
ModelIIb 1.16(0.99,1.36) 0.93(0.78,1.11) 0.60(0.50,0.72) 0.79(0.68,0.91) 0.93(0.53,1.63) 0.82(0.57,1.18) 0.82(0.60,1.13)
ModelIIIc 1.19(1.005,1.41) 0.87(0.72,1.04) 0.54(0.44,0.65) 0.73(0.63,0.85) 0.79(0.45,1.40) 0.80(0.56,1.16) 0.80(0.57,1.10)
ModelIVd --- --- --- --- 0.94(0.53,1.66) 0.85(0.58,1.23) 0.86(0.61,1.20)
OR,oddsratio;CI,confidenceinterval;EF,eatingfrequency;SBP,systolicbloodpressure;DBP,diastolicbloodpressure. a Crudemodels,withoutadjustment.
b Adjustedforageandgender,region.
c Additionallyadjustedforscreentime,physicalactivity,socio-economicstatus,andsleepduration. d AdditionallyadjustedforBMI,highSBP,highDBP,andhypertension.
p<0.05.
166 KelishadiRetal.
Inthisstudy,higherEFwasassociatedwithdecreasein themeanvaluesofanthropometricmeasuresandthe preva-lenceofgeneralizedandabdominalobesity,aswellaswith decreaseinBPmeasuresinchildrenandadolescents. Lon-gitudinalstudiesarenecessarytoidentifytheeffectsofEF onbodycomposition,healthcondition, feelingsof hunger andsatiety,aswellasonhormonalbalance,particularlyin obesechildrenandadolescents.
Funding
Thisstudywasconductedaspartofanationalsurveillance program.
Conflicts
of
interest
Theauthorsdeclarenoconflictsofinterest.
Acknowledgements
The authors would like to thank the large team working withthisproject,aswellasthestudents,theirparents,and schoolprincipalswhowillinglyparticipatedinthestudy.
References
1.KelishadiR,PoursafaP.Areviewonthegenetic,environmental, and lifestyle aspectsofthe early-lifeorigins of cardiovascu-lardisease. CurrProblPediatrAdolescHealthCare.2014;44: 54---72.
2.SpagnoloA, GiussaniM,AmbruzziAM,BianchettiM, Maringh-iniS,MatteucciMC,etal.Focusonprevention,diagnosisand treatmentofhypertensioninchildrenandadolescents.ItalJ Pediatr.2013;39:20.
3.Sorof JM, Lai D, Turner J, Poffenbarger T, Portman RJ. Overweight, ethnicity, and the prevalence of hyper-tension in school-aged children. Pediatrics. 2004;113: 475---82.
4.ChenX,WangY.Trackingofbloodpressurefromchildhoodto adulthood:asystematicreviewandmeta-regressionanalysis. Circulation.2008;117:3171---80.
5.Kelishadi R, Haghdoost AA, Sadeghirad B, Khajehkazemi R. Trend in the prevalence of obesity and overweight among Iranianchildrenandadolescents:asystematicreviewand meta-analysis.Nutrition.2014;30:393---400.
6.CavacoS,ErikssonT,SkalliA.Lifecycledevelopmentofobesity anditsdeterminantsinsixEuropeancountries.EconHumBiol. 2014;14:62---78.
7.ReceveurO,MorouK,Gray-DonaldK,MacaulayAC. Consump-tionofkeyfooditemsisassociatedwithexcessweightamong elementary-school-aged children in a Canadian first nations community.JAmDietAssoc.2008;108:362---6.
8.RodríguezG,MorenoLA.Isdietaryintakeabletoexplain differ-encesinbodyfatnessinchildrenandadolescents?NutrMetab CardiovascDis.2006;16:294---301.
9.BergC,LappasG,WolkA,StrandhagenE,TorénK,RosengrenA, etal.Eatingpatternsandportionsizeassociatedwithobesity inaSwedishpopulation.Appetite.2009;52:21---6.
10.Kim S, Park GH, YangJH, Chun SH, YoonHJ, Park MS. Eat-ingfrequencyisinverselyassociatedwithbloodpressureand hypertension in Korean adults: analysisof the Third Korean NationalHealth andNutrition ExaminationSurvey.EurJClin Nutr.2014;68:481---9.
11.ChinapawMJ,YildirimM, AltenburgTM, SinghAS, KovácsE, MolnárD,etal.Objectiveandself-ratedsedentarytimeand indicatorsofmetabolichealthinDutchand Hungarian10---12 yearolds:theENERGY-Project.PLoSONE.2012;7:e36657. 12.Payab M, Kelishadi R, Qorbani M, Motlagh ME, Ranjbar SH,
ArdalanG, et al.Associationof junk foodconsumptionwith high bloodpressureand obesity inIranianchildrenand ado-lescents: the CASPIAN-IV Study. J Pediatr (Rio J). 2015;91: 196---205.
13.KoletzkoB,ToschkeAM.Mealpatternsandfrequencies:dothey affectbodyweightinchildrenandadolescents?CritRevFood SciNutr.2010;50:100---5.
14.Siega-RizAM,CarsonT,PopkinB.Threesquaresormostlysnacks ---whatdoteensreallyeat?Asociodemographicstudyofmeal patterns.JAdolescHealth.1998;22:29---36.
15.KelishadiR,ArdalanG,QorbaniM,Ataie-JafariA,Bahreynian M,TaslimiM,etal.MethodologyandearlyfindingsoftheFourth SurveyofChildhoodandAdolescenceSurveillanceand Preven-tionofAdultNon-CommunicableDiseaseinIran:theCASPIAN-IV Study.IntJPrevMed.2013;4:1451---60.
16.Li C, Ford ES, Mokdad AH, Cook S. Recent trends in waist circumferenceand waist-height ratioamong USchildrenand adolescents.Pediatrics.2006;118:e1390---8.
17.KelishadiR, Majdzadeh R,Motlagh ME, HeshmatR, Aminaee T,ArdalanG,etal.Developmentandevaluationofa question-naireforassessmentofdeterminantsofweightdisordersamong childrenandadolescents:theCaspian-IVStudy.IntJPrevMed. 2012;3:699---705.
18.FallahZ,QorbaniM,MotlaghME,HeshmatR,ArdalanG, Kel-ishadi R. Prevalence ofprehypertension and hypertension in a nationally representative sample of Iranian children and adolescents: the CASPIAN-IV Study. Int J Prev Med. 2014;5: S57---64.
19.ArcanC,Neumark-SztainerD,HannanP,vandenBergP,Story M,LarsonN.Parentaleatingbehaviours,home food environ-mentand adolescent intakes of fruits,vegetables and dairy foods:longitudinalfindingsfromProjectEAT.PublicHealthNutr. 2007;10:1257---65.
20.Palmer MA, Capra S, Baines SK. Association between eat-ing frequency, weight, and health. Nutr Rev. 2009;67: 379---90.
21.Murakami K, Livingstone MB. Associations of eating fre-quency with adiposity measures, blood lipid profiles and bloodpressureinBritishchildrenandadolescents. BrJNutr. 2014;111:2176---83.
22.Gregori D, Maffeis C. Snacking and obesity: urgency of a definition to explore such a relationship. J Am Diet Assoc. 2007;107:562---3.
23.Stote KS, Baer DJ, Spears K, Paul DR, Harris GK, Rumpler WV,etal.Acontrolledtrialofreducedmealfrequency with-outcaloricrestrictioninhealthy,normal-weight,middle-aged adults.AmJClinNutr.2007;85:981---8.
24.BertéusForslundH,KlingströmS,HagbergH,LöndahlM, Torger-sonJS,LindroosAK.Shouldsnacksberecommendedinobesity treatment?A1-yearrandomizedclinicaltrial.EurJClinNutr. 2008;62:1308---17.
25.Poston WS, Haddock CK, Pinkston MM, Pace P, Karakoc ND, ReevesRS,etal.Weightlosswithmealreplacementandmeal replacementplussnacks:arandomizedtrial.IntJObes(Lond). 2005;29:1107---14.
26.BarbaG,TroianoE,RussoP,SianiA,ARCAProjectStudygroup. Totalfat,fatdistributionandbloodpressureaccordingtoeating frequencyinchildrenlivinginsouthernItaly:theARCAproject. IntJObes(Lond).2006;30:1166---9.
Eatingfrequency,anthropometry,andbloodpressure 167
28.Ritchie LD. Less frequent eating predicts greater BMI and waist circumference in female adolescents. Am J ClinNutr. 2012;95:290---6.
29.FrisoliTM, Schmieder RE, Grodzicki T, Messerli FH. Beyond salt:lifestylemodifications and bloodpressure.EurHeartJ. 2011;32:3081---7.