Abstract
Data quality control programs used in the mineral industry normally deine toler-ance limits based on values considered as good practice or those that have previously been applied to similar deposits, although the precision and accuracy of estimates depend on a combination of geological characteristics, estimation parameters, sample spacing and data quality. This study investigates how the sample quality limits affect the estimates results. The proposed methodology is based on a series of metrics used to compare the impact on the estimates using a synthetic database with an increasing amount of error added to the original sample grades or positions, emulating different levels of precision. The proposed approach results lead to tolerance limits for the grades similar to those recommended in literature. The inluence of the positional uncertainty on model estimates is at a minimum, because of the accuracy of current surveying methods that have a deviation in the order of millimeters, so its impact can be considered negligible.
Keywords: geostatistics; data uncertainty; sensitivity analysis; sampling error; QA/QC.
Victor Miguel Silva
Geólogo, MSc.
Universidade Federal do Rio Grande do Sul - UFRGS Departamento de Engenharia de Minas Porto Alegre - Rio Grande do Sul - Brasil [email protected]
Joao Felipe Coimbra Leite Costa
Professor, Engenheiro de Minas, MSc, PhD Universidade Federal do Rio Grande do Sul - UFRGS Departamento de Engenharia de Minas Porto Alegre - Rio Grande do Sul - Brasil [email protected]
Sensitivity analysis of
ordinary kriging to sampling
and positional errors and
applications in quality control
Mining
Mineração
http://dx.doi.org/10.1590/0370-44672015690159
1. Introduction
Since the geometry and geological properties of a mineral deposit are only known exactly after its complete extrac-tion and processing, it is necessary to use models and estimates throughout the life-time of a project for proper planning. The quality of available data strongly affects these estimates, and has consequently led the mining industry to adopt controls and procedures to measure and ensure data quality. These sampling and analytical controls typically establish error toler-ances based on the intervals suggested by literature and good practices, i.e. Abzalov (2008), which do not have a mathematical relationship with the precision and accu-racy required for the grade model, mine planning and scheduling. In this context, this paper proposes a methodology that
uses a sensitivity analysis to measure how the analytical and/or location errors affect the estimates.
Despite the diversity of estimation techniques, none is able to completely correct the impact of a database con-taining large analytical errors, data obtained using an improper sampling protocol or with inaccurate spatial po-sitions. Various systematic controls are employed to determine data accuracy and precision to ensure the quality of this information. At the same time, established quality assurance/quality control (QA/QC) programs ensure rep-resentative sampling and preparation.
The tolerance limits are typically based on average values suggested for different types of deposits (Abzalov,
2008). The main problem of employing values used in other mines or recom-mended by literature is that the estimated model will not necessarily have the same accuracy achieved by the mine from which the values were obtained, because the sensitivity of a model regarding the data quality is a complex relationship between data accuracy, estimation pa-rameters and sampling spacing.
Based on the need to measure the real impact of information on the esti-mation accuracy, this paper proposes a methodology to measure the impact of analytical and location errors on grade models, enabling a better deinition of tolerance limits and assuring that the deined values achieve the planned ac-curacy for block estimates.
2. Materials and methods
Based on the original data, per-turbed databases were generated by add-ing errors to the initial sample grades and locations using Monte-Carlo simulation. Ten uncertainty scenarios were created,
with the relative error randomly drawn from a normal distribution with increas-ing standard deviations (Miguel, 2015).
The sensitivity analyses were per-formed using the same blocks, methods
The different uncertainty scenarios and their relationship to the error-free estimates were measured by the average deviation and the coeficient from a linear regression using matching pairs of block values. The irst block value are estimated using the error-free dataset and the second using an error-added dataset.
The results were evaluated as a function of the uncertainty added to the data. The proportion of blocks incor-rectly classiied as ore or waste is also a measurement of the impact on the estimates and enables an assessment of the inancial impact caused by data error
by measuring the ability of the model to classify correctly each block. Two types of misclassiication exist:
• Dilution, in which a block of poor
economic value (at Walker Lake, V grade lower than 450 ppm) is classiied as an ore, reducing the average grade of the mined material;
• Loss, where an economically
viable block of ore (at Walker Lake, V
grade greater than 450 ppm) is classiied as waste, reducing the total ore tonnage of the deposit.
The proposed method was applied to an analysis of the ordinary kriging
(Matheron, 1963) sensitivity to sampled grade and locational uncertainty. The Proposed approach can be replicated to any geostatistical method. Thus, ordinary kriging was selected because it is probably the best known and most commonly used geostatiscal method in mining industry.
The proposed method was applied to an ordinary kriging sensitivity analysis with quality limit deinitions in the Walker Lake dataset (Isaaks And Srivastava, 1989), a public database composed of 78,000 two-dimensional data points de-rived from the topography of the Walker Lake area in the state of Nevada, USA.
2.1 Initial database and its estimation
The study used a re-scaled versionof Walker Lake with V grade (ppm) at
195 locations in a pseudo-regular grid of
20 x 20 m in an area of 78,000 m² (280 x 300 m).
The variogram showed anisotropy
with longer and shorter continuity in the N157.5° and N67.5º directions, respectively. The modeled variogram parameters were:
γv(ppm)(h) = 6000 + 13000 . Sph(1) .
N157 . 5E N67 . 5E
20m 16m
N157 . 5E N67 . 5E
69m 40m
+ 42000 . Sph(2) . (1)
A f t e r m o d el i n g t h e sp at i a l
structure, the V grades were
esti-mated by ordinary kriging in blocks of 10 x 10 m, with a search ellipse using
a minimum of 3 and a maximum of 12 samples.
Figure 1
Kriged V values using an error-free database for V grades. a) Estimated blocks and
b) histogram and statistics for the estimates.
2.2 Generating perturbed scenarios
Based on the grades and positions of the 195 samples, perturbed scenarios were obtained by adding errors to initial values. Deviations were randomly drawn using Monte-Carlo simulation (Lehmer, 1951) from a Gaussian distribution with azero mean and relative standard deviations of 2% to 40% (measured as the deviation between the perturbed and the initial sample values). The zero mean ensures the non-bias condition with symmetric scattering around the original mean.
For each level of uncertainty, 25 datasets were generated and used individu-ally to estimate the block model (Table 2), ensuring suficient values for the sensitivity curves. Table 1 shows the statistics aver-aged to each uncertainty scenario datasets.
(a)
Correlation
Coefficient Mean 1st Quartile Median 3rd Quartile
V (ppm) 1.000 273.5 62.0 223.9 409.4
bdSD-002 1.000 273.6 62.2 222.2 411.2
bdSD-004 0.998 273.5 62.6 221.4 413.2
bdSD-006 0.996 273.6 63.7 219.6 416.2
bdSD-008 0.993 273.8 64.1 217.7 413.8
bdSD-010 0.989 273.8 63.3 216.8 409.9
bdSD-015 0.977 274.1 63.9 216.1 408.8
bdSD-020 0.957 272.8 61.5 214.1 406.7
bdSD-025 0.941 273.6 59.7 210.0 406.1
bdSD-030 0.920 273.9 53.2 203.5 408.3
bdSD-040 0.858 274.0 46.5 193.6 404.5
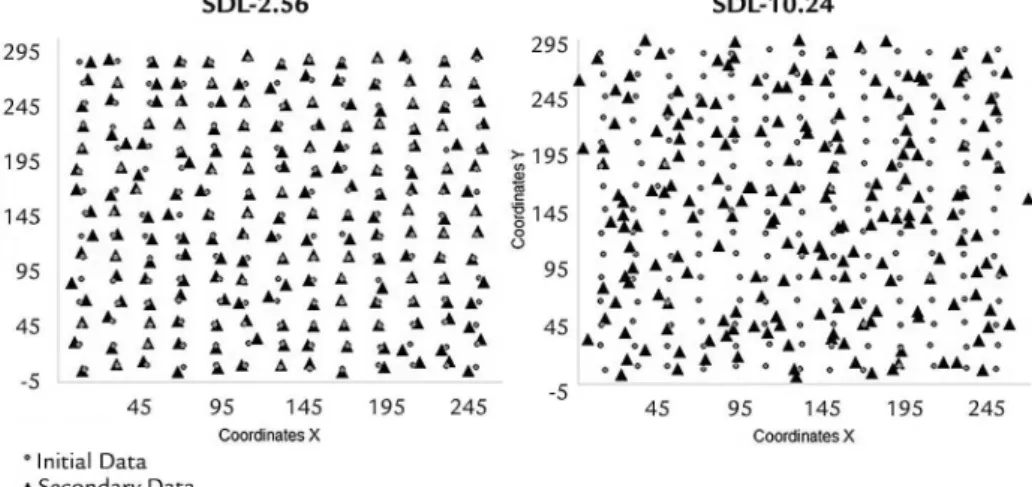
For positional sensitivity analysis, initial position was dislocated by adding Gaussian noise with a zero mean and standard deviation from 0.04 m to 10 m, randomly drawn independently for the X and Y coordinates, generating
displace-ments ranging from 0.02 to 12.9 m from the initial position.
The locational uncertainty generated average deviations of 0.05, 0.20, 0.84, 3.34 and 12.9 m from the original positions. The variations among realizations for the same
standard deviation caused little impact on the location sensitivity curve, which elimi-nated the need for multiple realizations. Figure 2 shows the original locations as circles and the perturbed positions for sce-narios SDL-2.56 and SDL-10.24 as triangles.
Figure 2 Location map of the original (circles) and perturbed positions (triangles) of sampled coordinates of SDL-2.56 and SDL-10.24 m.
2.3 Checking uncertainty influence on estimates
The sensitivity analysis foranalyti-cal and locational errors, quantiied for each scenario dataset, were compared to estimated blocks using the error-free dataset, which is accepted as “true”. Since kriging and variogram parameters have a signiicant effect on estimates, values
deined by the error-free database were applied to all perturbed scenarios
The impact caused by uncertainty on grades (Table 1) and on locational data (Table 2) were measured by the proportion of blocks that were incorrectly classiied as ore or waste using a cut-off
value for V of 450 ppm. The impacts
were also measured by deviation from the original mean, the correlation coef-icient and the mean absolute deviation for pairs of blocks containing the individual perturbed sample estimated values and original values.
Table 1 Descriptive statistics of the original and perturbed database statistics grouped by level of uncertainty1.
1Columns: Mean, median, 1st and 3rd quartiles refer to scenario mean values; correlation coefficient
Scenario Correlation Coefficient Mean Mean Block Deviation Loss+Dilution
blSD-002 1.00 274.9 2.4% 0.7%
blSD-004 1.00 274.7 5.0% 1.0%
blSD-006 1.00 274.9 7.4% 1.5%
blSD-008 1.00 275.0 9.9% 2.0%
blSD-010 0.99 275.2 12.3% 2.5%
blSD-015 0.99 275.6 18.6% 3.6%
blSD-020 0.97 274.7 25.9% 4.9%
blSD-025 0.97 274.4 30.0% 5.4%
blSD-030 0.95 274.9 36.1% 6.5%
blSD-040 0.91 273.0 50.6% 8.9%
Table 2
Descriptive mean statistics for model estimated using 25 perturbed grade databases. The block estimates are compared to the values for the error-free dataset and results are grouped by the level of uncertainty.
Scenario Mean Local
Deviation (m)
Correlation Coefficient
Mean Mean Block
Deviation
Loss+Dilution
SDL-0 0.00 1.00 274.9 0% 0.0%
SDL-0.04 0.05 1.00 274.9 0% 0.0%
SDL-0.16 0.20 0.99 274.8 1% 0.4%
SDL-0.64 0.84 0.99 275.4 2% 1.0%
SDL-2.56 3.34 0.98 274.8 10% 2.5%
SDL-10.24 12.90 0.85 281.5 41% 9.8%
2 Column: Mean deviation measures how many meters the coordinates are from the actual sampled
position; the mean refers to scenario blocks values; the correlation coefficient, mean deviation and loss+dilution compare the initial and scenario values block-to-block.
Table 3
Descriptive statistics for model means estimated for the perturbed positional databases. The values are compared to estimated blocks using the initial and correct locations2.
3. Results and discussion
3.1 Modeling of the sensitivity of estimates to uncertainty
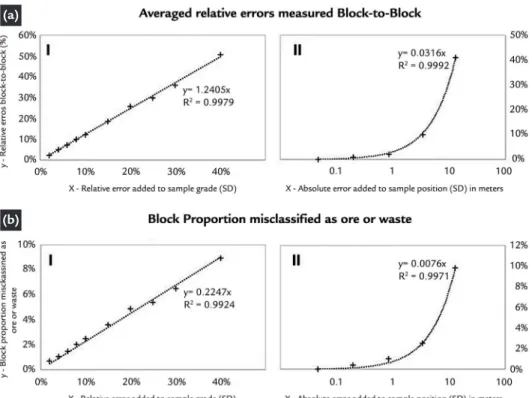
The kriging sensitivity, measuredto ten grade and ive locational levels of added uncertainty, were interpolat-ed by linear functions (Figure 3) that relate dataset errors to their impact on relative block-to-block errors and on block misclassiication.
An absolute increase of 5% in the standard deviation of the
uncer-tainty related to the sample grade increased the average deviation be-tween all estimated blocks and their reference values by 6.2% (Figure 3a-I, y=1.2405*5%), while the number of blocks misclassiied as ore or waste was increased by 1.12% (Figure 3b-I, y = 0.2247*5%).
For p o sit ion a l u nc er t a i nt y,
Figure 3 Grade and positional sensitivity curves relating the standard deviation added to sample error population (X) and its measured impact on relative block-to-block errors (a) and by misclassifying ore as waste (b).
3.2 Definition of quality limits
The sensitivity relationship between sampling and estimate uncertainty can take into account different criteria for defining sampling errors limits, i.e. minimum accuracy required for a grade model, mine planning and scheduling. For the sake of brevity, the study assumed free access to all mining blocks (each block can be mined as ore or waste in-dependently) and the Walker Lake block model being used as a bench to be mined during a month.As reference, good practices in QA/QC suggests replicate sample errors
between 5-10%, being acceptable a maxi-mum of 20% (Abzalov, 2008; 2011a). For resource classiication, values accepted by the mining industry as good practice state that measured resource should have an accuracy between 8% (Abzalov, 2011b) and 15% (Parker, 2014), over a monthly or quarterly production; both references using the usual 90% conidence interval.
First, we propose to use the sensitive equation to deine quality limits that en-sure the Walker Lake resource is classiied as measured. Considering a maximum acceptable sample uncertainty impact on
estimates of 10%, the equation a-I (Figure 3) deines that 90% of the samples error has to be below 8.1% (x = 10%/1.2405).
Quality limits may also be de-ined to ensure an impact on misclas-siication below a chosen threshold. Assuming an arbitrary maximum misclassiication of 3%, equation b-I (igure 3) deines a sampling error of 7.5% (x = 0.2247/3%). For the same misclassiication caused by locational errors, equation b-II (Figure 3) de-ines a maximum average deviation of 0.25 m (x=0.0076/0.03).
4. Conclusion
As discussed, in the mining industry there is a gap between data quality pro-grams and the commonly used geostatisti-cal method, where sampled grades, as well as their location, are assumed as error-free in the geostatistical modelling. This paper proposes an approach measuring the link between sampling quality control and es-timate values through sensitivity analysis. The general procedure is applicable to any deposit and geostatistical method. For the Walker Lake case, the blocks were estimated by ordinary kriging. The maximum error limit values deined by the proposed approach, and its expected impact on resource conidence, were very close to well-established references, being the sensitivity equations results consistent to sampling error and good resource classification practices. Moreover, the
approach applied to data position uncer-tainty concluded that when the accuracy of modern topographic surveys is taken into account, kriging sensitivity due to location error could be assumed negligible.
In real cases, whose initial sample grades and position have a measure-associated error, the regression line can be extrapolated to uncertainty values below measured error to the origin, assumed as error-free. Such methodology, applied to locational data uncertainty, allows the assessment of the locational impact on es-timated value cases of poorly located data. A inancial appraisal on the beneit related to the method proposed can be carried out following the same approach, using real sampling protocol costs and measuring their impact on proits due to metal loss or dilution caused by
misclas-sified blocks. Thus, the approach can be used to maximize proit, considering the money spent in sampling quality control and its impact on mining proit-ability. This type of optimization cannot be reached using benchmark values es-tablished by the industry for maximum acceptable error values.
In future work, stochastic simula-tions will be investigated in order to incorporate other sources of uncertainty associated with the estimation process. The simulations also allow to deine where additional samples should be located, and how it should be prepared and analyzed, taking into account the methods available for each position, their costs, expected impact on mine proitability and if the ad-ditional information costs in this position exceed the inancial beneits.
(a)
5. References
ABZALOV, M. Z. Quality control of assay data: a review of procedures for measuring and monitoring precision and accuracy. Exploration and Mining Geology, v. 17 n. 3-4, p. 1-14, 2008.
ABZALOV, M. Z. Sampling errors and control of assay data quality in exploration and mining geology. 2011a. Retrieved from www.academia.edu/6262174/Absa-lov_QAQC. Accessed: 26 April 2015.
ABZALOV, M. Z. Geostatistical approach to the estimation of sampling precision, Proceedings of 5th World Conference on Sampling and Blending (WCSB5), San-tiago, Chile. 2011b.
ISAAKS, E. H., SRIVASTAVA, R. M. An introduction to applied geostatistics. New York: Oxford University Press, 1989.
LEHMER, D. H. Mathematical methods in large-scale computing units. Proceedings of a Second Symposium on Large-Scale Digital Calculating Machinery. Cam-bridge: Harvard University Press, 1951. p. 141-146.
MATHERON, G. Principles of geostatistics. Economic Geology. v.58, p. 1246-66, 1963.
MIGUEL, V. S. Análise de sensibilidade das estimativas ao erro amostral, posicio-nal e suas aplicações. Porto Alegre: Escola de Engenharia, Universidade Federal do Rio Grande do Sul, 2015. 115 f. (Dissertação de Mestrado em Engenharia). PARKER, H. M. Evolution of Mineral Resource Classiication from 1980 to 2014 and
Current Best Practice. FINEX 2014 Conference, London, 2014. Retrieved from www.crirsco.com/docs/H_Parker_Finex.pdf. Accessed: 26 April 2016.